Mejor Forex Pair Scanning Session – 4Scanning multiple forex pairs to filter high-quality trade setups. No trades forced, only structure-based opportunities.
Search in ideas for "FOREX"

Major Forex Pairs Scanning Session - 3 Scanning multiple forex pairs to filter high quality setups , during the cpi event ..

Mejor Forex Pair Scanning Session – 1Scanning multiple forex pairs to filter high-quality trade setups. No trades forced, only structure-based opportunities.

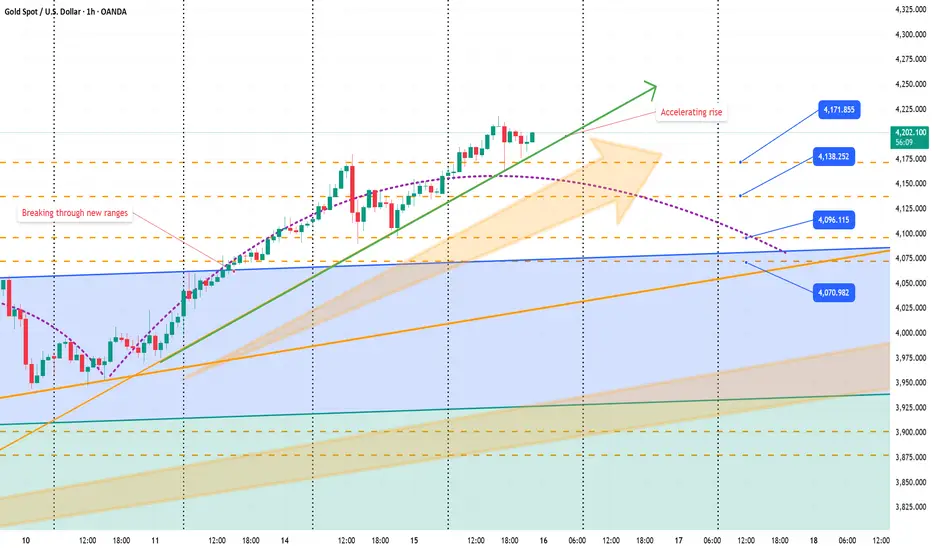
October 15th Gold and Forex AnalysisOctober 15th Gold and Forex Analysis
Viewpoint: The current international spot gold price is around 4190. Today's high of 4218 represents a $76 increase from the previous trading day. While the increase is not significant compared to the past few days, this surge was driven by Powell's remarks and the continued US government shutdown. The current market rally may be accelerating, or it could be the final frenzy (due to sudden negative news). I would like to remind everyone to set a stop-loss order to protect your principal.
Technical Analysis
Daily Chart Level: Following an Upward Cycle
1. Trend and Rhythm: The daily chart closed with a full, large bullish candlestick, confirming a strong bullish pattern. The market is currently following a typical upward cycle: consecutive rising highs -> consolidation at high levels -> a single bearish pullback -> continued upward momentum.
2. Key Positions:
Resistance: The current price has broken through the previous high, and there is currently no clear resistance above. Focus on inertial upward momentum. Support: 4100 (the 5-day moving average moving up tomorrow) has become the core lifeline of the current bullish trend. The second highest support level is 4050 (the 10-day moving average).
3. Future Forecast:
Today (Wednesday) is likely to see another positive close, continuing the strong trend.
Tomorrow (Thursday), be highly alert to the possibility of a single-day bearish pullback, targeting a test of the 5-day moving average support level near 4100 yuan/gram.
If a pullback occurs, it should be viewed as a "squat and jump" opportunity, a rare opportunity to enter the market at a low point within the trend.
4-Hour Level: Keep a close eye on the moving average support.
1. Current Trend: This cycle exhibits a "consecutive bullish and single-day bearish" pattern of forced gains, with the moving average system showing a perfect bullish alignment.
2. Dynamic Support:
Strong Support: 4180 (the current 5-period moving average). As long as the price remains above this line, the market remains extremely strong.
Key Support: 4156 (the current 10-period moving average). This is a short-term watershed between bulls and bears. Only a significant break below this level would signal the end of this short squeeze rally, ushering in a deep correction toward the middle band.
Note: The above support levels will shift upward rapidly over time and require dynamic tracking.
Hourly Level: High-Level Oscillation
1. Intraday Trend Review: The strong rally in the Asian session exceeded expectations. After accurately touching 4218 (the upper band of the hourly chart channel) in the European session, the price plummeted to 4165 before rebounding, confirming the effectiveness of the channel resistance.
2. Night Trading Range:
Upper Resistance: 4220 - 4225 (derivative of the upper band of the channel). If this area is touched, monitor for signs of resistance and attempt a short-term short position.
Lower Support: 4170 (the middle band of the hourly chart and the previous channel retracement point). If it falls back to this area, monitor for signs of stabilization, using it as an entry point for intraday long positions.
Strategy: The market is likely to fluctuate strongly at high levels. We recommend looking for opportunities to buy low and sell high near resistance and support levels, focusing on short-term trading.
Trade with caution and manage risk. Best of luck!
NZDUSD forex trade, scalp probabilityNZDUSD forex trade, scalp probability. NZD looks bullish on 15m time frame. OB identified for additional reference.

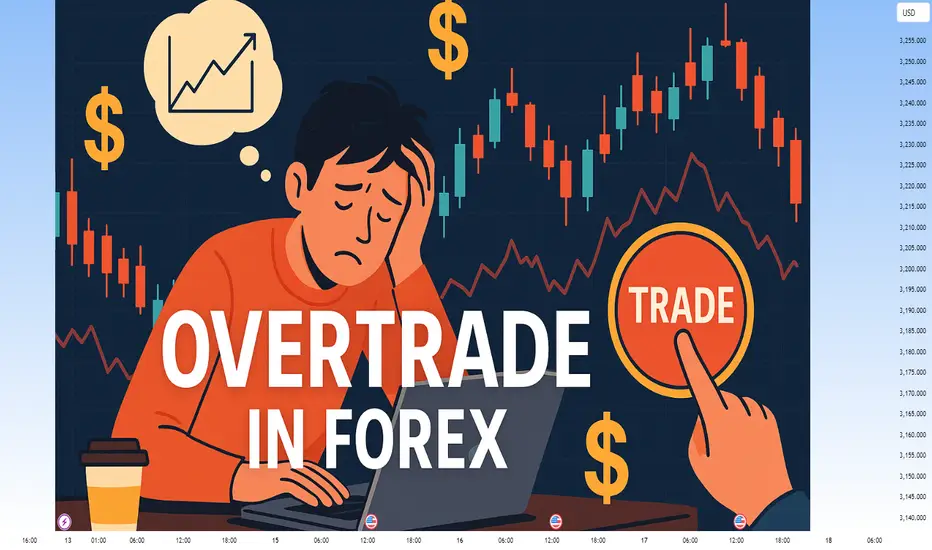
TRADER PSYCHOLOGY - Overtrading The Silent Killer of ConsistencyTRADER PSYCHOLOGY | EPISODE 1: Overtrading – The Silent Killer of Consistency
In the dynamic world of forex trading, success doesn't come from doing more — it comes from doing right. Yet many traders, especially full-time traders in India, unknowingly fall into a common psychological trap that slowly erodes both their capital and confidence: Overtrading.
Let’s break it down — what overtrading is, why it happens, and most importantly, how to stop it before it burns through your progress.
🧠 What Is Overtrading in Forex?
Overtrading refers to excessive trading – opening too many positions without clear signals or justification based on your strategy. In most cases, it’s driven by emotion, not logic.
It usually shows up in two forms:
Trading out of boredom or the urge to “do something”
Trying to recover from previous losses (a.k.a. revenge trading)
Over time, this behavior becomes a habit — and like most bad habits in trading, it’s expensive.
⚠️ Signs You Might Be Overtrading
If you answer "yes" to any of these, it’s time to check your discipline:
Do you feel uncomfortable when you’re not in a trade?
Do you enter trades even when your system says “no trade”?
Do you keep switching charts hoping to “find a setup”?
After a losing trade, do you jump right back in to recover?
Have you lost more to fees/spread than actual price movement?
🧩 Why Indian Traders Often Fall Into Overtrading
🔹 The Action Bias
Traders often feel they must "do something" to be productive. In reality, sitting out is a strategy — especially when markets are flat or unclear.
🔹 Pressure to Perform Daily
Many traders in India try to generate consistent income from trading — and assume they must win every day. That pressure leads to forcing trades just to “hit targets.”
🔹 Overconfidence After a Winning Streak
Success leads to confidence — but too much confidence without structure leads to impulsive trading. One good day shouldn’t convince you that you’ve mastered the market.
🔥 Consequences of Overtrading
Overtrading doesn’t just hurt your account — it breaks your mindset.
Capital Depletion: Small losses + transaction costs = big drawdown over time
Mental Burnout: You feel drained, frustrated, and reactive
Lack of System Trust: You abandon good strategies because you never followed them properly
Emotional Instability: You start making decisions based on fear or revenge, not analysis
✅ How to Control Overtrading – Practical Steps
1. Limit the Number of Trades Per Day
Set a clear rule — e.g., “Maximum 3 trades per day.” This forces you to choose the best setups and ignore mediocre ones.
2. Keep a Simple Trading Journal
Write down:
Why you took the trade
Whether it matched your plan
Your emotional state
Reviewing this weekly will reveal patterns you never noticed in real time.
3. Block Out Non-Active Trading Hours
For Indian traders, this might mean avoiding low-volume periods like mid-Asia session. Focus on London or US overlap hours — when liquidity and volatility are high.
4. Understand: Not Trading Is Still Trading
Being flat (no position) is a strategic decision. Markets reward patience, not impatience.
🎯 Final Thoughts
Overtrading is not a technical issue — it’s a mindset issue.
When you feel the urge to “do something,” remind yourself: the best traders don’t trade all the time. They wait, they observe, and they only act when everything aligns.
"The market doesn’t pay you for activity — it pays you for accuracy."
If you want to grow consistently, you must master the art of waiting, filtering, and executing with purpose.
📌 Next in the Series:
TRADER PSYCHOLOGY | EPISODE 2: FOMO – How Fear of Missing Out Destroys Good Decisions
Follow this page to get notified when it drops!
Market / forex Trading pair / Money / funding account Time fMarket / forex
Trading pair /
Money / funding account
Time frem / 30 minute
Logic /break out and session
Time
Day trade / only one trade
Lot size / 0.01
Stop loss (pips ) / $30
Target 🎯 (pips) $90
Risk & reward / 1 : 3
SL Trail / 1:2 $(60 pips )
Trade exit / no exit any other condition
Emotion / no emotion
Discipline / believe in your trade plan
Multi TimeFrame SuperTrend Indicator for Forex TradingMulti TimeFrame SuperTrend Indicator for Forex Trading

silver Divergence TradingTrend lines are among the most accurate buy and sell indicators, along with simple moving average, stochastic, moving average convergence divergence, and relative strength index being the top trading indicators that help traders analyze the market signals effectively.
The best divergence indicators mt4 are MACD, RSI, stochastic, OA. They are user-friendly and simple but provide quite accurate trading signals. You can learn more about stochastic oscillator trading forex in the article Stochastic Oscillator: guide for using indicator in Forex trading.

Looking for trade setup on Gold. Have a look at this. XAU/USD.XAU/USD on daily timeframe has switched from bullish to bearish but it’s still Bullish on weekly. We will take about weekly later but daily chart itself is speaking a lot of things.
We marked the market structure and it can be seen that there are multiple Orderblocks and Fvg that are pending and has to be mitigated before getting into Bullish bias.
For buy our plan would be to wait for any continuation trend on smaller time frame usually in 1Hr or 15min. For sell setup we would wait for a market structure shift on 1HR or 15min time frame. We are neutral for now & we need more validations. We have weekend coming. Forex & Commodity market doesn’t really have the volatile Mondays.
For a really nice setup we would have to be patience and need to follow our plan of action.
Follow us any stay updated with more setups tuning in.
Appreciate you’ll time.
Note this is for educational purposes only.

BTC |GOLD | PRICE ACTION ANALYSIS | 21 NOV | HINDIThanks for watching today's Forex and crypto market analysis!
In this video, I break down the latest price action movements for major Forex pairs, Bitcoin (BTC), and Gold. I focus purely on price action to help identify key levels and potential trade opportunities. If you enjoyed the content, please like, subscribe, and hit the notification bell for daily updates on the markets.

BTC | GOLD | PRICE ACTION ANALYSIS | 20 NOV | HINDIThanks for watching today's Forex and crypto market analysis!
In this video, I break down the latest price action movements for major Forex pairs, Bitcoin (BTC), and Gold. I focus purely on price action to help identify key levels and potential trade opportunities. If you enjoyed the content, please like, subscribe, and hit the notification bell for daily updates on the markets.

BTC | GOLD | PRICE ACTION ANALYSIS | 18 NOV | HINDI Thanks for watching today's Forex and crypto market analysis!
In this video, I break down the latest price action movements for major Forex pairs, Bitcoin (BTC), and Gold. I focus purely on price action to help identify key levels and potential trade opportunities. If you enjoyed the content, please like, subscribe, and hit the notification bell for daily updates on the markets.

BTC | GOLD | MAJOR PAIRS | PRICE ACTION ANALYSIS | 16 NOV |HINDIThanks for watching today's Forex and crypto market analysis!
In this video, I break down the latest price action movements for major Forex pairs, Bitcoin (BTC), and Gold. I focus purely on price action to help identify key levels and potential trade opportunities. If you enjoyed the content, please like, subscribe, and hit the notification bell for daily updates on the markets.

BTC | GOLD | PRICE ACTION ANALYSIS | 12 NOV | HINDIThanks for watching today's Forex and crypto market analysis!
In this video, I break down the latest price action movements for major Forex pairs, Bitcoin (BTC), and Gold. I focus purely on price action to help identify key levels and potential trade opportunities. If you enjoyed the content, please like, subscribe, and hit the notification bell for daily updates on the markets.

XAUUSD | BTCUSD | MAJOR PAIRS | WEEKLY ANALYSIS | 09 NOV | HINDIThanks for watching today's Forex and crypto market analysis!
In this video, I break down the latest price action movements for major Forex pairs, Bitcoin (BTC), and Gold. I focus purely on price action to help identify key levels and potential trade opportunities. If you enjoyed the content, please like, subscribe, and hit the notification bell for daily updates on the markets.

BTC | XAUUSD | PRICE ACTION ANALYSIS | 28 OCT | HINDIThanks for watching today's Forex and crypto market analysis!
In this video, I break down the latest price action movements for major Forex pairs, Bitcoin (BTC), and Gold. I focus purely on price action to help identify key levels and potential trade opportunities. If you enjoyed the content, please like, subscribe, and hit the notification bell for daily updates on the markets.

BTC | GOLD | PRICE ACTION ANALYSIS | 24 OCT | HINDIThanks for watching today's Forex and crypto market analysis!
In this video, I break down the latest price action movements for major Forex pairs, Bitcoin (BTC), and Gold. I focus purely on price action to help identify key levels and potential trade opportunities. If you enjoyed the content, please like, subscribe, and hit the notification bell for daily updates on the markets.

BTC & Gold Price Action Analysis | Key Levels and Trade SetupsIn today’s video, I dive into the latest price action analysis for Bitcoin (BTC) and Gold. We’ll be breaking down key support and resistance levels, identifying potential breakout zones, and discussing trade setups you can keep an eye on.
Thank you for watching! If you found this analysis helpful, don’t forget to like the video and subscribe to the channel for more in-depth market analysis and swing trade ideas. Your support helps me continue bringing you high-quality content every week!
Feel free to share your thoughts in the comments below and let me know which asset you’re keeping an eye on this week.
Happy trading!
#BTC #Gold #PriceAction #TradingAnalysis #Forex #SwingTrading

Strategic Sell Trade Opportunity for EUR/CHF in Forex Market
**Description:**
Dive into the strategic fundamentals behind a buy trade in the EUR/CHF currency pair. This trade idea leverages the economic strengths and monetary policies of the Eurozone and Switzerland, providing insights into the potential bullish momentum for EUR/CHF.
**Fundamental Analysis:**
The Eurozone's economic outlook has been showing signs of resilience, with improving GDP growth rates, lower unemployment, and steady consumer confidence. The European Central Bank (ECB) has maintained accommodative monetary policies, which support economic growth and inflation targets.
In contrast, Switzerland, known for its strong currency and safe-haven status, has faced challenges with low inflation and slower economic growth. The Swiss National Bank (SNB) continues to implement negative interest rates and intervene in the forex market to curb excessive appreciation of the Swiss Franc, which can hamper export competitiveness.
These diverging economic conditions and monetary policies between the Eurozone and Switzerland create a fundamental case for a potential bullish move in EUR/CHF. Investors may find the Euro more attractive relative to the Swiss Franc, driving the pair higher.
**Disclaimer:**
Trading forex, including the EUR/CHF pair, involves significant risk and may not be suitable for all investors. The high leverage associated with forex trading can result in substantial losses, and past performance is not indicative of future results. It is crucial to conduct your own research, consider your risk tolerance, and seek advice from independent financial advisors before making trading decisions.

Chrono Trades: Indexes-Stocks- Commodities-FOREX-CRYPTOSChrono Trades: Barometer of financial markets:Indexes-Stocks- Commodities-FOREX-CRYPTOS
A market brief of the different underlyings : FOREX- SP500-Bitcoin-NVIDIA-TAT MOTORS-NIFTI-GOLD-Oil wti- etc...

EURUSD: Bears continue to dominate the market!Hey there, forex family! Today, EURUSD takes a momentary pause as the global market enters a holiday period. However, looking ahead, the US dollar is strengthening, influenced by hawkish sentiment surrounding the Federal Reserve and expectations of higher interest rates.
Technical analysis adds to the story, as the price breaks below the 1.0800 support level and trades below both the EMA 34 and 89, currently favoring the sellers. Our preferred move is to target a decline to the 1.0700 level.
