DAILY FREE FOREX SIGNALS FOR 12-03-2019 RFXSIGNALSGBPAUD SELL-1.86707
SL-1.87970
TP1-1.86290
TP2-1.85838
CHFJPY SELL-110.046
SL-110.369
TP1-109.829
TP2-109.615
GBPJPY SELL-146.742
SL-147.500
TP1-146.443
TP2-146.111
GBPCHF SELL-1.33328
SL-1.34123
TP1-1.32941
TP2-1.32543
CADJPY SELL-82.985
SL-83.311
TP1-82.819
TP2-82.665
USDJPY SELL-111.268
SL-111.552
TP1-111.119
TP2-110.920
Result will come soon
#fx #forex #fb
Search in ideas for "FOREX"

GREAT BUY AND SELL SIGNALS BY OUR TRADING MACHINE INDICATORADVANTAGES OF USING OUR INDICATOR:
1. AUTO BUY/SELL SIGNAL
2. EASY TO USE
3. AUTO STOP LOSS TRIGGER
4. STABLE PROFIT DAILY
5. OVER 300% OF RETURN PER MONTH
6. SUPPORTS ALL EXCHANGES INCLUDING BITMEX LEVERAGE TRADING AND FOREX
7. SPECIALLY DESIGNED FOR BITMEX
TO BUY THIS TRADING MACHINE AT 0.05BTC CONTACT US ON TRADINGVIEW OR U CAN ALSO MESSAGE US ON TELEGRAM @marianzs
OUR TELEGRAM CHANNEL ID IS: @cryptony123

USD INR Target @ 66.60-54 INFI FOREXUSD INR spot @ 67.04 ( trading near to support) pair is forming series of lower high, now it’s overall expectation for bearish (strong of Indian Rupee), will expected to test 66.60-70 in coming sessions.
Exporters are suggest to hedge this level 67.00 to 67.10,
Importers are open for the near term.
Short @ 67.10-67.00
Target @ 66.60-66.54
Currency DRIVE by INFI Forex

USD INR short @ 67.52 INFI FOREXShort @ 67.52 ( spot) for
Target of 67.00 -6.80
Strategy;
Exporter: Hedge 45-50% at 67.50 Level
Importer: Open till 67-66.80
INFI FOREX

USD JPY @ 107.80 Forex Risk Management SolutionsUSD JPY Spot @ 106.90, In march this level have been tested several times, now we can expect as it’s break 106.90-92, inverted head and shoulder will be confirm. US $ will be strong and Yen will be week and we will see levels @ 107.80-84 and than 108.60
Currency Drive By INIFI FOPREX
Forex Advisory
Forex Risk Management Solutions

USD INR CURRENCY DRIVE INFI FOREX @64.40USD INR spot 64.80, now market forming potentially double top, now it's expected to test 64.40 in coming sessions
CURRENCY DRIVE INFI FOREX

USD INR Currency Drive By INFI FOREX USD /INR spot @ 64.90 from last one month pair is ranging from 64.80-65.20-30, ones in a mid of month on 13th march market break 64.80, but unable to sustain below that, and keep in range 64.80-65.30, now market is potentially trying to form double top, now as it’s break 64.82-80, and test again, it would be confirm, for the target of 64.40.
Strategy: for the traders can go for short @ 64.84-82, for the target of 64.40, will also get premium.
Strategy for Business:
Exporters: Suggest to hedge @ 64.90 30% of their exposer, and 64.80 balance 40% of their 1 to 1½ month exposer, And balance open.
Importers: No need to hedge @ this levels, go open till the 64.40 @ 64.40, hedge at least 50% exposer. And remain open till next move.
Currency Drive By INFI FOREX
“Makes Fx Simplified”
Forex Risk Management
Currency Risk Management

USD INR Currency DRIVE INIF FOREXUSD INR Spot is 65.19, from March starting market ranging from 64.80-65.30, after testing the level 65.30 thrice in last 2 days and in the starting of March, but market still unable to break this, now market is above the middle line of the ranging that is 65.10, as market break 65.10 will test 64.80 then 64.40, on the other hand if market unable to break 65.10, it would expected to bearish towards 65.60-80
Currency DRIVE INIF FOREX
Forex Risk Management services

USD INR CURRENCY DRIVE, FOREX RISK MANAGEMENT USD INR Spot 64.81, after a strong rally yesterday market test 64.91( 3 months High), now trading in range 64.74-92, it’s expected before break 64.92, it would be ranging from 64.55-64.90.,
INFI FOREX ADVISORY
CURRENCY DRIVE
CURRENCY DRIVE INFI FOREX
"Makes FX Simplified"

EUR INR CURRENCY DRIVE Forex AdvisoryEUR INR Spot at 79.99, after testing the high 80.35, It’s highly expected market would be corrected till 79.33-30 (65%), and 78.54 (35%), as it’s break 79.84, in coming sessions, traders can go for short and also take premium advantage for coming sessions. Exporters are advise to hedge at least 60-70% at 79.80 to 80.04, and Importers are free to hedge till 78.60.
ON the other hand if it’s also forming Bullish Flag, if it’s break 80.24, will test 81.30 ( EUR INR Bullish less chances as EUR USD is expecting to depreciate till 1.2010)
CURRENCY DRIVE by INFI FOREX
Currency risk management Advisory
Forex Advisory
INIFI FORX ADVISORY

EUR USD @ 1.2010 ? FOREX RISK MANAGEMENT SERVICES CURRENCY DRIVEEUR USD spot 1.2361, After Testing 1.2510 Twice, It’s expected that if this break 1.2510 level, will test 1.2780, unfortunately market did not break and now trading at 1.2360, now expected level is 1.2240-42, if it would break this level , potentially double top will be form, and the target would be 1.2010.. CURRENCY DRIVE INFI FOREX
CURRENCY RISK MANAGENENT ADVISORY/
FOREX RISK MANAGEMENT SERVICES

ULTIMATE Strategy : Huge profit ratio : WATCH THIS**Hello traders !
My name is Alex 0.19% 0.19% and Im a 21 years old trader and business man from Canada.
For the last 3 months i've work on finding the perfect stochastic/rsi combo on multi time frame .
I've found and backtested a lot of system using 3 to 8 different time frame stochastic/rsi at the same time .
Some of these system are giving me a 75% win ratio with R/R : 1 , without** any other technical analysis . (584/786 trade test on 6 months , 10 major pairs , specific TP and SL ) -- Forex & Oil 0.00% -0.02%
But when we add these system with a technical analysis ( Fibonacci , trend , support , etc.. ) , It's another game : huge profit ratio , small or no drawdown & unreal risk/reward.
By following me you will receive some good technical analysis wich I use in combo with alot of different RSI/stoch system .
If you want to trade this strategy by yourself I recommand that you practice in demo before .
The indicator is CM 0.64% 0.64% Stochastic Multi-TimeFrame , thanks a lot to the creator ! ( See in related ideas )
Otherwise if you want some additional information you can contact me in private.
If wou want to thanks me , please like & follow .

USDINR - For NSE Forex TradersOANDA:USDINR
CMP - 68.087
Here, I have drawn the important lines.
Now trade their support, break and retest.
50 DMA will assist you.
Have a specific strategy of position sizing and stop loss which suits your trading plan .
Personal suggestion - After entering on a signal candle, exit the trade when 2 more candles are formed, the close of it, that is, 2 hours.
Thanks.
U

NSE FINNIFTY - Price Action BreakdownNSE FINIFTY is trading in the value area for more than 43 weeks. The price has overall three excesses at the upper band and three excesses at the lower band. This signals bull dominance. The control line validates itself with 11 touches.
Traders must look at the following scenario:
1. Price is at the control line, and 200 EMa has worked as crucial support. This is a powerful hurdle and can change the trend. This can reach up to 27500 - 28100 .
2. If sellers outnumber buyers by closing below the control line and EMAs, the next support level would be around 25,926.
We will update further information soon.

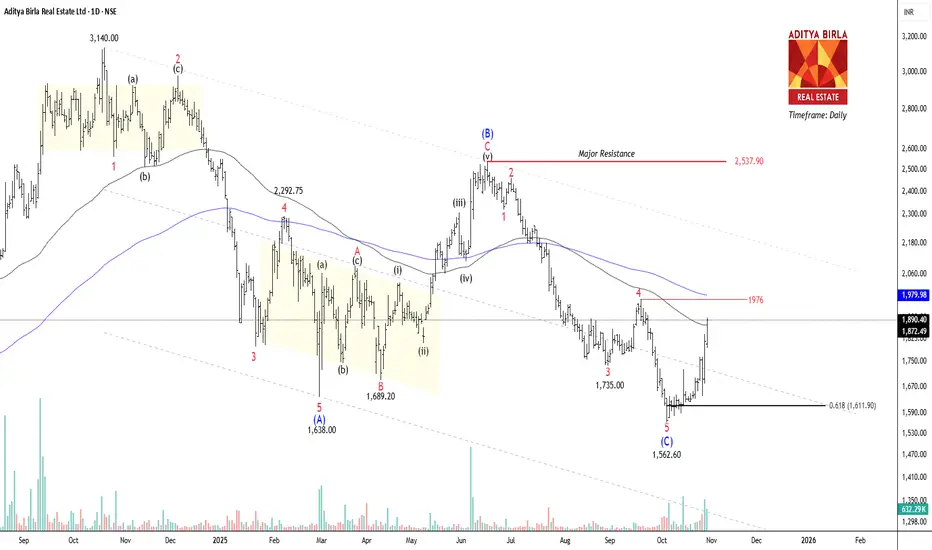
NSE ABREL – Identifying Trap Scenarios and Confirmation TriggersNSE ABREL has constructed a corrective A-B-C formation on the daily timeframe chart. The price has fallen 50% from the all-time high of 3410 within 13 months. Wave (B) occurred at 2537.9, where Wave (c) completed the 5-wave cycle at 1635. If the price breaks and closes above 1976, traders can buy for the following targets: 2080 – 2140 – 2185+.
Why can’t we label it early?
We can assume wave (C) is 100% agreed upon without any confirmation. It can be a huge mistake if the price falls below 1880 again; this could signal a complex corrective extension.
Our targets are up to the upper band only because the alternate count says this bounce might still be a wave 4. The move is sharp, but corrective wave 4 rallies often look impulsive.
The trend remains down until the channel is broken.
Important Factors:
Volume Analysis:
Volume on the latest bars is increasing, but not enough to scream “trend reversal”. We need a volume breakout, not just price.
Failure Zone:
Rejection at 1976 = Ugly pullback to 1730 -1700.
Invalidation:
Closing below the Fibonacci retracement 0.618 at 1611 will make this count invalid due to the formation of new lower lows.
Alternative count:
We will look for one more downward move of the ending diagonal (Wave E) before printing the bottom!
NSE GLAND: A Critical Resistance Zone That Could Shift the TrendTimeframe: Daily
In NSE GLAND, the price has respected the channel in three distinct moves, indicating a potential 3-wave correction setup. Currently, it is trading below the 50 and 100 EMA, with ATR at 55.96 and ADX at 42.07 .
After reaching a high of 2220 , the price declined and formed a corrective structure. Wave (A) completed at 1585.7 , followed by wave (B) at 1964 . Presently, wave 4 of wave (C) is in formation. The 1545-1585 zone serves as a strong resistance, where a decisive breakout could shift the trend. However, the price still needs to reach 1328 to complete a 100% extension of wave A, making wave C = wave A at 1328 . A strong throw-under could enhance the probability of revisiting levels near wave (B).
We will update further information soon.

NZDUSD: The Calm Before a Bearish StormNZDUSD has broken below the 50/20 EMA on the 4-hour timeframe chart. The price experienced a sharp decline, followed by a corrective pause that appears to form an expanded flat correction. Wave (C) completed at 0.5692 . The ATR has decreased to 0.00189 , while the ADX has dropped to 22.87 .
The impulsive move is expected to occur downward. If the price breaks below wave B at 0.55870, it may reverse from the following targeted Fibonacci levels : 0.5555 (1.618) and 0.5470 (2.618).
We will update further information soon.

NSE ASIANPAINTS - At the Edge of Kinfe Timeframe: Daily
NSE ASIAN PAINTS has been undergoing a corrective phase for about 80 weeks, with its price confined within a range of 3329 – 2938 , excluding excesses. The ADX indicator has declined to 21, while the average true range (ATR) stands at 43. Presently, the price has breached the 20-day exponential moving average (EMA) and is trading below the 50, 100 , and 200 EMAs.
According to the wave principle, the price has formed a corrective formation A-B-C. Wave (B) occurred at 3422.9 , and wave (C) has taken place. Wave (C) has already reached 100 % of wave (A), indicating equality between wave (A) and wave (C). Sub-wave 4 of wave (C) is expected to occur, followed by wave 5 of wave (C). A buying opportunity may arise if the price breaks above the wave A – C line and maintains levels above 2931. Targets for the Long position would be 3026 – 3152 – 3285+.
We Will update further information soon.

EWT – Can Bulls Push NSE JIOFIN to New Highs?Timeframe: Daily
After hitting a low of 202.8, NSE JIOFIN has formed an impulsive cycle. Wave ((2)) has not retraced more than 100% of Wave ((1)). Sub-Wave (3) is a powerful extended wave, reaching 261.8% of the Fibonacci extension of Wave (1). The price has completed Wave (4) at 307, marking an exact 50% retracement of Wave (3).
The impulsive structure is expected to resume following a breakout above the corrective slope. However, if the price encounters strong resistance at the upper channel, there is also a possibility of a triangle formation on the daily timeframe chart. The 337 level will pose a significant challenge for the bulls to overcome.
According to the alternative chart, the price has completed Wave D at 337.95 and has begun forming Wave E. If the price doesn’t break below the low of Wave C, Wave E could alternatively be interpreted as a 1-2 wave formation. If price breaks out 338 , traders can trade for the following targets: 360 – 383 – 405 +. A breakdown of Wave A at 307 will require a reassessment of the entire wave structure
We will update further information soon.

PNB - Technical Analysis of Punjab National Bank - Buy & HoldTechnical Analysis of Punjab National Bank (PNB)
Overview of the Stock - The chart provides a technical analysis of Punjab National Bank (PNB) on the hourly timeframe. It includes price action, Fibonacci retracement levels, a moving average (EMA200), and RSI indicator.
Key Observations based on Technical Analysis
Price Action:- The price has been in a downtrend, forming lower highs and lower lows.
There has been a recent attempt to recover, with the price bouncing from the 0.236 Fibonacci retracement level. The current price is hovering near the 0.382 Fibonacci level, which could act as a resistance level.
Fibonacci Retracement: - The price has retraced to the 0.382 Fibonacci level, which is often a significant retracement point. Breaking above this level could indicate a potential reversal of the downtrend.
Moving Average (EMA200): - The price is currently below the EMA200, suggesting a bearish trend. A sustained move above the EMA200 could signal a potential bullish trend reversal.
Relative Strength Index(RSI (14)):- - The RSI is currently at 32.09, indicating oversold conditions. An oversold RSI can sometimes precede a price reversal. However, it's essential to consider other factors before making a decision.
Potential Scenarios:- As per my technical analysis and observation based on previous chart history and current chart pattern along with price action there are two trend scenarios:-
Bullish Scenario: - A sustained break above the 0.382 Fibonacci level and the EMA200 could indicate a potential bullish reversal. The next resistance levels to watch are the 0.5 and 0.618 Fibonacci levels.
Bearish Scenario: - If the price fails to break above the 0.382 Fibonacci level and starts to decline again, it could signal a continuation of the downtrend. The next support levels to watch are the 0.236 and 0.168 Fibonacci levels.
My Personal Opinion about the stock
Buy: Consider a long position if the price breaks above the 0.382 Fibonacci level with strong bullish momentum and closes above the EMA200.
Sell: Consider a short position if the price breaks below the 0.236 Fibonacci level with strong bearish momentum.
Remember: This analysis is based on a single chart and a limited timeframe. It's crucial to conduct further analysis, consider other indicators, and manage risk effectively before making any trading decisions.
Disclaimer: This analysis is based solely on the provided chart and does not constitute financial advice. It's crucial to conduct thorough research and consider multiple factors before making investment decisions.
Thanks for your support as always

BHANDARI - Bhandari Hosiery Exports Ltd - Long Term Buy & HoldAs per previous chart history and current chart pattern along with my technical analysis with the help of indicators, I personally feel that this stock should be in our portfolio.
You can buy this stock at CMP@7.44 or wait for a dip to enter in the buy trade. Also you can wait for the safe buy point which is above 8.85
Also I suggest to buy this stock at every DIP to accumulate average
This is my personal opinion and please do your own research and check fundamenta analysis before buying this stock because I am not SEBI registered person to suggest any stock.
Thanks for your support as always

GBPCAD SHORT HI guys all of us doing good today we will be bring in our GBPCAD short review and support it guys,more updates stay tuned guys

EUR GBP SHORTHI guys all of us doing good today we will be bring in our EURGBP short review and support it guys,more updates stay tuned guys
