Trade Setup For AUDUSDThe 4-hour right side is up against 5/04/2020 low (0.6373). 1 hour is turning up against 0.6772 low. Near-term, while dips remain above there expect pair to extend higher 1 more push before correction against 2012 peak ends as a zigzag structure & resume the downside.
Short term Signal
Sell AUDUSD
@0.6910.6925
Target: 0.6805
Sl: 0.6955
Good luck !
Search in ideas for "FOREX"

YES BANK headed towards the 76.85 level.The bank has been in a down trend for sometime now and looks like more is yet to come. Looking at the weekly chart, the bank is sitting on a very crucial level of 116.20 (which is on the trend line ), down below the 120.50 major support. There are chances for the prices to climb for a short moment, owing to the positive divergence between the price and the RSI indicator. But ultimately, the bank is very likely to go down. The expected price for it to reach is 76.85.

Ger30 (DAX) Trade SetupTechnical Analysis-The 4 hour is turning up against 3/16/2020 low as the Daily correction has ended. 1 hour is turning up. However, while near-term bounces fail below 10988 high expect index to extend lower for few more lows before it finished correcting the cycle from 3/16/2020 low as a zigzag structure & resume the upside.
Sell GER30
@10340-360
TP: 10090
Sl: 10420
Good luck !

USDJPY LONG TRADE SETUPThe weekly right side is up against 75.57. The daily and 4 hour are turning up against the 3/9/20 lows. While a pullback remains above the 3/9/20 lows the pair can see another swing higher to correct the cycle lower from the 12/15/16 highs in the weekly triangle.

WEEKLY USDJPY FORECAST The weekly right side is up against 75.57. The daily is turning down against 114.54 high from 10/4/2018. While below 111.67 where the hourly right side is down expect the pair lower. While the pullback remains above the 101.13 lows where the 4 hour is turning up it can see another swing higher to correct the cycle from the 10/4/18 highs.

USDCHF sell trade @H4 chartUSDCHF
As CHF is considering as one of the safe heaven assets along with JPY its gained some strength during this financial crisis time
The Elliot wave is forming in this chart we can see that Wave 02 is almost completed and stated its run to complete the wave 03
It will form descending channel.
We can open short positions at this level which is 0.96400
0.94300 would be a resistance level we have keep eye on this level
Primary target would be 0.93100
And the final target would be 0.91900
Stop lose may placed above the 0.96900 level

EURUSD another round of bullish trendEURUSD
EURUSD currently completes its Elliot correction wave of C which is further signalling the buyers are in near term control
From the current level 1.10000 which is a major psychological level, We can open long positions
Primary target would be 1.11400, Which is recent resistance level
Stop lose may placed below the completion of Wave C
Leave your comments below

USDCAD Elliot impulse wave formationUSDCAD
The oil dependant canada is nowdays struggling to recover as the oil prices are are at low level and currently trading at 20 dollar per barrel
Which inturns its affects the CAD negatively
Currently in USDCAD Elliot wave if forming, Wave 01 is completed and wave 02 is forming
We can expect to close this wave at resistance level 1.42100 which is also a 61.8% Fibonacci
From this level we can open short positions and the primary target would be 1.37270 which is a 1.272% Fibonacci
And the final target would be 1.33280 which we are expecting the point where the wave 05 going to close
Stop lose may placed above the 1.43050 level which is a 50% Fibonacci
Leave your comments below

GOLD Triangle formationGOLD
Gold has crossed the major psychological level which is 1600.00
And currently trading at 1620.00 level
It has broke the triangle formation and reached the top side level of 1620.00
We can expect short term fall back towards 1606.00 level
From this level suitable long position may open at 1606.00
Take profit will be 1628.00
Stop lose may placed below 1597.00
Leave your valuable comments below

EURUSD is trading in a rising channelEURUSD
EURUSD is trading in a rising channel. So far the Channel support was not broken
Weakness in USD will support the long in EURUSD
Suitable long positions may open at 1.08545
Potential take profit will be 1.10140
Stop lose may placed below the channel support level 1.07800
Leave your comments below

XAUUSD SHORT TERM TRADE SETUPGold is favored to have ended the cycle up from 8/16/2018 lows where the daily right side is up. The 4 hour is turning down against the 2/24/20 highs at 1689. While below there the metal can continue lower to correct the cycle up from the 8/16/18 lows.

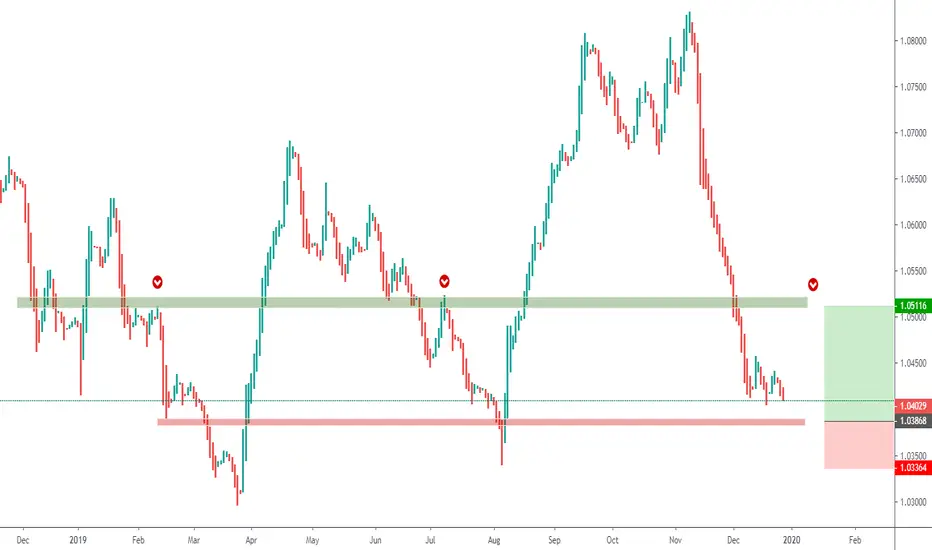
GBPUSD TRADE SETUPThe pair ended a cycle up in wave ((1)) from the 9/3/2019 lows at 1.3519 on 12/13/19. From there a cycle in wave (A) ended at 1.2904 & wave (B) ended on 12/31/19 at 1.3284 to correct the cycle lower from the 12/13/19 highs . While below 1.3066 where the hourly right side is down a turn back lower to correct the cycle from the 9/3/19 lows can further develop. While it shows it will remain above the 9/3/2019 lows where the 4 hour right side is up it can see another swing higher in the correction of the cycle lower from the 4/17/18 highs.

XAUUSD TRADE SETUP Gold is favored to remain in the cycle up from 8/16/2018 lows where the daily right side is up. The 4 hour right side is up against the 1/14/20 lows at 1535. While above 1547 where the hourly right side is up the metal can see strength continue toward the 1670-1700 area before it corrects the cycle from the 1/14/20 lows.

BTCUSD - and what?Morning Traders,
If you take position after price breakup trough TL2 that that was outstanding and easy position.
I have created Channel but the price did not reach upper line of the channel.
I just waited for candle to be closed. On the lower TF momentum slows down.
But we have wait until price either break trough the TL of the channel or rises higher.
And that perhaps is price doing right now. Look like price is loosing momentum pay close attention what is happening on chart.
But keep in mind that this is four hours candles anything can happen in that time.
Thank you for like it my analysis.

GBPUSD Forecast for the dayThe pair ended a cycle up in wave ((1)) from the 9/3/2019 lows at 1.3519 on 12/13/19. From there a cycle in wave (A) ended at 1.2904 where the hourly is turning up. While a bounce fails below the 12/13/19 highs it can see a pullback correct the cycle from the 9/3/19 lows. While it shows it will remain above the 9/3/2019 lows where the 4 hour right side is up it can see another swing higher in the correction of the cycle lower from the 7/15/14 highs.

AUDNZD SHORT TERM BUYAUDNZD
The pair trading in a bearish market since November last week.and erase most of the gains.
Now its trading at major resistance level at 78.6% Fibonacci
From the 1.03900 level we can open buy orders and Potential take profit will be 1.05100
Stop lose may be placed at 1.03360 level
AUDJPY LONG @ DAY CHARTAUDJPY
The fundamental factor causing the negative pressure on JPY and the industrial outputs are stumbling and BOJ are in the verge to cut the rates in coming months
this pair currently trading at 76.350 level and may retrace back towards 75.850
There we may open the buy orders and potential take profit will be 78.650. Its a 280 pips target.
Stop lose may placed at 75.100
Leave your valuable comments

USDJPY waits necline breakout of inverted H&SUSDJPY has formed a classic inverted head and shoulder pattern on a daily basis. The prices are trading very close to the neckline and we might see a breakout soon. furthermore, the weekly chart has formed a bullish engulfing pattern as well that supports the bullish argument. Like always, the price can take two paths, the first one is highlighted by the blue arrows - neckline breach (sustains on a daily basis) to reach the first target of 110.472. If the prices sustain above this level, it will go for the next 112.00 hurdle. If this happens, we will have 107.00 as the stop loss. The second path is shown by orange arrows with prices first testing the tip of the second shoulder and then taking a breakout from the neckline. Either way, prices are headed for the 112.00 and in both cases, we will enter only when the neckline is breached and sustained.

Breakdown from Ascending Broadening WedgeGBPCAD after retracing 38.2% of the 6th May to 12th august trend has now fallen below the ascending broadening wedge pattern, which makes it vulnerable to selling up to 1.60690. The stop loss for the trade will be above the high of the previous session i.e. at 1.63747.

AUDUSD rebounds within falling wedge supported by +divergence AUDUSD has rebounded from the falling wedge pattern in which it has been moving from past one year. The bounce was supported by the positive divergence between the price and RSI indicated by blue lines. The upwards thrust can bring the prices to 0.68676. The stop loss for the entire trade will be at 0.66582.

Short GBPUSD to test 1.21151 level of the broadening channelGBPUSD is a good sell right now as there are a number of patterns that point towards the southward trajectory of the pair. The pair initially went above the broadening channel, but later on reverted back with a head and shoulder pattern (blue shaded area) which make bears on the winning side, with the target of testing the lower trend line of the channel at 1.21151. In other words, follow the red arrow. Meanwhile, the pair is taking support from the 1.22859, which might become the neckline for the second head and shoulder pattern (highlighted by green area). The second shoulder of the pattern has not formed yet, which can make the prices turn to 1.24043 resistance level. In other words, the pair can follow the path highlighted by blue arrows. 10 to 20 pips above this resistance can be the stop loss for this entire trade. Furthermore, on the weekly chart, the pair has formed an evening star pattern that again supports the bearish argument.

Reversion from upper trendline, back to test the lower tendline.The pair has been moving in a channel pattern from the past two months. It has recently tested the upper trendline and has reverted back with the aim of testing the lower trendline. The expected target for the trade is at 1.81645. The Range of 1.84053 – 1.85157 is a strong resistance area for the pair. The stop loss for the trade will be at 1.85157.

GBPINR rising wedge breakdown confirmed, selling to followThe pair was moving in a steep rising wedge pattern from the past 1.5 months. GBPINR, in the previous session, gave a daily close below the lower trend line of the wedge pattern, confirming a breakdown. In doing so, the pair also breached crucial support of 21 days EMA (88.1609). Now, it is susceptible to heavy selling that can take the price to 86.5692. The stop loss for the trade will be slightly above yesterday’s high at 88.9253.
