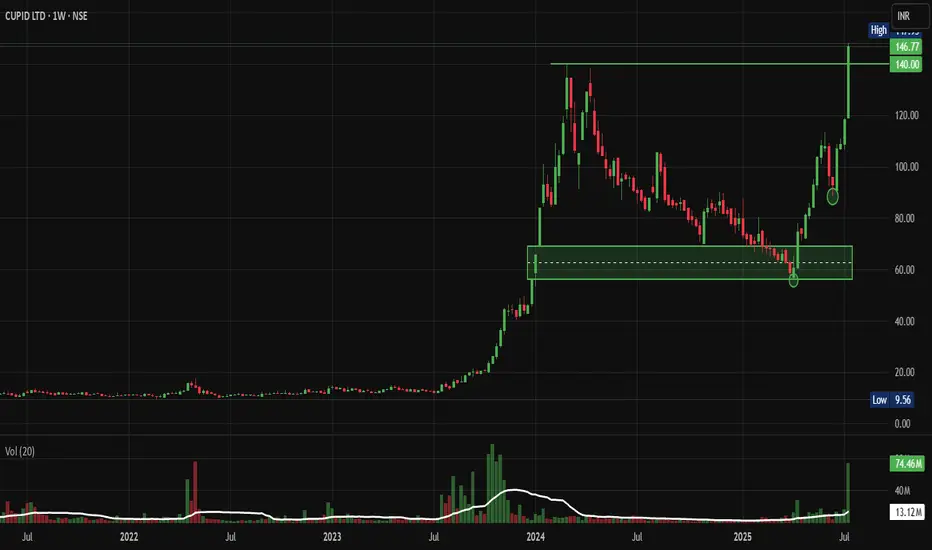
Cupid: Past Multibagger Forming Rounding Bottom BreakoutFrom ₹10 to ₹150: How CUPID Stock Became a Multibagger Dream and What's Next. Let's analyse and Deep Dive into my Chart of the Week Idea.
Price Action Analysis:
Long-term Trend Analysis:
- Primary Trend: Strongly bullish multi-year uptrend since 2023
- Trend Structure: Classic accumulation-markup-distribution pattern visible
- Price Progression: Massive rally from ₹10 levels in 2023 to ₹145+ levels
- Current Phase: Potential early stage of renewed markup phase after consolidation
Volume Spread Analysis:
Volume Profile Assessment:
- Accumulation Phases: High volume during the 2023-2024 markup phase
- Distribution Evidence: Volume spike during 2024 highs suggesting profit-taking
- Current Volume: Recent volume expansion (74.46M) confirming breakout momentum
- Volume Trend: Healthy volume participation during the current breakout phase
Volume-Price Relationship:
- Positive Correlation: Rising prices accompanied by expanding volume
- Breakout Validation: Current breakout supported by above-average volume
- Distribution Concerns: Previous high volume at peaks indicated selling pressure
Key Price Levels:
Support Levels:
- Immediate Support: ₹95-100 (recent consolidation base)
- Critical Support: ₹80-85 (previous resistance turned support)
- Major Support: ₹65-70 (rectangle pattern lower boundary)
- Ultimate Support: ₹50-55 (long-term trend line support)
Resistance Levels:
- Key Resistance: ₹145-150 (previous highs)
- Major Resistance: ₹150-155
- Target Extension: ₹170-180 (measured move projection)
Technical Indicators Assessment:
Trend Indicators:
- Moving Averages: Price clearly above major moving averages, indicatinga bullish bias
- Trend Strength: Strong upward trajectory since the consolidation base
- Momentum: Building positive momentum after prolonged consolidation
Trade Setup & Strategy:
Primary Long Setup:
- Entry Strategy: Buy on dips to ₹115-120 support zone
- Confirmation: Entry above ₹145 for momentum traders
Alternative Strategies:
Conservative Approach:
- Entry: Wait for pullback to ₹100-105 levels
- Timeframe: Medium to long-term holding period (Weekly Charts)
- Risk Profile: Lower risk, moderate reward
Aggressive Approach:
- Entry: Immediate entry at current levels (₹145)
- Timeframe: Short to medium-term momentum play (Daily Charts)
- Risk Profile: Higher risk, higher reward potential
Entry and Exit Levels:
Entry Zones:
- Zone 1: ₹115-120 (Primary entry for dip buyers)
- Zone 2: ₹145-150 (Momentum breakout entry)
- Zone 3: ₹100-105 (Deep pullback opportunity)
Target Levels:
- Target 1: ₹150-155 (Short-term objective)
- Target 2: ₹160-165 (Medium-term target based on pattern)
- Target 3: ₹180-190 (Long-term extension target)
- Ultimate Target: ₹200+ (Bull market extension)
Exit Strategy:
- Profit Booking: Book 30% at Target 1, 40% at Target 2, and the remaining at Target 3
- Trailing Stop: Implement trailing stop-loss above ₹140
- Time Stop: Review position if targets are not achieved in 8-12 months
Stop-Loss Strategy:
Stop-Loss Levels:
- Aggressive Stop: ₹110 (for entries around ₹120)
- Moderate Stop: ₹100 (for swing traders)
- Conservative Stop: ₹85 (for long-term investors)
Stop-Loss Management:
- Initial Risk: Limit to 8-10% of the entry price
- Trailing Mechanism: Move stop-loss to breakeven after 15% gains
- Pattern Stop: Below ₹95 invalidates the breakout setup
- Time-based Stop: Exit if below ₹110 for more than 2 weeks
Position Sizing & Risk Management:
Position Sizing Guidelines:
- Conservative Investors: 2-3% of portfolio
- Moderate Risk Takers: 4-5% of portfolio
- Aggressive Traders: 6-8% of portfolio (maximum)
- Sectoral Exposure: Limit total pharma/healthcare exposure to 15-20%
Risk Management Framework:
- Maximum Loss: Limit loss to 2% of total portfolio per trade
- Diversification: Don't concentrate more than 10% in a single stock
- Sector Allocation: Balance with other defensive sectors
- Time Diversification: Stagger entries over 2-3 weeks
Portfolio Integration:
- Correlation Check: Monitor correlation with other pharma stocks
- Sector Rotation: Consider the pharma sector cycle and rotation
- Market Cap Allocation: Balance small-cap exposure with large-caps
- Liquidity Consideration: Account for small-cap liquidity constraints
Risk Assessment:
Technical Risks:
- Failed Breakout: Risk of false breakout below ₹115
- Distribution Pattern: High volume at peaks may indicate selling
- Overbought Conditions: Rapid rise may lead to consolidation
- Support Breakdown: Break below ₹95 would be technically negative
Fundamental Risks:
- Valuation Concerns: High PE ratio of 96+ indicates premium valuation
- Sales Decline: The Recent 7% sales decline raises growth concerns
- Sector Competition: Increasing competition in the contraceptive market
- Regulatory Changes: Healthcare sector regulatory modifications
Market Risks:
- Small-Cap Volatility: Higher volatility compared to large-caps
- Liquidity Risk: Potential liquidity issues during market stress
- Sentiment Risk: Healthcare sector sentiment shifts
- Global Economic: Impact of global economic conditions on exports
Company Overview & Fundamental Backdrop:
Business Profile:
- NSE:CUPID is India's premier manufacturer of male and female condoms, personal lubricant, and IVD kits, established in 1993
- The company manufactures and exports contraceptives, including male and female condoms, and medical devices, with a focus on sexual health and reproductive safety, serving both domestic and international markets, supplying high-quality products to governments and NGOs
- Market capitalization: ₹3,940 crores as of July 2025, classified as a Small Cap company
Financial Performance:
- Current valuation metrics: PE ratio of 96.3 and PB ratio of 11.5
- Recent performance: Sales declined by 7.24% to Rs 61 crore in Q4 FY25 versus Rs 66 crore in Q4 FY24; however, net profit rose 2.71% to Rs 41 crore for FY25
- Long-term returns: The stock has delivered 133% returns in the last 3 years
Sectoral Growth Outlook:
- The Indian contraceptive devices market is expected to grow at a CAGR of 6.2-6.3% from 2025 to 2030
- Market size estimated at USD 264.01 million in 2025, expected to reach USD 377.61 million by 2030, at a CAGR of 7.42%
- India's pharmaceutical sector aims to grow from the current US$50 billion to US$450 billion by 2047, with India being the 3rd largest producer of drugs globally
Monitoring Parameters:
What to Look Closely at Technically?
- Weekly Close: Monitor weekly closes above ₹115 for trend continuation
- Volume Trends: Watch for volume expansion on up-moves
- Relative Strength: Compare performance with the Nifty Healthcare Index
What to Look Closely at Fundamentally?
- Quarterly Results: Track revenue growth and margin expansion
- Order Book: Monitor new contract wins and export orders
- Sector Trends: Keep track of contraceptive market growth
- Management Commentary: Follow management guidance and outlook
Now, when to exit?
- Technical Breakdown: Close below ₹95 for two consecutive days
- Volume Reversal: High volume selling at resistance levels
- Fundamental Deterioration: Significant decline in business metrics
- Sector Weakness: Broad-based healthcare sector underperformance
So, My Take:
NSE:CUPID presents a compelling technical setup with a confirmed breakout from a year-long consolidation pattern. The stock has transformed from a ₹10 stock to a multibagger, and current technical indicators suggest potential for further upside. However, premium valuation and recent sales decline warrant careful risk management. The trade offers an attractive risk-reward profile for investors willing to accept small-cap volatility in exchange for participation in a growing healthcare subsector.
Keep in the Watchlist and DOYR.
NO RECO. For Buy/Sell.
📌Thank you for exploring my idea! I hope you found it valuable.
🙏FOLLOW for more
👍BOOST if you found it useful.
✍️COMMENT below with your views.
Meanwhile, check out my other stock ideas on the right side until this trade is activated. I would love your feedback.
Disclaimer: "I am not a SEBI REGISTERED RESEARCH ANALYST AND INVESTMENT ADVISER."
This analysis is intended solely for informational and educational purposes and should not be interpreted as financial advice. It is advisable to consult a qualified financial advisor or conduct thorough research before making investment decisions.
Search in ideas for "INDICATORS"
Laxmi Organic Industries Ltd. 1 Day View1-Day Technical Overview & Key Levels
Daily Technical Indicators (Investing.com – Aug 28, 2025)
Overall sentiment: Neutral on the daily timeframe
Indicators:
RSI(14): ~32.74 — signals Sell (approaching oversold)
MACD: –2.49 — Sell
Stochastic: ~35.07 — Sell
Many indicators lean bearish, though the summary remains neutral
Moving Averages (Investing.com – Aug 28, 2025)
Mixed signals:
Sell from MA5, MA10, MA20, MA50.
Buy from MA100, MA200.
Overall: 4 buy vs 8 sell signals from various MAs
Pivot Points & Intraday Levels (Investing.com – Aug 28, 2025)
Classic Pivot:
Support: S1 = ₹207.57, S2 = ₹207.24, S3 = ₹206.83
Pivot: ₹207.98
Resistance: R1 = ₹208.31, R2 = ₹208.72, R3 = ₹209.05
Fibonacci Pivot:
Similar zone: S1 ≈ ₹210.54, Pivot ≈ ₹207.98, R1 ≈ ₹216.99
Suggested Next Steps
Watch price action around ₹205–210 for reversal setups (bullish engulfing, RSI bounce).
A sustained break above ₹213–215 could open the way toward ₹220+.
Conversely, failure to hold ₹205–208 might trigger deeper correction toward ₹200 or below.
Consider combining daily with intraday (hourly/15-minute) to capture momentum early.

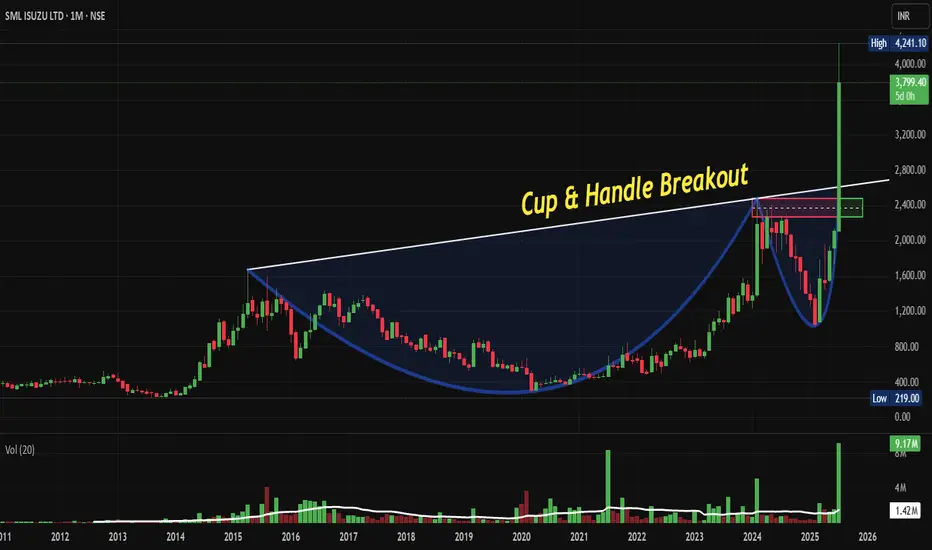
SMLISUZU: Explosive Cup and Handle Breakout, Chart of the Month From Years of Consolidation to Explosive Breakout: Why NSE:SMLISUZU Cup & Handle Pattern Could Deliver Multi-Bagger Returns. Let's Deep Dive into "Chart of the Month"
Price Action Analysis:
- Current trading price is approximately ₹3,799.40
- The stock has demonstrated a textbook Cup & Handle formation spanning over a decade (2015-2025)
- Post-breakout momentum shows strong bullish continuation with healthy volume expansion
- Recent breakout above the ₹2,400 breakout level indicates institutional accumulation
Volume Spread Analysis:
- Volume spike during the 2024-2025 breakout phase confirms genuine institutional interest
- Average daily volume has increased significantly from historical levels
- Volume pattern shows healthy distribution during consolidation phases and accumulation during breakouts
- Recent volume bars indicate sustained buying interest at higher levels
Key Technical Levels:
Base Formation:
- Primary base formed between 2020-2023 at ₹400-800 levels
- Secondary base consolidation occurred in 2023-2024 around ₹1,200-1,600 range
- The decade-long cup formation created a strong foundation for the current uptrend
Support Levels:
- Immediate support: ₹3,200-3,400 (recent consolidation zone)
- Strong support: ₹2,400-2,600 (cup breakout level)
- Critical support: ₹1,800-2,000 (previous resistance turned support)
- Long-term support: ₹1,200-1,400 (base formation)
Resistance Levels:
- Immediate resistance: ₹4,200-4,400 (psychological round number)
- Next resistance: ₹4,800-5,000 (projected target based on cup depth)
- Long-term target: ₹6,000+ (measured move from cup formation)
Technical Pattern:
Cup & Handle Pattern
- Formation period: 2015-2025 (10-year formation)
- Cup depth: Approximately ₹1,800 (from ₹2,400 high to ₹600 low)
- Handle formation: 2024-2025 consolidation
- Breakout confirmation: Volume expansion above ₹2,400
Moving Average Alignment:
- Price trading above all major moving averages
- Strong uptrend with moving averages in bullish sequence
- No signs of trend reversal in the immediate term
Trade Setup:
Entry Levels:
- Aggressive entry: ₹3,600-3,700 (current market price on minor dips)
- Conservative entry: ₹3,200-3,400 (on pullback to support)
- Accumulation zone: ₹2,800-3,200 (for long-term positions)
Exit Levels:
- Target 1: ₹4,500-4,700 (25-30% upside)
- Target 2: ₹5,500-5,800 (50-60% upside)
- Target 3: ₹6,500+ (multi-bagger potential)
Stop-Loss Strategy:
- For aggressive entries: ₹3,100 (8-10% risk)
- For conservative entries: ₹2,800 (12-15% risk)
- Trailing stop: Use a 20% trailing stop once the position moves 30% in favour
Position Sizing & Risk Management:
Position Sizing Guidelines
- Conservative investors: 2-3% of portfolio
- Moderate risk investors: 3-5% of portfolio
- Aggressive investors: 5-8% of portfolio (maximum recommended)
Risk Management Framework
- Never risk more than 2% of the total portfolio on a single trade
- Use position sizing formula: (Portfolio Risk ÷ Trade Risk) × 100
- Implement pyramid buying on pullbacks to support levels
- Book partial profits at each target level (33% at each target)
Portfolio Allocation Strategy:
- Core holding: 60% of position for long-term (2-3 years)
- Trading position: 40% for swing trades and profit booking
- Rebalance quarterly based on technical developments
Sectoral & Fundamental Backdrop:
Commercial Vehicle Sector Overview:
- The Commercial Vehicles market in India is projected to grow by 2.13% (2025-2030), resulting in a market volume of 1,165.00k vehicles in 2030
- India's commercial vehicle industry is gearing up for a modest recovery, with ICRA forecasting a 3-5 per cent year-on-year growth in wholesale volumes for FY26
- The India Commercial Vehicles Market size is estimated at 51.09 billion USD in 2025, and is expected to reach 62.95 billion USD by 2029, growing at a CAGR of 5.36%
Industry Dynamics:
- Infrastructure development is driving demand for commercial vehicles
- The government's focus on road construction and the logistics sector
- The e-commerce boom is increasing last-mile delivery vehicle demand
- Replacement demand cycle supporting steady growth
Company Fundamentals:
- Net profit of SML ISUZU rose 44.34% to Rs 67 crore in the quarter ended June 2025 as against Rs 46 crore during the previous quarter ended June 2024. Sales rose 13.39% to Rs 846 crore in the quarter ended June 2025
- Market Cap: 5,498 Crore (up 84.8% in 1 year), Revenue: 2,498 Cr, Profit: 142 Cr, Promoter Holding: 43.96%
Business Model Strengths:
- NSE:SMLISUZU Limited manufactures and sells commercial vehicles and related parts in India and internationally. Its products include trucks and buses
- Strong partnership with Isuzu Motors for technology and product development
- Focus on fuel-efficient and reliable commercial vehicles
- Growing aftermarket services contributing to recurring revenue
Financial Health Indicators:
- Consistent revenue growth over recent quarters
- Improving profit margins, indicating operational efficiency
- Stable promoter holding, suggesting management confidence
- Strong balance sheet supporting growth investments
Risk Assessment:
Technical Risks:
- Failure to hold ₹3,200 support could trigger correction to ₹2,800
- High volatility expected due to recent sharp price appreciation
- Potential profit booking pressure at psychological levels
Fundamental Risks:
- Cyclical nature of the commercial vehicle industry
- Dependency on economic growth and infrastructure spending
- Competition from established players like Tata Motors
- Raw material cost fluctuations impacting margins
Market Risks:
- Overall market correction could impact individual stock performance
- Interest rate changes affecting vehicle financing demand
- Regulatory changes in emission norms requiring investment
My Take:
NSE:SMLISUZU presents a compelling technical setup with the successful breakout from a decade-long Cup & Handle pattern. The combination of strong fundamentals, improving sector dynamics, and bullish technical indicators suggests potential for significant upside. However, investors should implement proper risk management given the stock's recent appreciation and inherent sector volatility.
The stock appears well-positioned to benefit from India's infrastructure growth story and the recovery of the commercial vehicle sector. Technical indicators support a bullish outlook with multiple price targets achievable over the next 12-18 months.
Keep in the Watchlist and DOYR.
NO RECO. For Buy/Sell.
📌Thank you for exploring my idea! I hope you found it valuable.
🙏FOLLOW for more
👍BOOST if you found it useful.
✍️COMMENT below with your views.
Meanwhile, check out my other stock ideas on the right side until this trade is activated. I would love your feedback.
Disclaimer: "I am not a SEBI REGISTERED RESEARCH ANALYST AND INVESTMENT ADVISER."
This analysis is intended solely for informational and educational purposes and should not be interpreted as financial advice. It is advisable to consult a qualified financial advisor or conduct thorough research before making investment decisions.
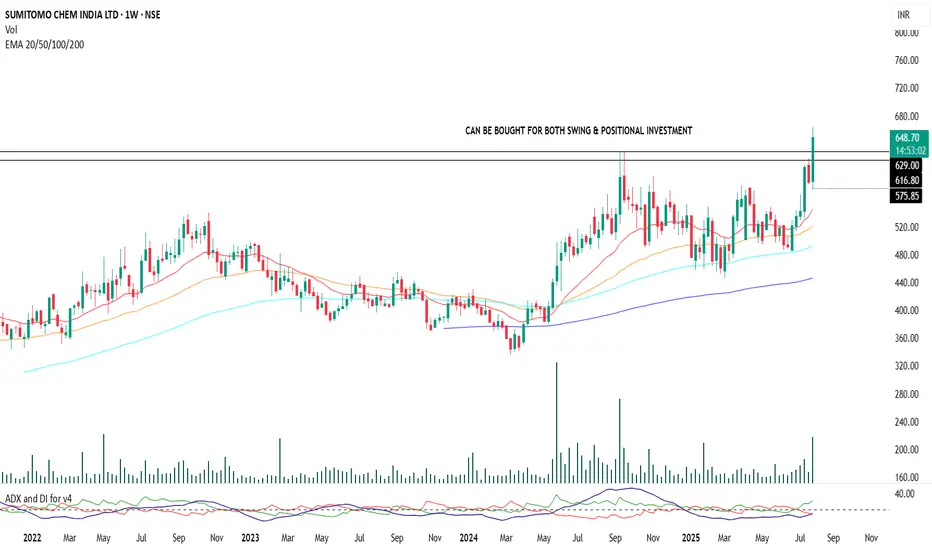
Sumitomo Chemical | Positional Swing Setup with Dynamic SLA strong setup is forming in Sumitomo Chemical with bullish c price action and trend indicators. Entry can be been initiated at current levels with small quantity with a stop-loss placed at ₹570 on a weekly closing basis.
No fixed targets. This is a trailing stop-loss-based position aimed at capturing a sustained trend move.
Add-on Zone: If the price retests the support near the ₹630 level (previous structure/support), more quantity will be added as part of a pyramiding strategy, provided broader market structure remains bullish.
Indicators Used for Trailing SL & Confirmation:
ADX & DI , RSI Levels
Exit Criteria:
Weekly close below ₹570 (hard stop)
Note: This is a disciplined, structure-based swing trade with optional pyramiding. Avoid impulsive exits; trail stop-losses logically based on trend indicators.
Bullish Reversal from Demand Zone Toward Supply Resistance –Instrument: Unspecified, but denominated in USD
Timeframe: Appears to be 1H or 4H, based on the date range and price action
Chart Type: Candlestick with algorithmic signal overlays (Long/Short signals)
Indicators Used:
Leading Indicator
Range Filter
Confirmation Indicators
Rational Quadratic Model
🧠 Key Zones Identified:
SUPPLY Zone: ~3,402.850 to ~3,420.000
→ This is a key resistance area where sellers previously stepped in strongly.
DEMAND Zone: ~3,312.182 to ~3,338.415
→ Marked POI (Point of Interest), suggests potential buyer interest around this range.
🔁 Recent Market Behavior:
The price dropped from the Supply Zone, showing a bearish reaction.
Currently, it is testing the Demand Zone, forming a potential double-bottom or reversal pattern.
Previous US Brinks POI adds further confluence to the current demand zone as a possible reversal area.
📈 Trade Setup (Marked on Chart):
Bullish Bias: The white arrow shows a long trade setup from the demand zone toward the supply zone.
Entry Zone: Between 3,312 – 3,338 USD
Target Zones:
First target at 3,348.969 (minor resistance)
Final target at 3,402.850 (supply zone)
Stop Loss Area: Below 3,312.182 to invalidate the demand zone thesis.
📊 Indicator Confluence:
Long Bias Active (as per table)
Range Filter: Enabled for "Short", but not active for "Long" – possible rangebound market
Confirmation Indicators: Not fully confirming long yet
Rational Quadratic Kernel (RQK): Disabled or not giving clean confirmation (risk of false move)
📌 Professional Notes:
📉 Risk: If price breaks below the demand zone (~3,312), bearish continuation is likely.
🔄 Flip Zone: If price reclaims 3,348–3,364 area with volume and structure, the bullish idea strengthens.
🧠 Ideal Long Entry: Wait for bullish engulfing, break of structure (BOS), or strong candle reversal near demand zone.
🕰️ Fundamental Check: Keep an eye on macro events or USD-related news that could affect momentum near POIs.
✅ Summary:
> Bias: Bullish
Entry Zone: 3,312 – 3,338
Target Zone: 3,348 → 3,364 → 3,402
Invalidation: Break below 3,312
Confluence: POI + Demand + Multiple Touch Points + Previous Brinks Zone

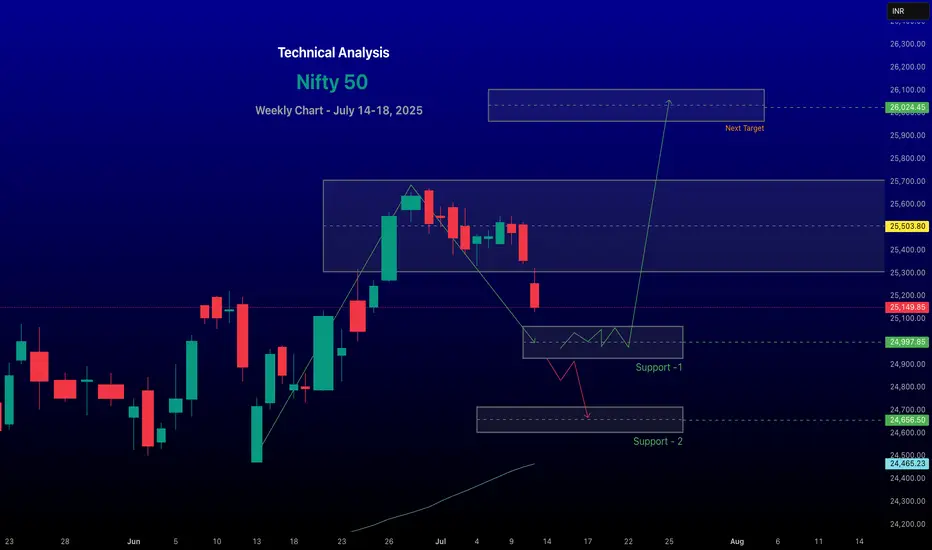
Nifty 50 about to hit SupportPredicting the Nifty 50's movement for the week of July 14–18, 2025,
Involves analyzing recent market trends, technical indicators, and macroeconomic factors based on available data. Here’s a concise analysis:Market ContextRecent Performance: The Nifty 50 closed at 25,149.85 on July 11, 2025, down 0.78% from the previous day, reflecting a bearish session driven by losses in IT, auto, and oil & gas stocks. The index has been volatile, with a weekly decline of 0.59% but a monthly gain of 0.63%.
# Global Cues:
Mixed global market trends are influencing sentiment. U.S. markets are at record highs, but Wall Street futures are down, and Asian markets are mixed (e.g., Nikkei 225 up, Hang Seng down). The looming U.S. tariff deadline and potential U.S.–India trade agreement talks are key events to watch.
#FII/DII Activity:
Foreign Institutional Investors (FIIs) have been selling, which may weigh on short-term sentiment, while Domestic Institutional Investors (DIIs) could provide support.
~~ Technical Analysis ~~
Trend: The Nifty 50 is in a broader uptrend but showing signs of a short-term correction. It closed below the key level of 25,400, indicating potential weakness. Technical indicators suggest a sideways to bearish bias for the near term.
#Support and Resistance:
Support: Key support lies at 24,900–25,133. A break below 24,900 could lead to further declines toward 24,700 or 24,500.
Resistance: Immediate resistance is at 25,500–25,650. A sustained move above 25,650 could signal bullish momentum toward 25,770–26,000.
# Indicators:
Moving Averages: The index is above its 20-day, 50-day, and 200-day EMAs, supporting a bullish long-term trend, but recent selling pressure at higher levels indicates consolidation.
# Sectoral Outlook
Bullish Sectors: Banking, pharma, realty, oil & gas, and media showed resilience last week, with stocks like HDFC Bank, Bajaj Finance, and Coal India gaining.
Bearish Sectors: IT, metals, telecom, and auto underperformed. IT stocks like TCS, HCL Tech, and Infosys dragged the index due to weak Q1 results (e.g., TCS reported a 6% profit increase but faced margin pressure).
Key Events to WatchU.S.–India Trade Talks: Clarity on a potential interim trade agreement could boost sentiment, especially for export-oriented sectors.
FOMC Minutes: The release of FOMC minutes may influence global rate expectations, impacting FII flows.
Forecast for July 14–18, 2025Expected Range: The Nifty 50 is likely to trade between 25,000–25,750. A break below 24,900 could test 24,500, while a move above 25,650 may target 26,000.
~~ Disclaimer --
This analysis is based on recent technical data and market sentiment from web sources. It is for informational purposes only and not financial advice. Trading involves high risks, and past performance does not guarantee future results. Always conduct your own research or consult a SEBI-registered advisor before trading.
#Boost and comment will be highly appreciated

renderwithme | Nifty 50's movement for the week of July 14–18, Predicting the Nifty 50's movement for the week of July 14–18, 2025,
Involves analyzing recent market trends, technical indicators, and macroeconomic factors based on available data. Here’s a concise analysis:Market ContextRecent Performance: The Nifty 50 closed at 25,149.85 on July 11, 2025, down 0.78% from the previous day, reflecting a bearish session driven by losses in IT, auto, and oil & gas stocks. The index has been volatile, with a weekly decline of 0.59% but a monthly gain of 0.63%.
# Global Cues:
Mixed global market trends are influencing sentiment. U.S. markets are at record highs, but Wall Street futures are down, and Asian markets are mixed (e.g., Nikkei 225 up, Hang Seng down). The looming U.S. tariff deadline and potential U.S.–India trade agreement talks are key events to watch.
#FII/DII Activity:
Foreign Institutional Investors (FIIs) have been selling, which may weigh on short-term sentiment, while Domestic Institutional Investors (DIIs) could provide support.
~~ Technical Analysis ~~
Trend: The Nifty 50 is in a broader uptrend but showing signs of a short-term correction. It closed below the key level of 25,400, indicating potential weakness. Technical indicators suggest a sideways to bearish bias for the near term.
#Support and Resistance:
Support: Key support lies at 24,900–25,133. A break below 24,900 could lead to further declines toward 24,700 or 24,500.
Resistance: Immediate resistance is at 25,500–25,650. A sustained move above 25,650 could signal bullish momentum toward 25,770–26,000.
# Indicators:
Moving Averages: The index is above its 20-day, 50-day, and 200-day EMAs, supporting a bullish long-term trend, but recent selling pressure at higher levels indicates consolidation.
# Sectoral Outlook
Bullish Sectors: Banking, pharma, realty, oil & gas, and media showed resilience last week, with stocks like HDFC Bank, Bajaj Finance, and Coal India gaining.
Bearish Sectors: IT, metals, telecom, and auto underperformed. IT stocks like TCS, HCL Tech, and Infosys dragged the index due to weak Q1 results (e.g., TCS reported a 6% profit increase but faced margin pressure).
Key Events to WatchU.S.–India Trade Talks: Clarity on a potential interim trade agreement could boost sentiment, especially for export-oriented sectors.
FOMC Minutes: The release of FOMC minutes may influence global rate expectations, impacting FII flows.
Forecast for July 14–18, 2025Expected Range: The Nifty 50 is likely to trade between 25,000–25,750. A break below 24,900 could test 24,500, while a move above 25,650 may target 26,000.
~~ Disclaimer --
This analysis is based on recent technical data and market sentiment from web sources. It is for informational purposes only and not financial advice. Trading involves high risks, and past performance does not guarantee future results. Always conduct your own research or consult a SEBI-registered advisor before trading.
#Boost and comment will be highly appreciated
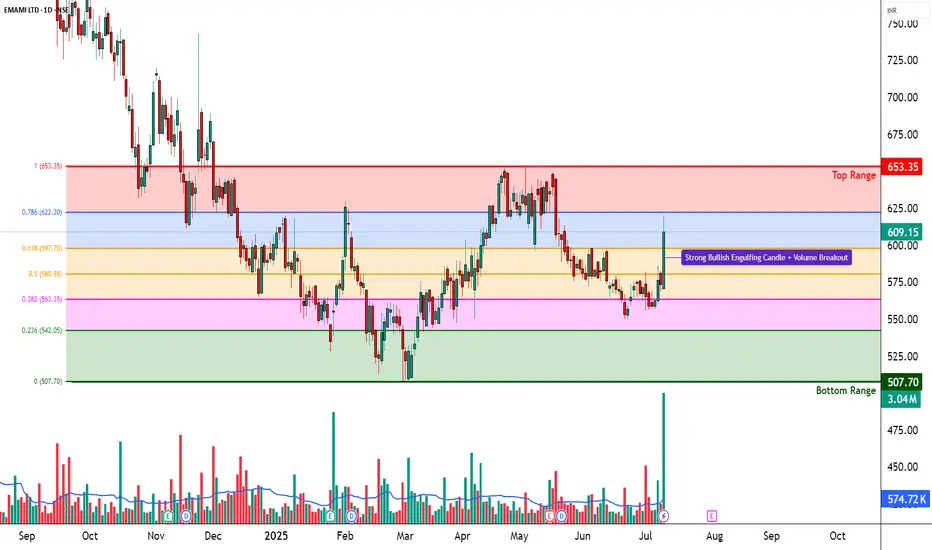
EMAMI LTD – Strong Bullish Breakout | Volume Spike________________________________________________________________________________
📈 EMAMI LTD – Strong Bullish Breakout | Volume Spike | Structure-Based Trade Idea
🕒 Chart Type: Daily Chart
📆 Date: July 9, 2025
________________________________________________________________________________
📌 Price Action:
EMAMI LTD has delivered a decisive breakout from its recent compression phase after trading sideways between 570–585 for several sessions. On July 9, the stock posted a wide-range bullish candle, closing at 609.15, backed by high delivery and breakout volume. The candle formed with an open = low structure, a strong intraday move, and solid closing near the high, confirming buyer dominance. This marks a shift in control from range-bound consolidation to potential momentum continuation.
________________________________________________________________________________
📊 Chart Pattern:
This breakout is from a Box Compression Zone, where the stock had been moving within a tight band. This is a textbook bullish compression breakout, often seen before short-term trend expansions. The range contraction, followed by a sudden expansion with volume, signals that smart money may be entering. Though not a VCP, the narrowing of ranges followed by a strong candle reflects controlled buildup and release of bullish pressure.
________________________________________________________________________________
🕯️ Candlestick Pattern:
Bullish Engulfing
Open = Low Candle
Momentum Continuation Candle
The current candle also fits the "Buy Today, Sell Tomorrow" setup logic, especially useful for short-term intraday/momentum traders from an educational lens.
________________________________________________________________________________
🔊 Volume Analysis:
Volume on July 9 crossed 3x the 20-day average, showing an institutional-grade breakout. What's more important is that this move comes after multiple low-volume sessions, which indicates that the base was silent before this burst — classic sign of accumulation followed by breakout. The presence of a BB squeeze and volume compression breakout confirms the start of a volatility expansion phase.
________________________________________________________________________________
📈 Technical Indicators:
RSI (Daily): 65 – strong and rising
MACD: Bullish crossover on Daily, but flat on Weekly/Monthly
CCI: 319 – strong bullish momentum reading
Stochastic: 85 – in a bullish zone, showing follow-through possibility
SuperTrend & VWAP: Bullish bias confirmed
BB Squeeze: Compression off, likely start of expansion
These indicators align well to show a breakout backed by momentum and volume expansion.
________________________________________________________________________________
🧱 Support & Resistance:
🔺 Resistance Zones to Watch:
629.23 – First key level where supply may come in
649.32 – Major resistance from previous swing
678.63 – Long-term resistance zone
Top Range: 653.35 – Official top of the recent consolidation base
🔻 Support Levels:
579.83 – Immediate support post-breakout
550.52 – Minor swing base
530.43 – Deeper demand level from which recent trend started
Bottom Range (Demand Zone): 507.70 – Long-term structural support
________________________________________________________________________________
👀 What’s Catching Our Eye:
What stands out in this chart is the confluence of breakout signals — RSI breakout, engulfing candle, Bollinger squeeze off, and high delivery volume — all firing together. The open-low bullish bar is not just random price movement; it's a statement from buyers that they're ready to defend this zone.
________________________________________________________________________________
🔍 What We’re Watching For:
We’re watching if EMAMI can sustain above 609–620 for the next couple of sessions. A consolidation above this zone will indicate strength. On the flip side, any rejection and close back below 579.83 will raise flags. We're also watching for any mild retest toward 580–585 on low volume, which can offer a secondary low-risk entry opportunity.
________________________________________________________________________________
✅ Best Buy Level for Equity (Low Risk Idea):
Breakout Entry: Above 620 with follow-through or retest confirmation
Pullback Buy: Into the 579.83–585 support zone with a strong bounce candle
Stop Loss: 560.33 (structure-based, on closing basis)
Risk-Reward Lens: Start with a 1:1 target; trail for 1:2+ based on structure — avoid fixed upside projections
________________________________________________________________________________
💼 Sector Tailwinds:
The FMCG and personal care space is seeing renewed demand due to rising rural consumption, price stability in raw materials, and stronger brand-led companies gaining market share. EMAMI, with a wide product portfolio, is well-positioned to benefit. Fundamentally, the stock is also recovering from long-term price compression — aligning well with the recent breakout.
________________________________________________________________________________
⚠️ Risk to Watch:
A close below 579 will invalidate the breakout setup
Indicators are strong but slightly stretched, so chasing blindly can invite volatility
The price must confirm above 620+ for the trend to gain broader legs
Always wait for follow-through before committing fresh capital
________________________________________________________________________________
🔮 What to Expect Next:
If EMAMI sustains above 609–620, the stock could gradually move toward 629.23 and test higher levels like 649.32. But if it fails to hold above the breakout candle, we may see a pullback to 580–585. Either way, price and volume in the next 2–3 sessions will confirm whether this is a false breakout or the start of a real trend.
________________________________________________________________________________
🧠 How to Trade EMAMI LTD (For Educational Use Only):
Breakout Plan (Hypothetical Setup):
🔹 Entry: Above 620 only if follow-through confirmation candle appears
🔹 Stop Loss: 560.33 (on closing basis)
🔹 Pullback Buy: Into 580–585 with same SL, if bullish reversal shows
🔹 Risk-Reward: 1:1 minimum; trail for more
🔹 Position Sizing: Use capital allocation based on risk tolerance — never go all-in on breakout
________________________________________________________________________________
⚠️ Disclaimer (Please Read):
• This chart is shared for educational purposes only and is not investment advice.
• I am not a SEBI-registered advisor.
• The information provided here is based on personal market observation.
• No buy/sell recommendations are being made.
• Please do your own research or consult a registered financial advisor before making any trading decisions.
• Trading involves risk. Always use proper risk management.
________________________________________________________________________________
💬 Found this helpful?
What would be your ideal trade in EMAMI — breakout follow-through or support pullback?
Drop your thoughts in the comments below ⬇️
🔁 Share this with your trading community
✅ Follow STWP for clean technical setups backed by price action and volume
🚀 Let’s trade with patience, logic, and clarity!
Be Self-Reliant | Trade with Patience | Learn with Logic
________________________________________________________________________________
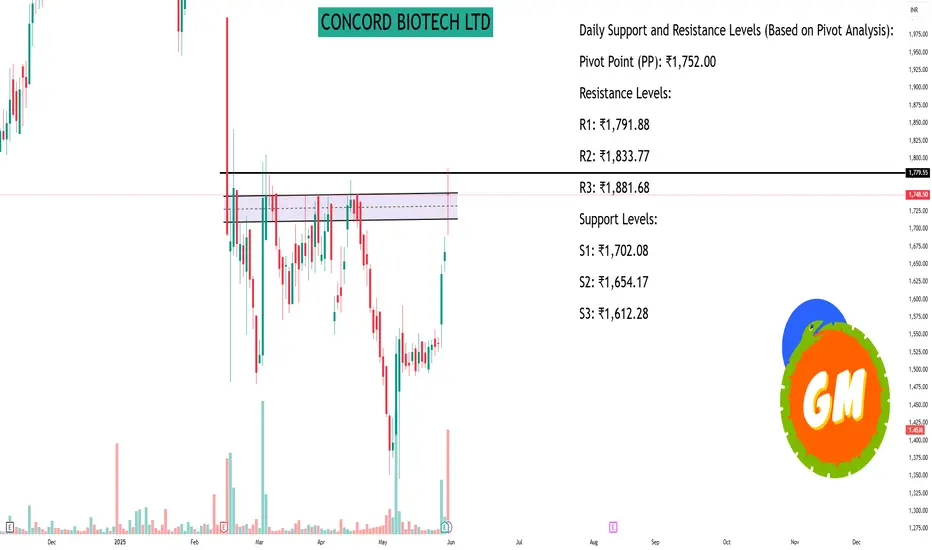
CONCORD BIOTECH LTDAs of May 30, 2025, Concord Biotech Ltd (NSE: CONCORDBIO) closed at ₹1,748.50, marking a 4.9% increase from the previous close of ₹1,666.90 .
Daily Support and Resistance Levels (Based on Pivot Analysis):
Pivot Point (PP): ₹1,743.97
Resistance Levels:
R1: ₹1,791.88
R2: ₹1,833.77
R3: ₹1,881.68
Support Levels:
S1: ₹1,702.08
S2: ₹1,654.17
S3: ₹1,612.28
These levels are derived from the previous day's trading range and can serve as reference points for intraday trading decisions .
Technical Indicators:
Relative Strength Index (RSI): Over 65, indicating bullish momentum.
MACD: The MACD line has crossed above the signal line, suggesting a potential upward trend.
Volume: An increase in trading volume supports the bullish sentiment.
These indicators suggest that the stock is experiencing positive momentum, but it's essential to monitor for any changes in trend .
Key Observations:
Short-Term Range: The stock is trading between ₹1,600 (support) and ₹1,800 (resistance). A breakout above ₹1,800 could signal further upside potential.
Recent Performance: The stock has shown a 15.14% increase over the past month, indicating strong short-term performance .
Conclusion:
Concord Biotech Ltd is exhibiting bullish technical indicators with key support at ₹1,600 and resistance at ₹1,800. Traders should watch for a breakout above ₹1,800 for potential upward movement, while also being cautious of any reversal signals.
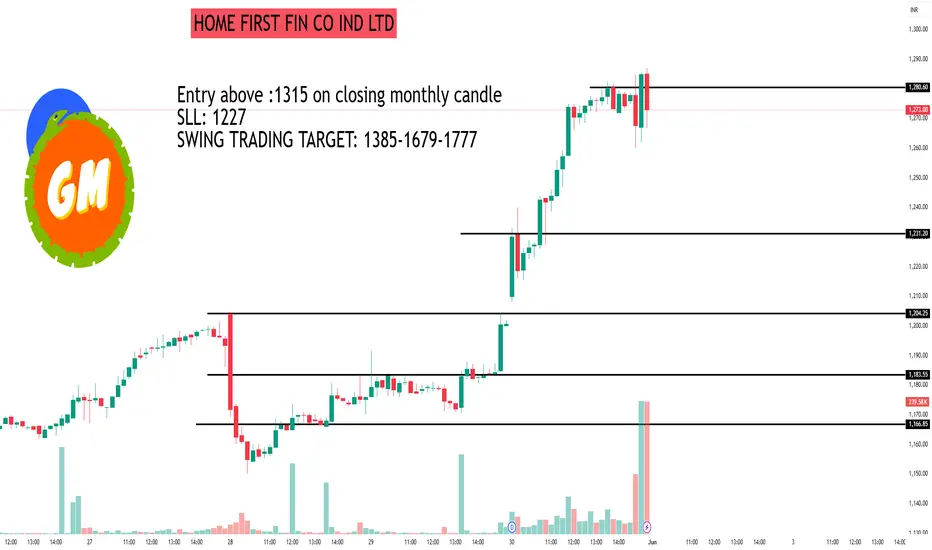
HOME FIRST FIN CO IND LTD#HOMEFIRST
This is not a buy or sell recommendation only for educational purposes and I am not a SEBI registered.
Entry above :1315 on closing monthly candle
SLL: 1227
SWING TRADING TARGET: 1385-1679-1777
Based on a comprehensive analysis of Home First Finance Company India Ltd. (NSE: HOMEFIRST), here is an in-depth evaluation encompassing its fundamental performance, institutional investment trends, and suitability for long-term investment or swing trading strategies.
Fundamental Analysis
Financial Performance
Revenue & Profitability: The company has demonstrated robust financial growth, with annual revenue increasing from *242 million in FY2016 to *11.57 billion in FY2024. The net profit margin stood at 23.9% in Q3 FY25, indicating efficient operations and profitability.
Asset Quality: As of December 31, 2024, the total asset value was ₹11,309 crore, reflecting a strong asset base. The company maintains a healthy capital adequacy ratio (CRAR) of 36.2%, showcasing financial stability.
Return Metrics: The Return on Equity (ROE) improved to 14.41% in FY2024, up from 12.56% in FY2023, indicating enhanced shareholder value creation.
Institutional Investment Trends
Promoter Holdings: There has been a notable reduction in promoter holdings, decreasing from 23.38% to 14.31% in the quarter ending December 2024. Institutional Investors: Institutional investors have significantly increased their stake, rising from 37.98% to 56.19% in the same period, indicating growing confidence among large investors.
Technical Indicators
Moving Averages: The stock is trading close to its 50-day Simple Moving Average (SMA) of *996.03 and 200-day SMA of ₹1,051.20, suggesting a neutral trend. Momentum Indicators: The Relative Strength Index (RSI) is at 54.75, indicating a neutral momentum. The Money Flow Index (MFI) at 74.85 suggests strong buying pressure.
Investment Considerations
Long-Term Investment
Home First Finance exhibits strong fundamentals, consistent growth, and increasing institutional interest, making it a viable option for long-term investment. Analysts have set a 12-month average target price of ₹1,239.81, representing an upside potential of approximately 24.86% from the current price.
Swing Trading
For swing trading, the stock's current technical indicators suggest a neutral trend. Traders should monitor key support and resistance levels and consider market volatility before initiating short-term positions.
* Conclusion
Home First Finance Company India Ltd. presents a compelling investment opportunity, backed by strong financial performance and growing institutional interest. While the stock shows potential for long-term growth, swing traders should exercise caution and rely on technical analysis for entry and exit points. If you have specific queries regarding the monthly chart or require further analysis, please provide the chart details, and I will be glad to assist you further.
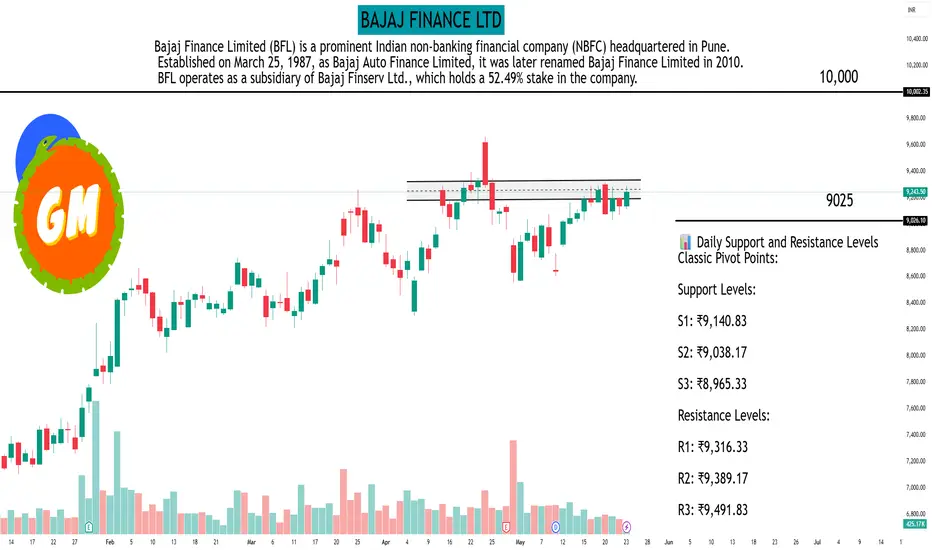
BAJAJ FINANCE LTDAs of the market close on May 23, 2025, Bajaj Finance Ltd. (NSE: BAJFINANCE) was trading at ₹9,243.50. Based on recent technical analyses, here are the key daily support and resistance levels:
📊 Daily Support and Resistance Levels
Classic Pivot Points:
Support Levels:
S1: ₹9,140.83
S2: ₹9,038.17
S3: ₹8,965.33
Resistance Levels:
R1: ₹9,316.33
R2: ₹9,389.17
R3: ₹9,491.83
Pivot Point: ₹9,213.67
Fibonacci Pivot Points:
Support Levels:
S1: ₹9,146.63
S2: ₹9,105.21
S3: ₹9,038.17
Resistance Levels:
R1: ₹9,280.71
R2: ₹9,322.13
R3: ₹9,389.17
Pivot Point: ₹9,213.67
Camarilla Pivot Points:
Support Levels:
S1: ₹9,227.41
S2: ₹9,211.33
S3: ₹9,195.24
Resistance Levels:
R1: ₹9,259.59
R2: ₹9,275.67
R3: ₹9,291.76
Pivot Point: ₹9,213.67
📈 Technical Indicators Overview
Moving Averages:
20-day EMA: ₹9,046.05
50-day EMA: ₹8,838.25
100-day EMA: ₹8,444.91
200-day EMA: ₹7,961.51
Current Price: ₹9,243.50
Interpretation: The current price is above all major moving averages, indicating a bullish trend.
Technical Summary:
Overall Rating: Strong Buy
Moving Averages: Buy
Technical Indicators: Strong Buy
🔍 Key Observations
The stock is trading above its pivot point and all major moving averages, suggesting bullish
Immediate resistance is observed around ₹9,316.33 (Classic R1), with further resistance at ₹9,389.17 (Classic R2).
Immediate support lies at ₹9,140.83 (Classic S1), with stronger support at ₹9,038.17 (Classic S2).
Please note that these levels are based on historical data and technical analysis, and actual market conditions may vary. It's advisable to use these levels in conjunction with other indicators and market news when making trading decisions.
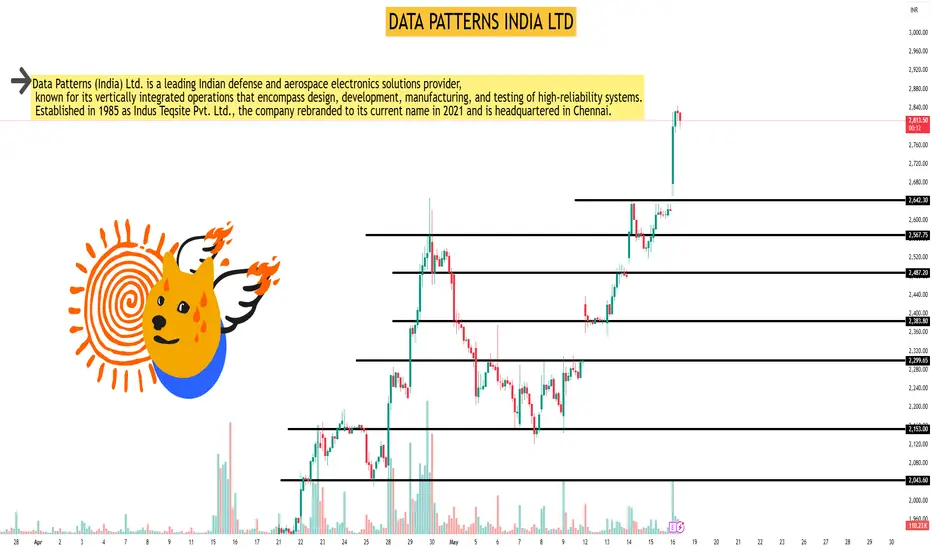
DATA PATTERNS INDIA LTDAs of May 16, 2025, Data Patterns (India) Ltd. (NSE: DATAPATTNS) exhibits a mildly bullish trend on the 45-minute timeframe, based on key technical indicators.
📊 45-Minute Technical Snapshot
Current Price: ₹2,821.20
20 SMA: ₹1,569.44
50 SMA: ₹1,546.58
Signal: Mild Bullish
Latest Price / MA Crossover: 7 ticks back
Crossover Type: Bullish
Analysis: Mild 20MA up, Mild 50 MA Uptrend, Mild Buy
📈 Additional Technical Indicators
Relative Strength Index (RSI): 72.31
Rate of Change (ROC): 56.07
Average Directional Index (ADX): 25.6
📉 Candlestick Patterns
Bullish Marubozu: Indicates strong buying pressure.
Long White Candle: Suggests bullish momentum.
📌 Summary
The 45-minute technical analysis of Data Patterns (India) Ltd. indicates a mildly bullish trend, supported by moving average crossovers and positive momentum indicators. However, the RSI suggests the stock is approaching overbought territory, warranting cautious optimism.
PERSISTENT SYSTEMS technical analysisStock Overview:
Persistent Systems Ltd. (NSE: PERSISTENT) is currently trading at INR 5,404.00. The company specializes in software product development and technology services, offering solutions in areas such as cloud computing, data analytics, and enterprise software.
Key Levels:
Support Level: INR 3,993.20
Upside Swing Zone: INR 5,157.40
Possible Upside Levels:
INR 6,347.10
INR 6,944.65
INR 7,705.80
Technical Indicators:
RSI (Relative Strength Index): The RSI is currently at 50.38, indicating neutral momentum. RSI measures the speed and change of price movements, with values above 70 typically indicating overbought conditions and values below 30 indicating oversold conditions.
Volume: The trading volume is 1.34M, providing insight into the strength of price movements. Higher volume often indicates stronger conviction behind price trends, while lower volume may suggest weaker momentum.
Sector and Market Context:
Persistent Systems Ltd. operates in the technology sector, which has shown resilience and growth potential in recent years. The overall market trends for the technology sector have been positive, driven by increasing demand for digital transformation and technological advancements. However, the sector is also subject to volatility due to rapid changes in technology and market dynamics.
Risk Considerations:
Market Conditions: The stock's movement may be influenced by broader market conditions, including economic indicators, interest rates, and geopolitical events.
Sector-Specific Risks: The technology sector is highly competitive and subject to rapid technological changes, which could impact the company's performance.
Company-Specific Risks: Persistent Systems Ltd. may face risks related to its business operations, such as project execution, client concentration, and regulatory changes.
Analysis Summary:
Persistent Systems Ltd. has maintained stability in its technical indicators, with the RSI reflecting neutral momentum and trading volume suggesting moderate participation. The stock is positioned within a favorable zone that could lead to further movement based on market conditions and sector performance. The broader technology sector remains robust but susceptible to shifts in demand and innovation cycles. Investors should remain mindful of external market influences, sector-specific risks, and company fundamentals when assessing potential opportunities.

MAXHEALTH Price actionBased on the current technical analysis of Max Healthcare Institute Ltd (MAXHEALTH), the stock is showing mixed signals with a bullish bias:
## Price and Performance
As of March 19, 2025, MAXHEALTH is trading at ₹1,080.90, up 6.29% from its previous close . The stock has shown significant volatility in recent months:
- Day range: ₹980.35 - ₹1,001.45
- 52-week range: ₹719.45 - ₹1,227.95
- All-time range: ₹97.15 - ₹1,227.95
## Technical Indicators
- **RSI (14)**: 88.367, indicating overbought conditions
- **MACD**: 23.2, suggesting bullish momentum
- **ADX (14)**: 53.972, indicating a strong trend
- **Supertrend**: 1085.84, slightly above the current price
- **Parabolic SAR**: 942.81, well below the current price, suggesting an uptrend
## Moving Averages
All major moving averages (5, 10, 20, 50, 100, and 200-day) are showing buy signals for both simple and exponential calculations . This indicates strong bullish sentiment across different time frames.
## Volume Analysis
The latest trading volume is 152K, which is lower than the 5-period average volume of 455K . This suggests a potential decrease in trading activity.
## Market Sentiment
The overall technical analysis suggests a "Strong Buy" signal:
- Moving Averages: Strong Buy (12 buy signals, 0 sell signals)
- Technical Indicators: Strong Buy (6 buy signals, 0 sell signals)
## Outlook
MAXHEALTH is currently in a strong uptrend, with all major indicators pointing towards bullish momentum. However, the RSI and other oscillators indicate overbought conditions, which may lead to a short-term pullback or consolidation.
Investors should be cautious of potential resistance around the ₹1,085-1,090 levels. The stock has shown significant growth potential, with price targets for 2025 ranging from ₹1,064.46 to ₹1,420.39 . However, as with any investment, it's crucial to consider both technical and fundamental factors before making trading decisions.

TCS trendline retest Tata Consultancy Services (TCS) is a leading global IT services and consulting company. Here's a detailed analysis of TCS's stock performance, focusing on the daily timeframe and recent trendline retests:
**Current Stock Price:**
As of February 14, 2025, TCS's share price is ₹3,934.85, reflecting a 0.63% increase from the previous day. citeturn0search0
**Recent Performance:**
- **1-Month Return:** The stock has declined by 7.04% over the past month. citeturn0search7
- **1-Year Return:** Over the last year, TCS's stock has decreased by 4.03%. citeturn0search7
**Technical Analysis:**
- **Trendline Retest:** TCS's stock has recently retested a significant trendline on the daily chart. This trendline has historically acted as a support level, and the recent retest suggests a potential for the stock to rebound if it holds above this line. Traders should monitor the stock's price action around this trendline to assess the likelihood of a sustained upward movement.
- **Support and Resistance Levels:** Key support is identified near ₹3,900, with resistance around ₹4,200. A break above ₹4,200 could signal a bullish trend, while a fall below ₹3,900 may indicate further downside.
- **Technical Indicators:** The Relative Strength Index (RSI) is currently at 45, indicating neutral momentum. The Moving Average Convergence Divergence (MACD) line is above the signal line, suggesting a potential bullish crossover. However, these indicators should be used in conjunction with price action for a comprehensive analysis.
**Analyst Insights:**
- **Price Target:** Analysts have set a price target of ₹5,620 for TCS, indicating a potential upside of approximately 42% from the current price. citeturn0search0
- **Dividend Yield:** TCS offers a dividend yield of 1.86%, reflecting a commitment to returning value to shareholders. citeturn0search7
**Conclusion:**
TCS's stock is currently testing a critical trendline support on the daily chart. Investors should monitor the stock's price action around this level to assess the potential for a rebound. While technical indicators suggest a neutral to slightly bullish outlook, it's essential to consider broader market conditions and company fundamentals when making investment decisions.
*Please note that stock market investments carry inherent risks. It's advisable to conduct thorough research or consult with a financial advisor before making investment decisions.*

Banswara Syntex Ltd.Banswara Syntex Ltd. (NSE: BANSWRAS) is currently exhibiting a **Neutral** technical outlook on the monthly timeframe.
**Technical Indicators:**
- **Relative Strength Index (RSI):** The 14-day RSI stands at 53.81, indicating a neutral market sentiment. citeturn0search5
- **Moving Averages:** The stock is trading below its 50-day simple moving average (SMA) of ₹144.23 and above its 50-day exponential moving average (EMA) of ₹139.63, suggesting a mixed trend. citeturn0search5
- **MACD (Moving Average Convergence Divergence):** The MACD value is -2.43, which is below the signal line, indicating a bearish momentum. citeturn0search5
- **Stochastic Oscillator:** The Stochastic Oscillator is at 68.59, suggesting a neutral market condition. citeturn0search5
**Support and Resistance Levels:**
- **Support:** The stock has support at ₹127.62. citeturn0search5
- **Resistance:** The resistance level is at ₹137.67. citeturn0search5
**Conclusion:**
Banswara Syntex Ltd. is currently in a neutral technical position on the monthly timeframe, with indicators suggesting neither strong bullish nor bearish momentum. Investors should monitor these indicators closely, as a breakout above resistance levels could signal a bullish trend, while a drop below support levels might indicate a bearish move. It's advisable to consider these technical factors alongside fundamental analysis and broader market conditions when making investment decisions.

EURUSD NEXT POSSIBLE MOVE SAXO:EURUSD
s of February 5, 2025, the EUR/USD pair is trading near 1.0320, reflecting ongoing market reactions to recent geopolitical developments, including the U.S. administration's imposition of additional tariffs on imports from China.citeturn0news10
**Technical Overview:**
- **Current Price:** .0320- **Resistance Levels:** .0400, 1.0500- **Support Levels:** .0300, 1.0200
**Technical Indicators:**
- **Trend:** he pair is currently in a bearish trend, with recent declines bringing it close to key support levels.- **Relative Strength Index (RSI):** he RSI is approaching oversold territory, suggesting potential for a corrective rebound.- **Moving Averages:** he price is trading below both the 50-day and 200-day moving averages, reinforcing the bearish outlook.
**Trade Recommendation:**
iven the current technical indicators and market conditions, initiating a **buy** position could be considered if the price shows signs of stabilizing above the 1.0300 support level.
- **Entry Point:** uy at 1.0330- **Take Profit (TP):** .0450- **Stop Loss (SL):** .0280
**Risk Management:**
his trade setup offers a 2.4:1 reward-to-risk ratio.nsure that your position size aligns with your risk tolerance and overall trading strategy.iven the current volatility, it's crucial to employ strict risk management practices.
**Conclusion:**
he EUR/USD pair is approaching key support levels, and technical indicators suggest a potential for a corrective rebound.raders should monitor price action closely and manage risk appropriately.
*Disclaimer: Trading forex carries a high level of risk and may not be suitable for all investors. Ensure you fully understand the risks involved and seek independent advice if necessary.*

26000 Market TOP?Title: Are We Witnessing a Medium-Term Top in Indian Markets? A Deeper Dive into Market Trends
The Indian stock markets have corrected nearly 10-12% in recent months, and the internal structure of the market suggests that this may not just be a routine pullback. Instead, it raises the possibility of 26,000 acting as a potential medium-term top. The charts of individual stocks and sectors, combined with worsening market breadth since February 2024, indicate we might be heading for a larger correction.
---
Key Observations
1. Market Breadth Deterioration
Market breadth—one of the most reliable indicators of overall market health—has significantly worsened this year. Fewer stocks are participating in upward moves, with many declining even as the broader indices attempted to hold their ground earlier.
2. Sectoral Trends: The Bounce Leaders
If a market bounce occurs, sectors like Pharma and Healthcare appear poised to lead. These traditionally defensive sectors have been showing relative strength even amid the broader weakness, suggesting a potential shift in investor preference toward safety.
3. Quality of the Bounce: A Crucial Indicator
While a short-term bounce is possible, the quality of the upmove will determine the next leg of market trends. A lackluster or narrow rally, limited to a few sectors or stocks, could signal more pain ahead. Conversely, a broad-based rally could provide a temporary respite, though it may not alter the medium-term bearish narrative.
---
Why 26,000 Could Be a Medium-Term Top
- Technical Indicators: Multiple indicators, including moving averages and RSI on key indices, suggest resistance around the 26,000 level.
- Weak Stock Charts: A significant portion of the market now trades below key support levels, further underscoring the structural weakness.
- Mixed Global Sentiments: While global interest rates are not rising, uncertainties in global markets and economic conditions continue to weigh on investor sentiment.
---
What Lies Ahead?
As per my analysis, the chances of a bigger correction are increasing. The worsening breadth since February 2024 is a red flag that should not be ignored. A bounce, if it occurs, is likely to be led by Pharma and Healthcare, but whether it’s sustainable will depend on broader participation and sentiment recovery.
Investors should remain cautious, focus on quality stocks, and closely monitor the behavior of leading sectors during any rebound. For traders, a cautious approach with strict risk management is essential in this volatile environment.
---
Key Takeaways for Market Participants
1. Stay Defensive: Favor sectors like Pharma and Healthcare, which are showing relative strength.
2. Assess Market Breadth: Keep an eye on the number of advancing vs. declining stocks for clues about market health.
3. Prepare for Volatility: Markets may experience sharp movements in either direction, demanding agility in strategy.
---
While history often repeats itself in markets, it doesn’t necessarily rhyme. Therefore, it’s essential to stay alert, analyze trends objectively, and be prepared for what could be a significant turning point in Indian equities.
Let’s keep our eyes on the charts and tread carefully in these uncertain waters.
---
What’s your take on the markets? Share your thoughts below.

Gold Trading Strategy for 29th November 2024Gold Trading Strategy
Based on your updated strategy:
Buy above 2650
Sell below 2620
Current price: 2637.600
Factors to Consider
Market Trends: Monitor recent market trends, including global economic conditions, geopolitical events, and market sentiment.
Economic Indicators: Key indicators such as inflation rates, interest rates, and the strength of major currencies (especially the US dollar) can significantly impact gold prices.
Supply and Demand: Fluctuations in gold's supply (e.g., mining output) and demand (e.g., jewelry, industrial use, and investment) influence prices.
Central Bank Reserves: Central banks buying or selling gold can affect market dynamics. More purchases typically push prices higher.
Technical Analysis: Utilize chart patterns, support and resistance levels, and technical indicators like moving averages to identify potential trading opportunities.
Example Analysis
Given the current price of 2637.600:
Buying above 2650: If the price exceeds 2650, it may suggest bullish momentum, potentially driven by factors such as economic uncertainty or increased investment demand.
Selling below 2620: A decline below 2620 might indicate bearish sentiment, possibly due to stronger economic data or rising interest rates.
Disclaimer
Trading in financial markets involves significant risk and can result in the loss of your invested capital. It is crucial to conduct thorough research and consult with a financial advisor to understand the risks and develop a sound strategy.

what you think where can be go d mart ?Where Go D Mart – Stock Analysis
In this analysis, we'll take a deep dive into the stock of D Mart (Avenue Supermarts), a prominent retail chain in India known for its strong business model and consistent growth. I'll be looking at its recent price action, key technical indicators, and future potential based on both short-term and long-term trends.
Key points to discuss:
Recent Price Action: Analyzing D Mart's performance over the past few weeks/months, identifying key support and resistance levels.
Technical Indicators: Using moving averages, RSI, and other indicators to gauge market momentum and potential breakout or breakdown points.
Fundamental Factors: Highlighting any important news, earnings, or macroeconomic factors impacting the stock.
Future Predictions: Where could D Mart stock be headed next? We'll explore possible scenarios based on both technical and fundamental analysis.

TATACHEM BULLISHTata Chemicals (TATACHEM) breaking out from a falling #trendline, especially with rising #volumes, can be seen as a bullish signal. The rising volume indicates increased participation from buyers, confirming the strength of the breakout.
Key Indicators to Watch:
1. Volume Confirmation: A breakout with increasing volume is a positive signal, as it confirms the momentum. This shows that buyers are stepping in and driving the stock price higher, which may lead to further upward movement.
2. Trendline Break: Breaking a falling trendline that has been in place for some time suggests that the downtrend is losing steam and a potential reversal or continuation of an uptrend might be in play.
3. RSI and Momentum Indicators: If technical indicators like the RSI (Relative Strength Index) or MACD (Moving Average Convergence Divergence) are supporting the breakout by moving into bullish territory, this would further validate the breakout.
4. Next Resistance Levels: Post-breakout, the stock might face resistance at higher levels, so it’s essential to watch key resistance zones to gauge its next possible move.
#stocks #investing #swingtrade

Nifty Short Selling StrategyNifty Short Selling Strategy: Targeting 780 Points with a 1:6 Risk-Reward Ratio
Introduction
As market participants analyze the Nifty index's recent performance, many are identifying potential opportunities for short selling. This article outlines a strategic approach to capitalize on the anticipated formation of a short-term top in the index, aiming for a 780-point profit with a robust 1:6 risk-reward ratio.
Market Analysis
The Nifty index has recently shown signs of consolidating at higher levels, prompting technical analysts to consider the possibility of a market correction. Several indicators suggest that the index may be reaching a short-term peak:
Overbought Conditions: Technical indicators such as the Relative Strength Index (RSI) are nearing overbought territory, suggesting that the momentum may be waning.
Resistance Levels: Historical price data indicates that the current levels are approaching key resistance points, where selling pressure typically increases.
Divergence Signals: Some stocks within the index are showing bearish divergence, indicating that they may not sustain their upward momentum, which could lead to broader market weakness.
Strategy Overview
Entry Point
The ideal entry point for this short-selling strategy is when the Nifty index demonstrates a clear reversal pattern or fails to breach resistance levels. This could be confirmed by candlestick formations, such as a bearish engulfing or shooting star pattern, alongside increasing volume on the sell side . On the latest 30 minute chart of GIFT NIFTY 25925 triggered the short sell opportunity on Nifty for upcoming trading sessions.
Stop Loss
To manage risk effectively, it is crucial to set a stop-loss order. In this strategy, a stop-loss should be placed above the identified resistance level, ensuring that potential losses are minimized. A stop-loss of approximately 130-150 points above the entry point is recommended, providing a controlled risk.
Profit Target
The profit target for this strategy is set at 780 points below the entry price. This target is based on previous support levels that have historically provided a floor for the index. Achieving this target will result in a favorable 1:6 risk-reward ratio, where the potential profit significantly outweighs the risk taken.
Risk Management
Effective risk management is essential in trading. This strategy's 1:6 risk-reward ratio means that for every point risked, there is a potential to gain six points. It’s important to remain disciplined and adhere to the stop-loss and profit target, even amidst market volatility.
Execution
Monitor Market Conditions: Keep an eye on macroeconomic factors, corporate earnings reports, and geopolitical developments that could impact market sentiment.
Use Technical Indicators: Utilize tools such as moving averages, MACD, and Fibonacci retracement levels to refine entry and exit points given opportunity included RSI Divergence , CPR , Price action , Time cycles , Direction movement index.
Stay Informed: Regularly update yourself on news that may influence the Nifty index. This includes central bank announcements, economic data releases, and significant market events.
Conclusion
This short-selling strategy for the Nifty index aims to leverage the potential formation of a short-term top while maintaining a disciplined approach to risk management. By targeting a profit of 780 points with a 1:6 risk-reward ratio, traders can position themselves effectively in a market that may be poised for a correction. As always, thorough research and a clear understanding of market dynamics are crucial for successful trading.
Disclaimer
Trading in financial markets involves risk, and it is essential to conduct your own research and consult with a financial advisor before making investment decisions.

CRUDEOIL UPDATE | JULY 3 Potential crude oil price movement in a 1-day timeframe
Shooting Star Pattern identified, a bearish reversal candlestick pattern called a "shooting star." This suggests a potential price decline if certain conditions are met.
Key Levels:
Support: 6840 - If the price falls below and sustains under 6840, it could indicate further downward movement.
Resistance: 6950 - A break above 6950 would invalidate the bearish shooting star pattern and suggest a potential price increase.
Predicted Movement:
Downside: If the price closes below 6840, you expect a further 40-50 point decline.
Important Notes:
This analysis is based on a single technical indicator (shooting star) in a 1-day timeframe. It's important to consider other technical indicators and fundamental factors that can influence price movement.
Supporting indicators: Are there other technical indicators that support the bearish signal from the shooting star?
