Understanding Price Action Heuristically.What is Price Action when it comes to understanding stocks?
There are more than 100 Indicators that are present in the market today. And they all are lagging Indicators. They were made in order to extract money from the retail traders and not help them make money.
You have to understand one thing very clearly - The only aim of stock markets to exist for centuries is to extract the profits out of small money(retail) and give it to the big money(Hedge Funds/Investment banks/Asset Mgt Co.s) .
PERIOD!
So if you enter the markets at 9 AM with 100 Rs. and get out at 3:30 PM with 100 Rs. YOU WON! Everything else is secondary in this market.
We focus too much on making profits and less on saving our capital in this market. And we often don't give ourselves credit for that.
90% of retail traders in this world lose to 10% crowd. Why is that? This is a question of Behavioral Psychology which focuses on why humans behave the way they do and a really good one.
90% of the time in this market we see what we are supposed to see and that does not have to be true in reality.
What differentiates the 10 from the 90 ??
They understand human behavior than the rest. They know that the majority is more predictable than the minority and it's always easy to trap them into thinking that they are right.
Everybody focuses on all kinds of tools and not the most obvious one which is the PRICE itself.
I have made this mistake myself in my 6 years of trading experience and never really understood the why of it. But now I have started too. Truth be told it's easy to predict when there is already a tool doing it for you.
The majority never likes to work. They always want to find some shortcut and that's why they blow up their accounts again and again and this business never goes out of money because of them.
The only job of retail traders is to provide liquidity to the institutions. Our job ends there.
If we happen to make money doing what they do we can put ourselves into the premium category of people otherwise we go back to performing our job.
Every Indicator can and will lie but one thing cannot. The current level/the price.
Institutions trade the candles not the patterns. That's for the majority. And the majority is least interested in learning price action. This is called a win-win situation. Trading in the turf where they dominate the market and always end up winning.
The good news is - You cannot learn price action through a course. You'd have to discipline yourself to understand every candle and decode its behavior on the chart by just observing the charts. Spend some time observing how people with the capital fight in the market to gain some every day. And you'd slowly start noticing patterns that you couldn't before.
This all is the whole gist of Price Action Theory!
Now coming to the chart.
Why did I say there is no such thing as support or resistance in the market?
Instead of calling it S & R start calling them Buyers Area & Sellers Area respectively and see how your psychology changes while trading. Any given point which has seen more reversals in the past becomes important for us then be it support or resistance it doesn't matter. It only means 2 things that there are 2 Institutions(or more) that are fighting at that point and whichever Institution has more money wins, hence giving us a breakout or a reversal. And our only job is to find who has more probability of winning.
Now how do we do that?
This is the basic fundamental of price action - If there are good green candles (Big Green candles with very small wick) in an uptrend and very poor red candles (Small Red candles with long wicks) the buyer is dominating because it is not giving any chance for the sellers to make an impact in the market. And vice versa.
Now, What do Big Green Candle in a downtrend or a Big Red Candle in an uptrend denote? It is simply a message to the other side that a big buyer or seller exists at that point (this also denotes that the markets are getting close to their respective direction of dominating) which is why they communicate to the other side that they are capable of moving the markets from that point.
Now try to think where do your indicators and strategies stand in front of 2 players who have years of experience exploiting the markets in the most legal manner possible - Playing with Human Psychology.
I'd write about price action with example in detail in some other chart next time.
If you learned anything from this Idea and want to reflect on it I would suggest simply observe the markets every day for few months without Indicators and see what does the chart tells you and what is the significance of wicks and no wicks candles in trending and a consolidating pattern.
Search in ideas for "INDICATORS"

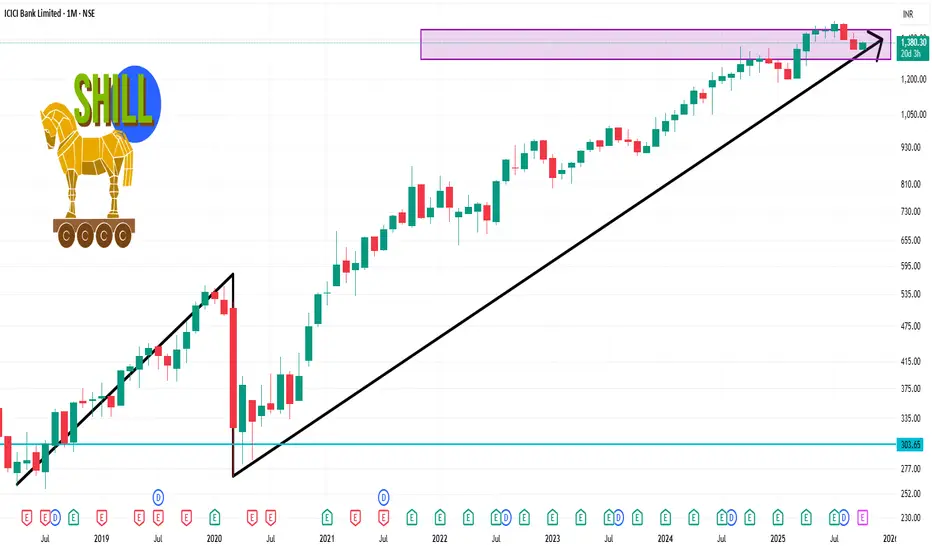
ICICIBANK 1 Month Time Frame 📊 Monthly Technical Levels
Pivot Point: ₹1,374.47
Support Levels:
S1: ₹1,316.13
S2: ₹1,284.27
S3: ₹1,225.93
Resistance Levels:
R1: ₹1,406.33
R2: ₹1,464.67
R3: ₹1,496.53
These levels are derived from standard pivot point calculations and can serve as key reference points for traders.
🔍 Technical Indicators
Relative Strength Index (RSI): Currently at 46.06, indicating a neutral condition, suggesting no immediate overbought or oversold conditions.
Moving Averages: The stock is showing a buy signal across various moving averages, with 8 buy signals and 4 sell signals, suggesting a bullish trend.
Technical Indicators: A strong buy signal is observed, with 10 buy signals and no sell signals, indicating positive momentum.
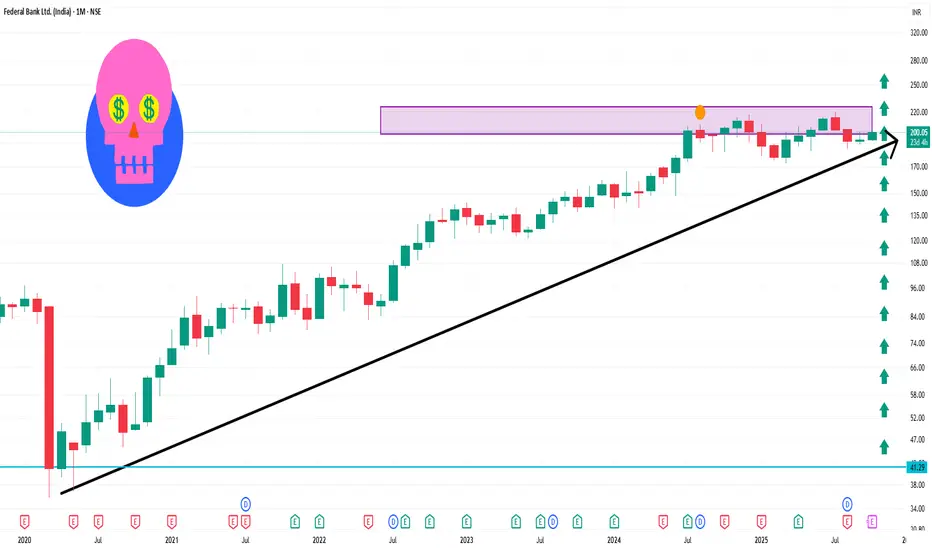
FEDERALBNK 1 Month Time Frame📊 Current Market Snapshot
Current Price: ₹199.99
Day Range: ₹199.68 – ₹202.46
52-Week Range: ₹172.66 – ₹220.00
Volume: 3,014,015 shares traded
📈 Analyst Price Forecast (1-Month Outlook)
Average Target: ₹224.37
High Estimate: ₹265.00
Low Estimate: ₹165.00
📉 Technical Indicators
Overall Sentiment: Mixed (Bearish: 9, Neutral: 3, Bullish: 3)
Moving Averages: Bearish
Oscillators: Bearish
Pivot Points: Neutral
📰 Recent Financial Performance
Q1 FY2025: Net profit declined by 15% to ₹862 crore, attributed to higher provisions, despite a 2% increase in Net Interest Income (NII)
✅ Summary
Current Price: ₹199.99
1-Month Target Range: ₹165 – ₹265
Technical Indicators: Mixed, with a bearish short-term outlook
Recent Performance: Profit decline due to increased provisions
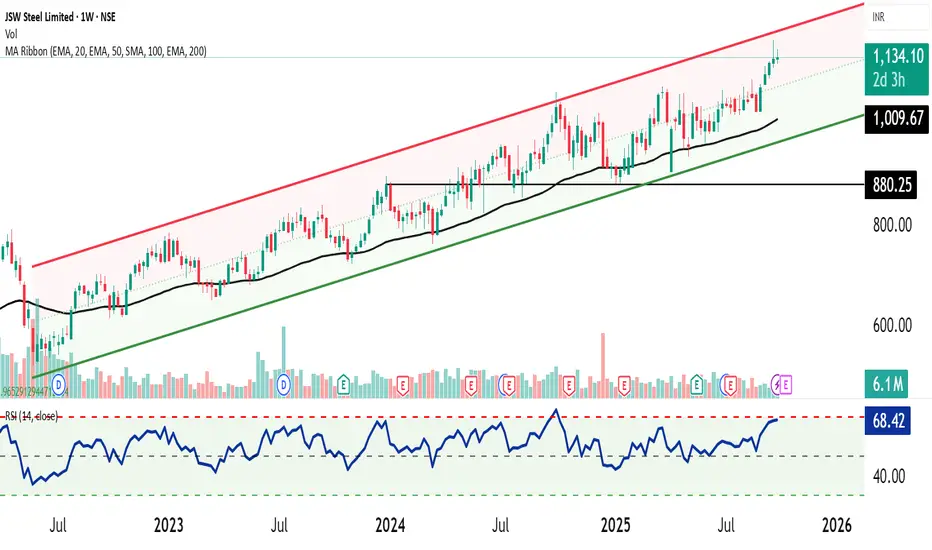
JSW Steel - Upward Parallel Chanel 📈 JSW Steel is moving in a well-defined Upward Parallel Channel on the weekly timeframe, reflecting a strong and sustained uptrend. The price action has consistently respected the channel boundaries, confirming steady buying interest.
📊 Overbought Condition:
However, the stock is currently trading near the upper band of the channel, with momentum indicators suggesting an overbought zone. This raises the possibility of a cool-off phase or a retracement toward the mean reversion (mid-channel support).
🔎 Momentum Indicators:
RSI readings indicate stretched levels, warranting caution for fresh long entries at current prices.
Volume trends remain supportive of the overall uptrend, but short-term corrections cannot be ruled out.
🎯 Projection & Outlook:
While the medium- to long-term trend stays firmly bullish, traders should watch for a possible retracement toward mid-channel support before fresh accumulation. Sustaining within the channel ensures the continuation of the uptrend, while any breakout above the channel could accelerate momentum further.
⚠️ Disclaimer:
This is a technical projection for educational purposes only and not an investment recommendation. Traders should adopt proper risk management while framing any strategy.
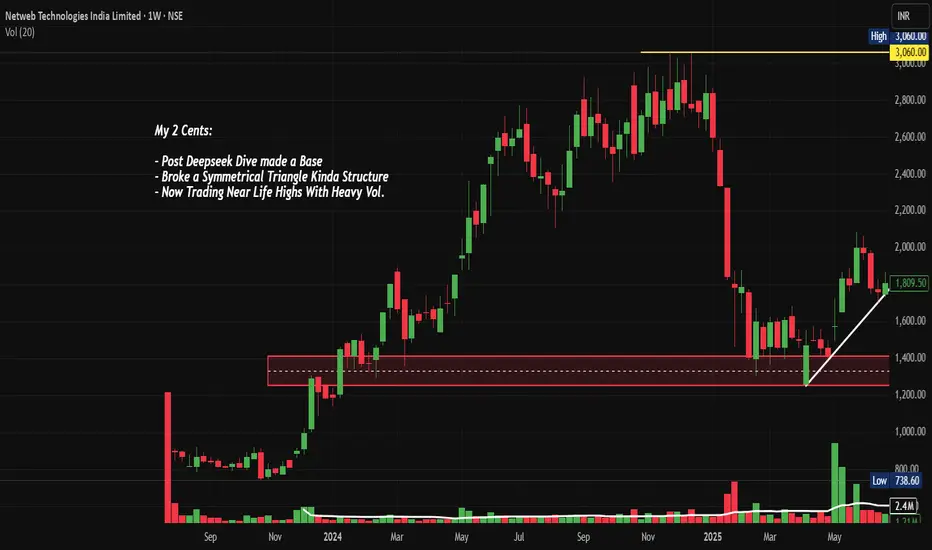
NETWEB: AI Infrastructure Goldmine ? Chart of the MonthNSE:NETWEB MarchingTowards 4,000: Is This the AI Infrastructure Goldmine You've Been Waiting For? Let's analyze in the "Chart of the Month".
As per the Latest SEBI Mandate, this isn't a Trading/Investment RECOMMENDATION nor for Educational Purposes; it is just for Informational purposes only. The chart data used is 3 Months old, as Showing Live Chart Data is not allowed according to the New SEBI Mandate.
Disclaimer: "I am not a SEBI REGISTERED RESEARCH ANALYST AND INVESTMENT ADVISER."
This analysis is intended solely for informational purposes and should not be interpreted as financial advice. It is advisable to consult a qualified financial advisor or conduct thorough research before making investment decisions.
Price Action Analysis:
- Current Price: ₹3,695.40
- 52-Week Range: ₹738.60 - ₹3,745.00
- Recent Performance: +64% gain in a Month with strong momentum
- Price structure shows consistently higher highs and higher lows pattern
- Stock has demonstrated remarkable resilience with a 380% rally from its 52-week low
Volume Spread Analysis:
- Volume surge visible during recent breakout phases
- High volume of 24.25M shares traded, indicating institutional participation
- Volume expansion coinciding with price breakouts confirms genuine buying interest
- Strong volume accumulation during consolidation phases suggests smart money positioning
Chart Patterns Identified:
- Symmetrical Triangle Breakout: Successfully broken above the triangle pattern
- Ascending Triangle: Multiple resistance tests followed by decisive breakout
- Flag and Pennant Patterns: Short-term consolidation after sharp moves
Key Technical Levels:
Support Levels:
- Immediate Support: ₹3,200 (recent consolidation zone)
- Strong Support: ₹2,800 (previous resistance turned support)
- Major Support: ₹2,400 (trendline support and psychological level)
- Critical Support: ₹2,000 (long-term ascending trendline)
Resistance Levels:
- Immediate Resistance: ₹3,745 (52-week high)
- Next Resistance: ₹4,000 (psychological round number)
- Extended Resistance: ₹4,400 (measured move projection)
- Long-term Resistance: ₹5,000
Base Formation:
- Primary Base: ₹1,200-₹1,600 range (established during deep consolidation)
- Secondary Base: ₹2,400-₹2,800 range (recent re-accumulation zone)
- The stock has clearly established a strong foundation above the ₹2,400 levels
Technical Indicators Assessment:
Momentum Indicators:
- RSI is in overbought territory but showing positive divergence
- MACD showing bullish crossover with expanding histogram
- Stochastic indicates strong upward momentum
- ADX suggesting strong trending behaviour
Moving Averages:
- Price trading well above all major moving averages
- 20 EMA, 50 EMA, and 200 EMA in perfect bullish alignment
- Strong uptrend confirmed by ascending moving averages
- No signs of trend reversal in the near term
Sectoral and Fundamental Backdrop:
AI Infrastructure Sector Outlook:
- India's IndiaAI Mission with ₹10,372 crore budget creating massive opportunities
- Government's push for sovereign AI infrastructure benefiting domestic players
- Global demand for AI computing infrastructure is experiencing exponential growth
- Limited domestic competition in the high-end computing solutions space
Company-Specific Fundamentals:
- Netweb's supercomputers have appeared 15 times across three entries in the global Top 500 supercomputers ranking
- The company is almost debt-free with a market cap of ₹20,936 crore
- Recent order wins worth ₹1,734 crore for IndiaAI Mission and ₹450 crore additional order
- Order pipeline of ₹4,142.1 crore as of June 2025, excluding new mandates
Key Growth Catalysts:
- Delivery of servers built on NVIDIA's Blackwell Architecture for India's Sovereign AI System
- Expanding presence in high-performance computing and AI systems
- Strong relationships with global technology partners
- Beneficiary of the government's Digital India and AI initiatives
Financial Performance Metrics:
- Strong revenue visibility from a large order book
- Improving profit margins due to premium product offerings
- Healthy cash flows supporting future expansion
- Zero debt structure providing financial flexibility
Strategic Outlook:
- Expect continued momentum driven by the AI infrastructure theme
- News-driven volatility possible around order execution updates
- Sector rotation into a technology infrastructure play is expected
- Quarterly results will be the key catalyst for sustained momentum
- India's AI infrastructure buildout is a multi-year opportunity
- The company is well-positioned to capture significant market share
Risk Factors to Monitor:
Technical Risks:
- Overbought conditions may lead to profit-taking
- High volatility expected given the stock's momentum
- Any break below ₹3,000 would signal trend weakness
Fundamental Risks:
- Execution risk on large government orders
- Competition from global players in AI infrastructure
- Technology disruption risks in a rapidly evolving sector
- Dependence on government spending cycles
Market Risks:
- Overall market correction could impact high-beta stocks
- Sector rotation away from technology themes
- Global supply chain disruptions affecting component availability
My 2 Cents:
NSE:NETWEB presents a compelling technical setup with strong fundamental support from India's push for AI infrastructure. The stock's breakout from multiple chart patterns, combined with substantial order wins and sector tailwinds, creates an attractive risk-reward proposition. However, position sizing and disciplined risk management remain crucial given the stock's high volatility and premium valuation.
Full Coverage on my Newsletter this Week
Keep in the Watchlist and DOYR.
NO RECO. For Buy/Sell.
📌Thank you for exploring my idea! I hope you found it valuable.
🙏FOLLOW for more
👍BOOST if you found it useful.
✍️COMMENT below with your views.
Meanwhile, check out my other stock ideas on the right side until this trade is activated. I would love your feedback.
As per the Latest SEBI Mandate, this isn't a Trading/Investment RECOMMENDATION nor for Educational Purposes; it is just for Informational purposes only. The chart data used is 3 Months old, as Showing Live Chart Data is not allowed according to the New SEBI Mandate.
Disclaimer: "I am not a SEBI REGISTERED RESEARCH ANALYST AND INVESTMENT ADVISER."
This analysis is intended solely for informational purposes and should not be interpreted as financial advice. It is advisable to consult a qualified financial advisor or conduct thorough research before making investment decisions.
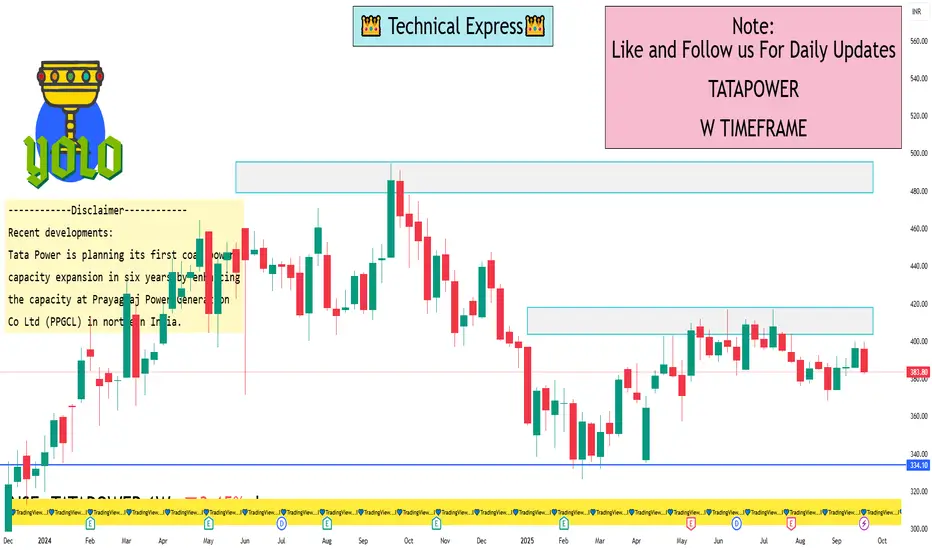
TATAPOWER 1 Week ViewKey Technical Levels for the 1-Week Timeframe:
Immediate Support: ₹383.25 to ₹383.80
Next Support Level: ₹370.00
Immediate Resistance: ₹386.39
Next Resistance Level: ₹391.47
If the stock breaks below ₹383.25, it may test ₹370.00. Conversely, a rise above ₹391.47 could indicate a potential reversal.
Technical Indicators:
Relative Strength Index (RSI): Approximately 30.5, nearing oversold territory.
Moving Average Convergence Divergence (MACD): Currently at -2.66, indicating bearish momentum.
Moving Averages: The 5-day moving average is ₹384.54, suggesting short-term bearishness.
Fundamental insights:
Intrinsic Value: Estimated at ₹211.62, suggesting the stock is currently overvalued.
Profitability: The company reported a 6% year-on-year increase in Q1 net profit to ₹1,262 crore, driven by stronger revenues from renewable energy and transmission & distribution segments.
Recent developments:
Tata Power is planning its first coal power capacity expansion in six years by enhancing the capacity at Prayagraj Power Generation Co Ltd (PPGCL) in northern India.
Outlook:
The stock is currently in a downtrend, with technical indicators favoring a bearish scenario. Investors should monitor support levels closely and consider waiting for a confirmed reversal before making any investment decisions.
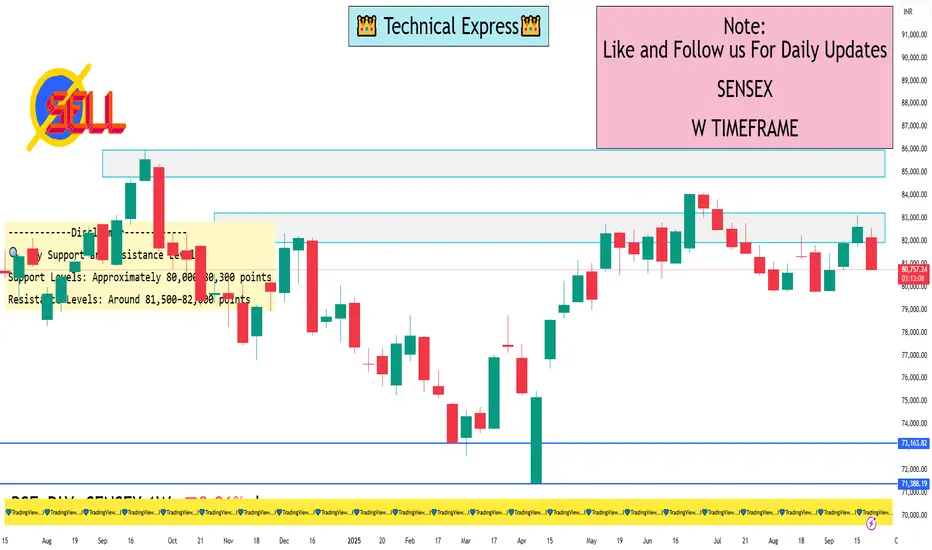
SENSEX 1 Week View📉 Weekly Technical Overview (as of Sep 26, 2025)
Current Level: Approximately 80,782.73 points
Weekly Decline: ~2,000 points, reflecting a drop of about 2.35%
Technical Indicators:
Relative Strength Index (RSI): The RSI is currently in the oversold zone, indicating potential for a short-term rebound if buying interest returns
Moving Averages: Technical analysis suggests a bearish trend, with moving averages signaling a "strong sell" outlook
Pivot Points: Key support and resistance levels are being closely monitored to gauge potential reversal points
🔍 Key Support and Resistance Levels
Support Levels: Approximately 80,000–80,300 points
Resistance Levels: Around 81,500–82,000 points
These levels are crucial for determining the market's short-term direction. A break below support may indicate further downside, while a move above resistance could signal a potential recovery.
📈 Outlook
While the short-term technical indicators suggest a bearish trend, the oversold conditions and key support levels imply that the market may be due for a corrective bounce. However, the ongoing geopolitical tensions and trade-related uncertainties could continue to exert downward pressure on the index.
Investors are advised to monitor the upcoming trading sessions closely, as a decisive move above or below the established support and resistance levels could provide clearer signals for the next phase of market movement.
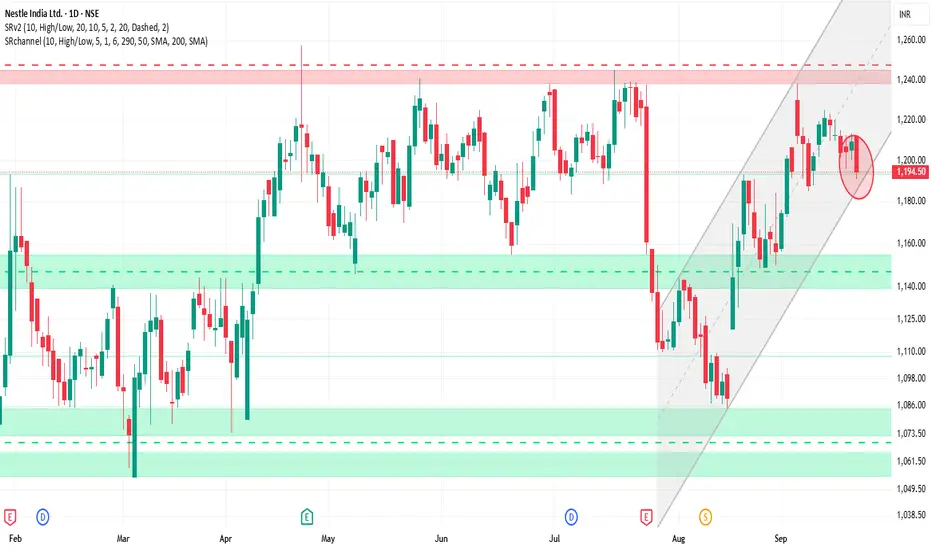
NESTLEIND 1D Time frame📊 Current Snapshot
Closing Price: ₹1,194.50
Day’s Range: ₹1,190.20 – ₹1,212.00
52-Week Range: ₹1,055.00 – ₹1,389.00
Volume: Approximately 2.4 million shares traded
Market Cap: ₹2,30,337 Crores
P/E Ratio: 78.40 (reflecting premium valuation)
Dividend Yield: 2.26%
⚙️ Technical Indicators
Relative Strength Index (RSI): 47.51 – Neutral
Moving Average Convergence Divergence (MACD): -4.12 – Bearish
Moving Averages: Mixed signals; short-term averages above the current price, while long-term averages are below, indicating potential resistance.
Pivot Points: Central pivot around ₹1,194.73, suggesting a balanced market sentiment.
🎯 Potential Scenarios
Bullish Scenario: A breakout above ₹1,197.26 with strong volume could target ₹1,202.16 and higher levels.
Bearish Scenario: Failure to hold above ₹1,187.46 may lead to a decline toward ₹1,183.83.
⚠️ Key Considerations
Market Sentiment: Nestlé India has shown strong performance recently, but broader market conditions can impact its movement.
Volume Analysis: Watch for volume spikes to confirm breakout or breakdown signals.
Technical Indicators: While the RSI indicates a neutral stance, the MACD and moving averages suggest caution.
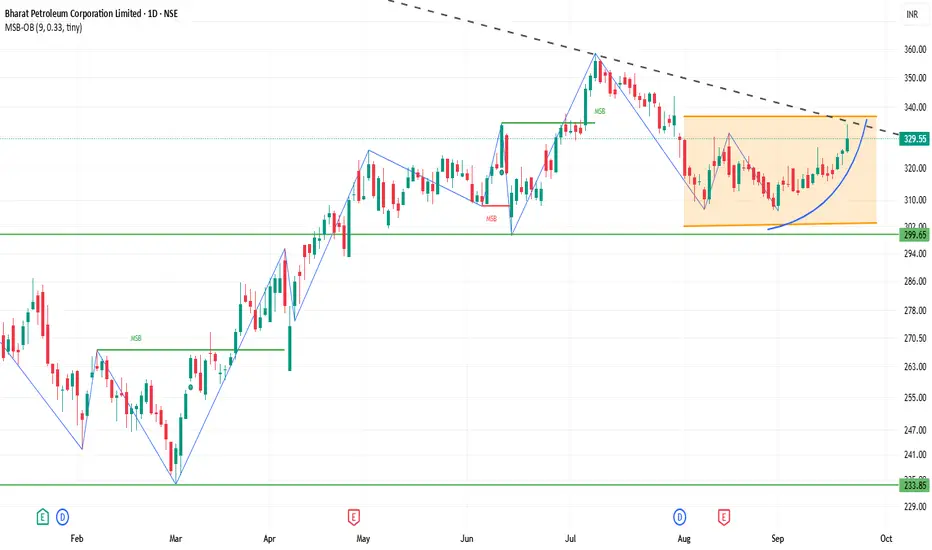
BPCL 1D Time frame📊 Current Snapshot
Closing Price: ₹329.55
Day's Range: ₹324.80 – ₹334.00
52-Week Range: ₹234.01 – ₹376.00
Market Capitalization: ₹1,42,975 Crores
Volume: Approximately 10 million shares traded
P/E Ratio: 8.14
Dividend Yield: 2.99%
⚙️ Technical Indicators
Relative Strength Index (RSI): 60.31 – Neutral to slightly bullish
Moving Average Convergence Divergence (MACD): 0.29 – Neutral
Moving Averages: Short-term averages (5, 10, 20, 50, 100, 200-day) are above the current price, indicating potential resistance.
Pivot Points: Central pivot around ₹322.30, suggesting a balanced market sentiment.
🎯 Possible Scenarios
Bullish Scenario: A breakout above ₹328.25 with strong volume could target ₹331.80 and higher levels.
Bearish Scenario: Failure to hold above ₹325.85 may lead to a decline toward ₹322.30.
⚠️ Key Considerations
Market Sentiment: BPCL has shown strong performance recently, but broader market conditions can impact its movement.
Volume Analysis: Watch for volume spikes to confirm breakout or breakdown signals.
Technical Indicators: While the RSI indicates a neutral to slightly bullish stance, the MACD and moving averages suggest caution.
KOTAKBANK 1D Time frame📊 Current Snapshot
Current Price ≈ ₹2,031
Change: ~ -1.15% on latest trading day
Price is above both 50-day and 200-day simple moving averages, which indicates the medium & longer-term trend is still upwards.
Volume is moderate.
🔍 Indicators / Momentum
RSI (14-day): Mid-range, somewhat bullish (but not overbought).
MFI (Money Flow Index): Also mid-range.
Trend Strength Indicators: Mixed. Some moving averages suggest support (price above), while other oscillators show some weakness or potential for sideways drift.
🔒 Support & Resistance Levels
Type Level (Approx)
Key Support ~ ₹2,010 – ₹2,020
Stronger Support if breaks down ~ ₹1,990 – ₹2,000
Immediate Resistance ~ ₹2,050 – ₹2,060
Higher Resistance ~ ₹2,075 – ₹2,080
⚠️ What to Watch For / Risks
The recent dip suggests sellers are exerting pressure near resistance zones.
If momentum weakens, price could fall toward the support band around ₹2,010‐₹2,020.
Any break below ₹2,000 may trigger more bearish sentiment.
🎯 Possible Scenarios
Bullish Case: If price can hold above current support and break above resistance (~ ₹2,050+), it could aim for ₹2,075-₹2,100.
Bearish Case: Rejection at resistance could pull it back toward ₹2,010 or lower. Further weakness might push it toward ~₹1,950-₹2,000 if broader market is weak.

Btc 1H long ideaHere's a detailed description of the information presented:
• Financial Instrument: The chart is for Bitcoin (BTC) priced against USDT (Tether), a stablecoin. The "Perp Perpetual Mix Contract" suggests this is a futures or derivatives contract that doesn't expire.
• Timeframe: The chart is set to 1-hour (1H), meaning each candlestick represents one hour of price movement.
• Trading Position: A long position is currently open, indicated by the green and red boxes. A long position is a bet that the price will increase.
• Entry Point: The white horizontal line marks the entry price at 116,980.2.
• Take-Profit Target: The top of the green box, labeled "Target," is at 119,810.0. The potential profit for reaching this target is 3,517.2 USDT, which is a 3.02% gain.
• Stop-Loss: The bottom of the red box, labeled "Stop," is at 114,658.0. This is the price level where the trade will automatically close to limit losses. The potential loss is 1,646.4 USDT, or a 1.42% drop.
• Risk/Reward Ratio: The text "Risk/Reward Ratio: 2.14" indicates that the potential profit is 2.14 times greater than the potential loss. This is a key metric used by traders to evaluate if a trade is worth the risk.
• Price and Indicators:
• The current price is shown as 117,210.1.
• The chart includes various indicators and tools, such as moving averages (the blue and yellow lines moving with the price) and a volume histogram at the bottom (red and green bars).
• There are also horizontal white lines that likely represent significant support and resistance levels.
In summary, the image provides a clear visualization of a planned crypto trade, outlining the specific entry, stop-loss, and take-profit levels, as well as the associated risk/reward profile.

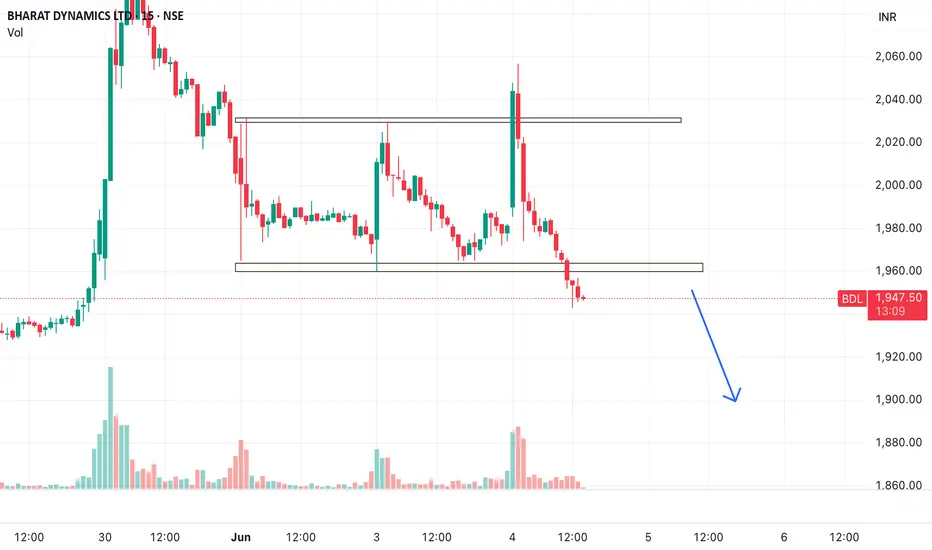
Time to Eject BDL?
Trade Setup: Short Bharat Dynamics Ltd (BDL) Below ₹1,950
Technical Analysis:
• Price Action: The stock is exhibiting signs of weakness, with potential for further downside if it breaches the ₹1,950 support level. A break below this level could trigger a short-term downtrend.
• Momentum Indicators: Technical indicators suggest bearish momentum, supporting the case for a short position below ₹1,950.
Trade Parameters:
• Entry: Sell below ₹1,950
• Targets:
• T1: ₹1,920
• T2: ₹1,880
• T3: ₹1,830
• Stop-Loss: Above ₹1,980 
Timeframe: Intraday to 2–3 trading sessions 
SENSEX 1D Time frame📊 Current Snapshot
Current Price: ₹81,571
Day’s Range: ₹81,500 – ₹81,600
Previous Close: ₹81,425.15
Opening Price: ₹81,504.36
Volume: Moderate
📈 Trend & Indicators
Trend: Neutral to mildly bullish; trading near short-term resistance.
RSI (14): Neutral zone.
MACD: Positive → indicating mild bullish momentum.
Moving Averages: Short-term averages indicate neutral to slightly bullish outlook.
🔮 Outlook
Bullish Scenario: Break above ₹81,700 with strong volume could target ₹81,900.
Bearish Scenario: Drop below ₹81,400 may lead to further decline toward ₹81,200.
Neutral Scenario: Consolidation between ₹81,400 – ₹81,700; breakout needed for directional move.
📌 Key Factors to Watch
Economic Indicators: Interest rates, inflation, and RBI policy updates.
Sector Performance: Trends in the IT and financial sectors.
Global Cues: Global market trends, US indices, crude oil, and currency movements.

BANKNIFTY 1D Time frameApologies for any confusion earlier. As of September 11, 2025, at 2:48 PM IST, the Nifty Bank (BANKNIFTY) index is trading at approximately ₹54,536.00 on the daily (1D) time frame.
The Economic Times
📊 Current Snapshot
Current Price: ₹54,681.00
Day’s Range: ₹54,402.40 – ₹54,733.90
Previous Close: ₹54,536.00
Opening Price: ₹54,413.05
Volume: Approximately 6.16 million shares
📈 Trend & Indicators
Trend: Neutral to mildly bullish; trading near short-term resistance.
RSI (14): Neutral zone.
MACD: Positive → indicating mild bullish momentum.
Moving Averages: Short-term averages indicate neutral to slightly bullish outlook.
🔮 Outlook
Bullish Scenario: Break above ₹54,800 with strong volume could target ₹55,000.
Bearish Scenario: Drop below ₹54,400 may lead to further decline toward ₹54,200.
Neutral Scenario: Consolidation between ₹54,400 – ₹54,800; breakout needed for directional move.
📌 Key Factors to Watch
Economic Indicators: Interest rates, inflation, and RBI policy updates.
Sector Performance: Trends in the banking sector.
Global Cues: Global market trends, US indices, crude oil, and currency movements.

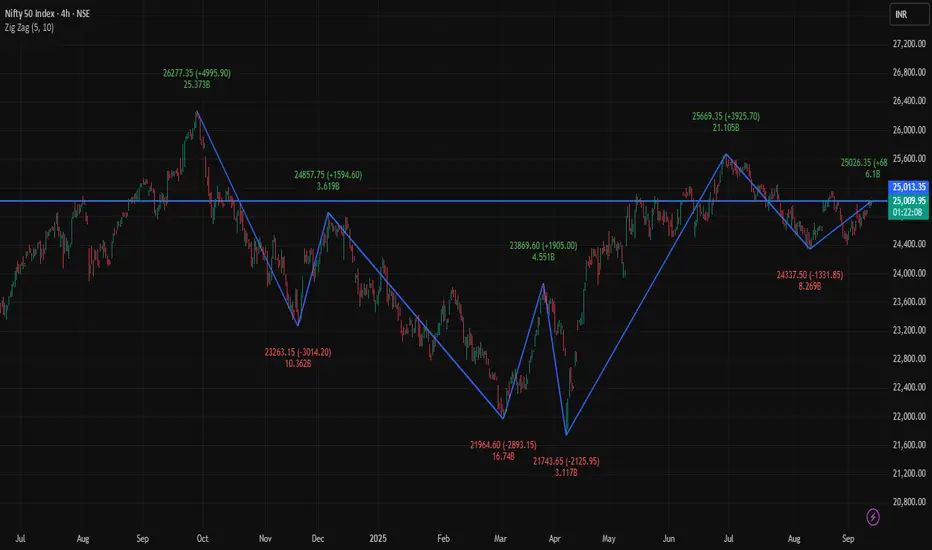
NIFTY 1D Time frame📊 Current Snapshot
Current Price: ₹25,022.20
Day’s Range: ₹24,973.00 – ₹25,035.00
Previous Close: ₹24,976.10
Opening Price: ₹24,991.00
Volume: Moderate
📈 Trend & Indicators
Trend: Neutral to mildly bullish; trading near short-term resistance.
RSI (14): Neutral zone.
MACD: Positive → indicating mild bullish momentum.
Moving Averages: Short-term averages indicate neutral to slightly bullish outlook.
🔮 Outlook
Bullish Scenario: Break above ₹25,050 with strong volume could target ₹25,100.
Bearish Scenario: Drop below ₹24,950 may lead to further decline toward ₹24,900.
Neutral Scenario: Consolidation between ₹24,950 – ₹25,050; breakout needed for directional move.
📌 Key Factors to Watch
Economic Indicators: Interest rates, inflation, and RBI policy updates.
Sector Performance: Trends in the IT and financial sectors.
Global Cues: Global market trends, US indices, crude oil, and currency movements.

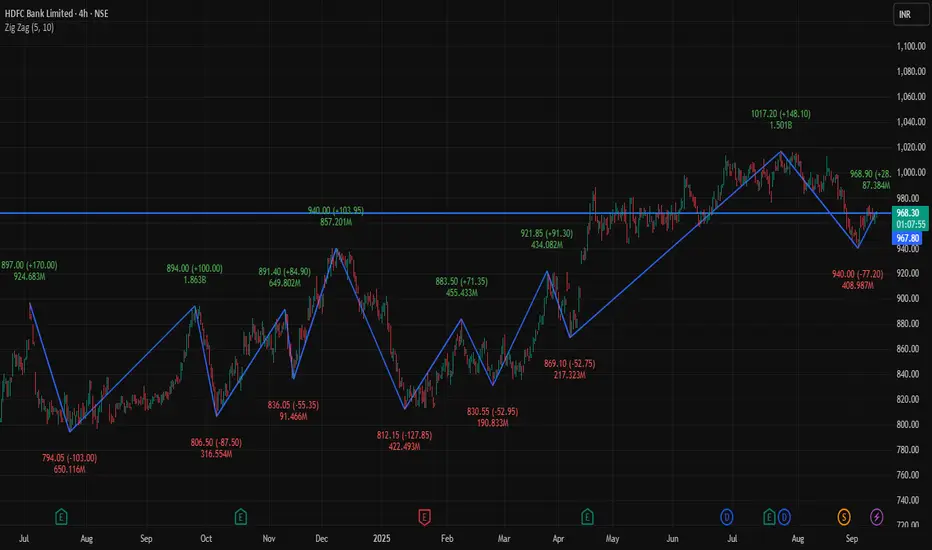
HDFCBANK 4Hour Time frame 📊 Current Snapshot
Current Price: ₹967.95
Day’s Range: ₹959.90 – ₹968.90
Previous Close: ₹965.90
Opening Price (4H): ₹960.30
Volume: Approximately 7.2 million shares
📈 Trend & Indicators
Trend: Neutral to mildly bullish; trading near short-term resistance.
RSI (14): Neutral zone.
MACD: Positive → indicating mild bullish momentum.
Moving Averages: Short-term averages indicate neutral to slightly bullish outlook.
🔮 Outlook
Bullish Scenario: Break above ₹968.90 with strong volume could target ₹975.00.
Bearish Scenario: Drop below ₹960.00 may lead to further decline toward ₹950.00.
Neutral Scenario: Consolidation between ₹960.00 – ₹968.90; breakout needed for directional move.
📌 Key Factors to Watch
Economic Indicators: Interest rates, inflation, and RBI policy updates.
Sector Performance: Trends in the banking sector.
Global Cues: Global market trends, US indices, crude oil, and currency movements.
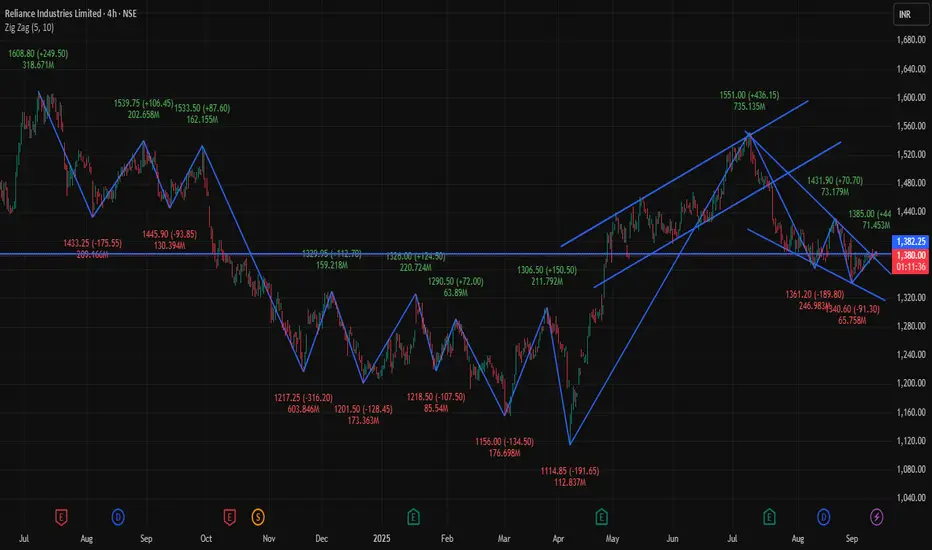
RELIANCE 4Hour 📊 Current Snapshot
Current Price: ₹1,380📈 Trend & Indicators
Trend: Neutral to mildly bullish; trading near short-term resistance.
RSI (14): Neutral zone.
MACD: Positive → indicating mild bullish momentum.
Moving Averages: Short-term averages indicate neutral to slightly bullish outlook.
🔮 Outlook
Bullish Scenario: Break above ₹1,385.50 with strong volume could target ₹1,390.00.
Bearish Scenario: Drop below ₹1,375.00 may lead to further decline toward ₹1,370.00.
Neutral Scenario: Consolidation between ₹1,375.00 – ₹1,385.50; breakout needed for directional move.
📌 Key Factors to Watch
Economic Indicators: Interest rates, inflation, and RBI policy updates.
Sector Performance: Trends in the energy and petrochemical sectors.
Global Cues: Global market trends, US indices, crude oil, and currency movements..90
Day’s Range: ₹1,375.00 – ₹1,385.50
Previous Close: ₹1,377.00
Opening Price (4H): ₹1,376.00
Volume: Approximately 371,445 shares traded
SENSEX 4Hour📊 Current Snapshot
Current Price: ₹81,561.00
Day’s Range: ₹81,235.42 – ₹81,643.88
Previous Close: ₹81,101.32
Opening Price (4H): ₹81,504.36
Volume: Approximately 6.16 million shares
📈 Trend & Indicators
Trend: Neutral to mildly bullish; trading near 50-hour and 200-hour moving averages.
RSI (14): Neutral zone.
MACD: Positive → indicating mild bullish momentum.
Moving Averages: Short-term averages indicate neutral to slightly bullish outlook.
🔮 Outlook
Bullish Scenario: Break above ₹81,643.88 with strong volume could target ₹81,917.15.
Bearish Scenario: Drop below ₹81,235.42 may lead to further decline toward ₹81,101.32.
Neutral Scenario: Consolidation between ₹81,235.42 – ₹81,643.88; breakout needed for directional move.
📌 Key Factors to Watch
Economic Indicators: Interest rates, inflation, and RBI policy updates.
Sector Performance: Trends in the IT and financial sectors.
Global Cues: Global market trends, US indices, crude oil, and currency movements.

NIFTY 4H Time frame📊 Current Snapshot
Current Price: ₹25,010.95
Day’s Range: ₹24,940.15 – ₹25,008.95
Previous Close: ₹24,977.95
Opening Price (4H): ₹24,940.15
Volume: Approximately 6.16 million shares
📈 Trend & Indicators
Trend: Neutral to mildly bullish; trading near 50-hour and 200-hour moving averages.
RSI (14): Neutral zone.
MACD: Positive → indicating mild bullish momentum.
Moving Averages: Short-term averages indicate neutral to slightly bullish outlook.
🔮 Outlook
Bullish Scenario: Break above ₹25,008.95 with strong volume could target ₹25,186.00.
Bearish Scenario: Drop below ₹24,940.00 may lead to further decline toward ₹24,871.10.
Neutral Scenario: Consolidation between ₹24,940.00 – ₹25,008.95; breakout needed for directional move.
📌 Key Factors to Watch
Economic Indicators: Interest rates, inflation, and RBI policy updates.
Sector Performance: Trends in the IT and financial sectors.
Global Cues: Global market trends, US indices, crude oil, and currency movements.
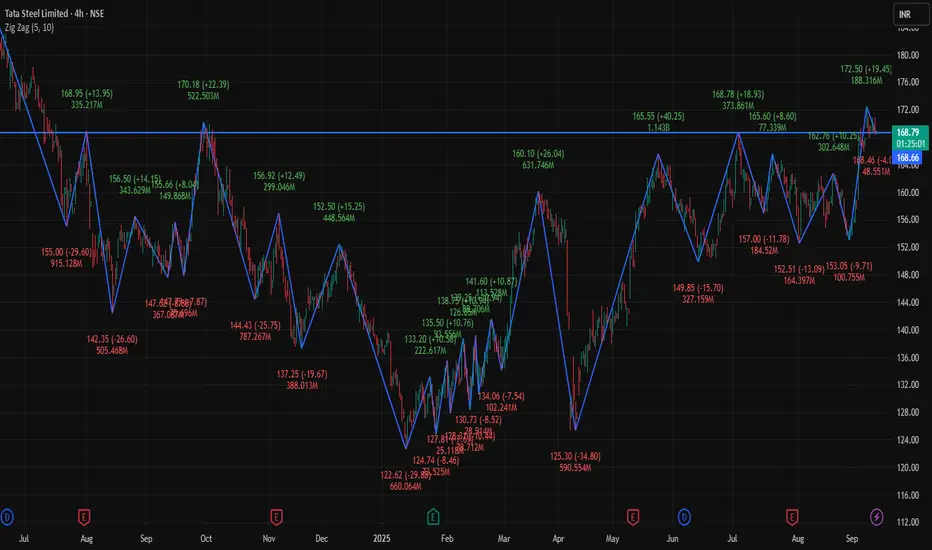
TATASTEEL 4H 📊 Current Snapshot
Current Price: ₹169.43
Day’s Range: ₹168.46 – ₹170.90
Previous Close: ₹169.43
Opening Price (4H): ₹169.35
📈 Trend & Indicators
Trend: Neutral to mildly bullish; trading near 50-hour and 200-hour moving averages.
RSI (14): Neutral zone.
MACD: Positive → indicating mild bullish momentum.
Moving Averages: Short-term averages indicate neutral to slightly bullish outlook.
🔮 Outlook
Bullish Scenario: Break above ₹170.90 with strong volume could target ₹172.50.
Bearish Scenario: Drop below ₹168.50 may lead to further decline toward ₹167.99.
Neutral Scenario: Consolidation between ₹168.50 – ₹170.90; breakout needed for directional move.
📌 Key Factors to Watch
Economic Indicators: Interest rates, inflation, and RBI policy updates.
Sector Performance: Trends in the metals and mining sectors.
Global Cues: Global market trends, US indices, crude oil, and currency movements.
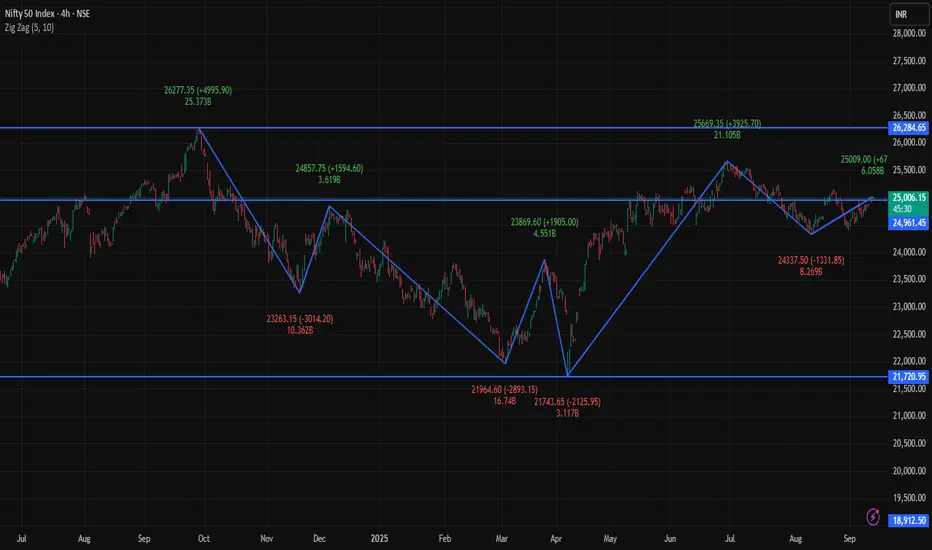
NIFTY 4H Time frame📊 Current Snapshot
Current Price: ₹24,976 - ₹25,006
Day’s Range (4H): ₹24,945 – ₹25,008
Previous Close: ₹24,973
Opening Price (4H): ₹24,991
Volume: Moderate
🔑 Key Support & Resistance Levels
Immediate Support: ₹24,945
Next Support: ₹24,900
Immediate Resistance: ₹25,008
Next Resistance: ₹25,050
📈 Trend & Indicators
Trend: Neutral to mildly bullish; trading near 50-hour and 200-hour moving averages.
RSI (14): 61 – Neutral zone.
MACD: Positive → indicating mild bullish momentum.
Moving Averages: Short-term averages suggest neutral to slightly bullish outlook.
🔮 Outlook
Bullish Scenario: Break above ₹25,008 with strong volume could target ₹25,050.
Bearish Scenario: Drop below ₹24,945 may lead to further decline toward ₹24,900.
Neutral Scenario: Consolidation between ₹24,945 – ₹25,008; breakout needed for directional move.
📌 Key Factors to Watch
Overall market sentiment.
Economic indicators: interest rates, inflation, RBI updates.
Global cues: US indices, crude oil, and currency movements.
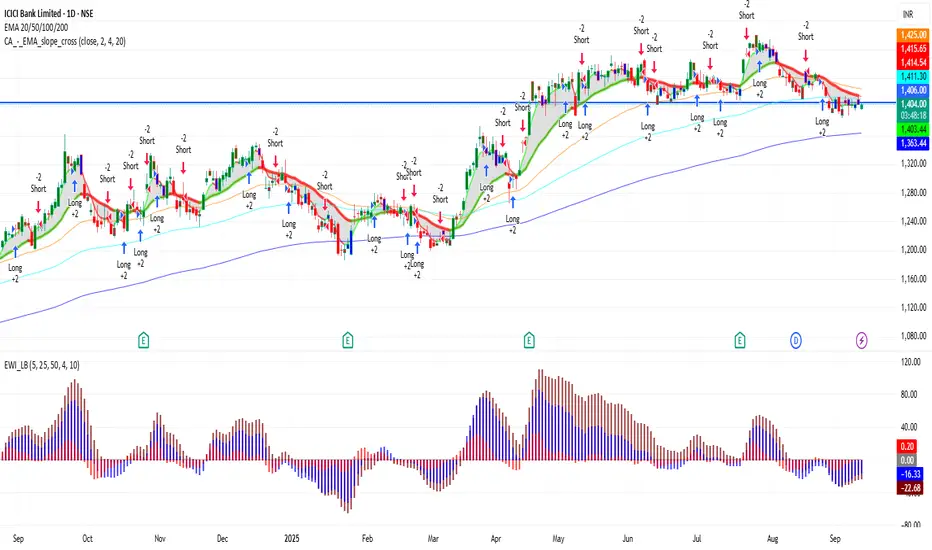
ICICIBANK 1D Time frame📊 Current Snapshot
Current Price: ₹1,406.10
Day’s Range: ₹1,402.00 – ₹1,416.35
52-Week Range: ₹1,186.00 – ₹1,500.00
Previous Close: ₹1,403.90
Opening Price: ₹1,403.70
Market Cap: ₹10.02 lakh crore
Volume: ~81.3 lakh shares
📈 Trend & Indicators
Trend: Neutral to mildly bullish; trading near 50-day and 200-day moving averages.
RSI (14): 60 – Neutral; no immediate overbought or oversold conditions.
MACD: Positive → indicates bullish momentum.
Moving Averages: Short-term moving averages suggest neutral to slightly bullish outlook.
🔮 Outlook
Bullish Scenario: Break above ₹1,416 with strong volume could target ₹1,450.
Bearish Scenario: Drop below ₹1,400 may lead to further decline toward ₹1,375.
Neutral Scenario: Consolidation between ₹1,400 – ₹1,416; breakout needed for directional move.
📌 Key Factors to Watch
Market Sentiment: Overall market trend and investor behavior.
Economic Indicators: Interest rates, inflation, and RBI policy updates.
Global Cues: Global market trends, US indices, crude oil, and currency movements.
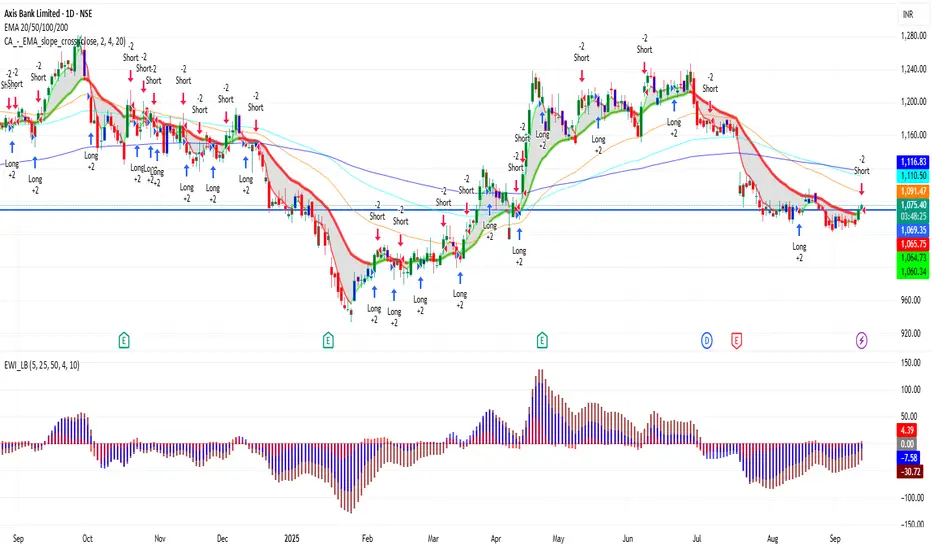
AXISBANK 1D Time frame📊 Current Snapshot
Current Price: ₹1,073.50
Day’s Range: ₹1,069.00 – ₹1,073.20
52-Week Range: ₹934.00 – ₹1,281.75
Previous Close: ₹1,070.10
Opening Price: ₹1,069.00
Market Cap: Approx. ₹3.32 lakh crore
Volume: ~1.65 lakh shares
📈 Trend & Indicators
Trend: Neutral to mildly bullish; trading near 50-day and 200-day moving averages.
RSI (14): 60 – Neutral; no immediate overbought or oversold conditions.
MACD: Positive → indicates bullish momentum.
Moving Averages: Short-term moving averages suggest neutral to slightly bullish outlook.
🔮 Outlook
Bullish Scenario: Break above ₹1,075 with strong volume could target ₹1,090.
Bearish Scenario: Drop below ₹1,065 may lead to further decline toward ₹1,050.
Neutral Scenario: Consolidation between ₹1,065 – ₹1,075; breakout needed for directional move.
📌 Key Factors to Watch
Market Sentiment: Overall market trend and investor behavior.
Economic Indicators: Interest rates, inflation, and RBI policy updates.
Global Cues: Global market trends, US indices, crude oil, and currency movements.