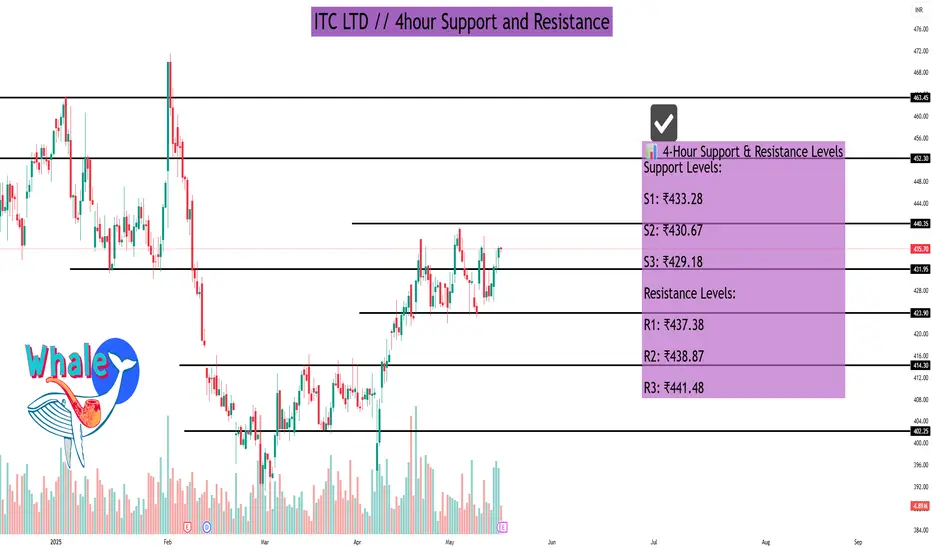
ITC LTD As of May 16, 2025, ITC Ltd. (NSE: ITC) is trading around ₹435.70. Analyzing the 4-hour timeframe, the following support and resistance levels have been identified based on various technical indicators:
📊 4-Hour Support & Resistance Levels
Support Levels:
S1: ₹433.28
S2: ₹430.67
S3: ₹429.18
Resistance Levels:
R1: ₹437.38
R2: ₹438.87
R3: ₹441.48
These levels are derived from pivot point calculations and can serve as potential areas where the price might experience support or resistance.
🔍 Technical Indicators Overview
Relative Strength Index (RSI): 58.98 – Indicates neutral momentum.
Moving Average Convergence Divergence (MACD): 3.86 – Suggests mild bullish momentum.
Average Directional Index (ADX): 17.89 – Points to a weak trend strength.
Stochastic Oscillator: 51.37 – Reflects neutral conditions.
Supertrend Indicator: ₹413.32 – Below current price, indicating a bullish signal.
Parabolic SAR: ₹437.35 – Slightly above current price, suggesting potential resistance.
📈 Fibonacci Retracement Levels
Considering the downtrend from ₹491.00 (Jan 3, 2025) to ₹390.15 (Apr 7, 2025), the key Fibonacci retracement levels are:
23.6%: ₹413.95
38.2%: ₹428.67
50%: ₹440.57
61.8%: ₹452.48
76.4%: ₹467.20
These levels can act as potential support or resistance zones as the price retraces its previous move.
🧠 Trading Insights
The current price is approaching the R1 resistance level at ₹437.38.
If the price breaks above this level with strong volume, it may test higher resistance levels.
Conversely, if it fails to break through, it might retrace to the support levels mentioned above.
Traders should monitor these levels closely and consider using stop-loss orders to manage risk.
Search in ideas for "INDICATORS"
LIC HOUSING FINANCE LTDAs of May 16, 2025, LIC Housing Finance Ltd. (NSE: LICHSGFIN) exhibits a mildly bullish trend on the 15-minute timeframe, supported by several technical indicators:
📊 15-Minute Technical Analysis Summary
Price Levels:
Current Price: ₹617.95
High-Low Moving Average (HL MA) Bands:
Upper Band: ₹622.49
Middle Band: ₹619.49
Lower Band: ₹616.49
These bands suggest the stock is trading near its middle range, indicating potential consolidation.
MACD (12,26,9):
MACD Line: -3.16
Signal Line: -3.58
Histogram: Positive, indicating a bullish crossover
The MACD has been rising over the last five periods, reinforcing the bullish sentiment.
Technical Strength:
LICHSGFIN's technical strength is rated as "Mild Bullish," outperforming approximately 44.20% of stocks in the same category.
📈 TradingView Technical Summary (15-Minute Timeframe)
On TradingView, the 15-minute technical indicators for LICHSGFIN present a Neutral outlook, suggesting a balance between bullish and bearish signals.

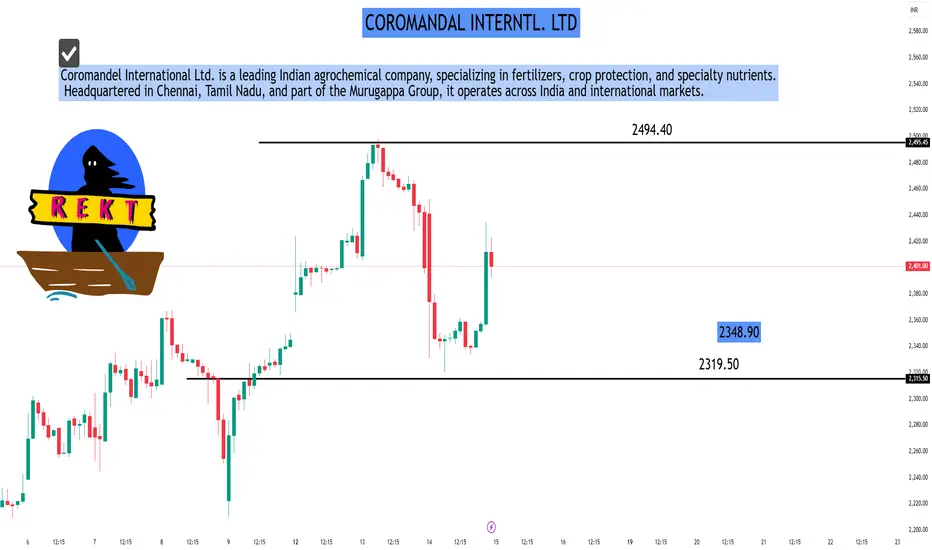
COROMANDAL INTERNTL. LTDAs of May 15, 2025, Coromandel International Ltd. (NSE: COROMANDEL) is trading at ₹2,403.30. Analyzing the 30-minute timeframe provides insights into short-term price movements and potential trading opportunities.
📊 30-Minute Technical Overview
Price Action:
Current Price: ₹2,403.30
Day's Range: ₹2,320.60 – ₹2,452.30
52-Week Range: ₹1,195.85 – ₹2,498.00
Technical Indicators:
Moving Averages: The stock is trading above its short-term moving averages, indicating a bullish trend.
Relative Strength Index (RSI): The RSI is in the neutral zone, suggesting neither overbought nor oversold conditions.
MACD: The MACD line is above the signal line, supporting a positive momentum.
Trend Analysis:
The 30-minute chart shows higher highs and higher lows, characteristic of an uptrend.
Volume analysis indicates increased buying interest during upward price movements.
🔍 Analyst Insights
Technical Rating: Based on multiple indicators, the stock has a "Strong Buy" rating in the 30-minute timeframe.
Volatility: The stock exhibits moderate volatility, suitable for intraday trading strategies.
Short Sunpharma on technical analysis till 1680Siunpharma looks week in daily chart and seems it can fall 1680 zone as per price support on that area where bulls vcan activate and bears will close their position.
📈 Technical Indicators
Moving Averages: Strong Sell
Technical Indicators: Strong Sell
RSI (14): 31.939 (Approaching oversold territory)
MACD (12,26): -13.57 (Bearish)
ADX (14): 30.04 (Indicates trend strength)
Williams %R: -97.69 (Oversold)
🔍 Demand & Resistance Zones
Demand Zone: ₹1,840–₹1,850
Sellers' Liquidity Zone: ₹1,920
Major Resistance: ₹1,960 (All-time high on Sep 30, 2024)
📌 Trade Setup
Entry: Consider long positions near ₹1,850 or upon breakout above ₹1,860
Targets:
Target 1: ₹1,920
Target 2: ₹1,960
Stop-Loss: Below ₹1,820
Risk-Reward Ratio: Minimum 1:2
🧠 Fundamental Insights
Analyst Consensus: Buy
12-Month Price Target: Average ₹2,051.84 (Upside of ~14.98%)
EPS Growth Forecast: 12.3% per annum
Revenue Growth Forecast: 9.8% per annum
Return on Equity Forecast: 16.9% over 3 years
🧬 Recent Developments
Acquisition: Acquired Checkpoint Therapeutics for $355 million in March 2025, enhancing oncology portfolio
Earnings Beat: Q3 FY25 EPS of ₹13.40 vs. estimate of ₹11.98; Revenue of ₹136.75B vs. estimate of ₹133.98B

Professional Trade Analysis: S&P 500 Index (SPX) – Swing Trade SChart Overview
Your chart shows the S&P 500 Index (SPX) on a daily timeframe with:
Recent strong bullish candles
Price reclaiming above short-term moving averages
RSI and MACD indicators showing bullish momentum
Well-marked support/resistance zones
Current Market Structure
Trend: The index is bouncing from a recent low, showing a potential trend reversal or strong corrective rally.
Support Zone: Around 5,250–5,300 (recent swing low and demand zone)
Resistance Zone: Around 5,800–5,900 (previous supply zone and near the upper edge of your marked green box)
Entry: Price is currently near 5,686, above the moving averages, confirming bullish momentum.
Suggested Swing Trade Plan
1. Bullish Bias (Long Position)
Entry: Around current price (5,650–5,700), ideally on a minor pullback to the 5,600–5,650 area for better risk/reward.
Stop Loss: Below recent swing low or the lower edge of your marked red box (around 5,425–5,450).
Target: 5,800–5,900 (upper resistance zone).
Rationale:
Strong bullish momentum, confirmation from RSI and MACD.
Price action has broken above moving averages.
Clear swing structure with defined risk and reward.
2. Bearish Bias (Short Position)
Consider only if: Price shows strong rejection at 5,800–5,900 with bearish reversal candlesticks or negative divergence on RSI/MACD.
Entry: Near 5,850–5,900 (if reversal signs appear).
Stop Loss: Above 5,950.
Target: Back to 5,600–5,650.
Key Professional Tips
Wait for Confirmation: If entering long, wait for a minor pullback or bullish reversal candle near support.
Risk Management: Risk no more than 1–2% of your capital per trade.
Monitor Indicators: Watch for RSI overbought/oversold and MACD crossovers for early exit signals.
Adjust Stops: Trail your stop-loss as price moves in your favor to lock in profits.
News Awareness: Be aware of any major economic events or earnings that could impact volatility.
Summary Table
Direction Entry Zone Stop Loss Target Zone Rationale
Long 5,650–5,700 5,425–5,450 5,800–5,900 Bullish momentum, trend reversal
Short* 5,850–5,900 5,950 5,600–5,650 Only on bearish reversal signal
*Short only if reversal is confirmed at resistance.
Final Note
Your setup is solid for a swing trade. Stick to your plan, manage risk, and let the price action guide your decisions. Happy trading! 🚀
If you want analysis on other instruments or more trade ideas, let me know!
S&P 500 Index Futures (ES)
Highly liquid and volatile, ideal for swing trading both bullish and bearish trends.
Strong, well-defined support and resistance zones.
Broad market exposure with frequent swings, making it suitable for price action strategies

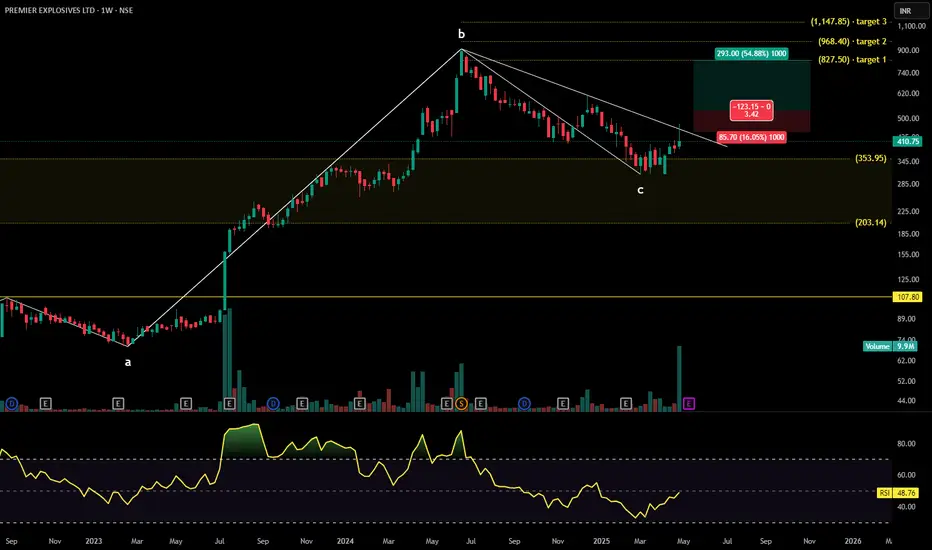
PREMIER EXPLOSIVES technical analysisPremier Explosives Ltd, NSE, current price: INR 410.75. The company specializes in the manufacturing of high-energy materials, including industrial and defense-grade explosives, and is a key supplier to India's defense and aerospace sectors.
Key Levels:
Support Level: INR 107.80
Swing Levels: INR 353.95, INR 450.65, INR 538.20
Possible Upside Levels: INR 827.50, INR 968.40, INR 1,147.85
Technical Indicators:
Relative Strength Index (RSI): Currently at 48.76, indicating neutral momentum. The RSI measures the speed and change of price movements, helping identify overbought or oversold conditions.
Volume: Trading volume is at 9.9 million, showing a significant increase in activity, which suggests growing investor interest and potential accumulation.
Sector and Market Context:
Premier Explosives Ltd operates within the defense and industrial explosives sector, which has gained traction due to heightened government spending and increasing demand from defense and infrastructure projects. The broader market has exhibited bullish tendencies, particularly among stocks linked to national security and industrial expansion. The sector's momentum is supported by geopolitical factors and policy initiatives aimed at boosting domestic defense manufacturing. However, market-wide corrections and regulatory shifts can influence its trajectory.
Risk Considerations:
Market Volatility: Broader economic cycles and market corrections can lead to price fluctuations.
Geopolitical Factors: Changes in defense policies and international trade agreements could impact demand.
Regulatory Adjustments: Compliance and policy shifts may alter operational costs or market positioning.
Competitive Pressures: Emerging players and technological advancements could affect pricing and market share.
Analysis Summary:
Premier Explosives Ltd has demonstrated strong momentum, reinforced by sectoral growth and increasing trading activity. Key technical indicators suggest neutral momentum with rising investor participation. While the stock has significant upside potential based on historical price action, investors should remain cautious due to external risk factors such as geopolitical changes and broader market volatility. Balancing these considerations, the stock presents an intriguing opportunity within the defense and industrial chemicals space, provided investors maintain a strategic and risk-aware approach.
Buy Apple Inc. (AAPL)Apple Inc. (AAPL)
Current Price: $204.60
Trend: Uptrend
Technical Indicators:
Support: $202.84
Resistance: $207.91
PE Ratio: 40.27
EPS: $6.30
Trade Setup:
Entry Point: Around $204.60
Target Price: $207.91 (short-term), $215 (extended)
Stop Loss: $202.84
Rationale: Apple continues to demonstrate strong financial performance with a solid PE ratio and EPS. The stock is in an uptrend, and technical indicators suggest potential for further gains.
Investopedia
+19

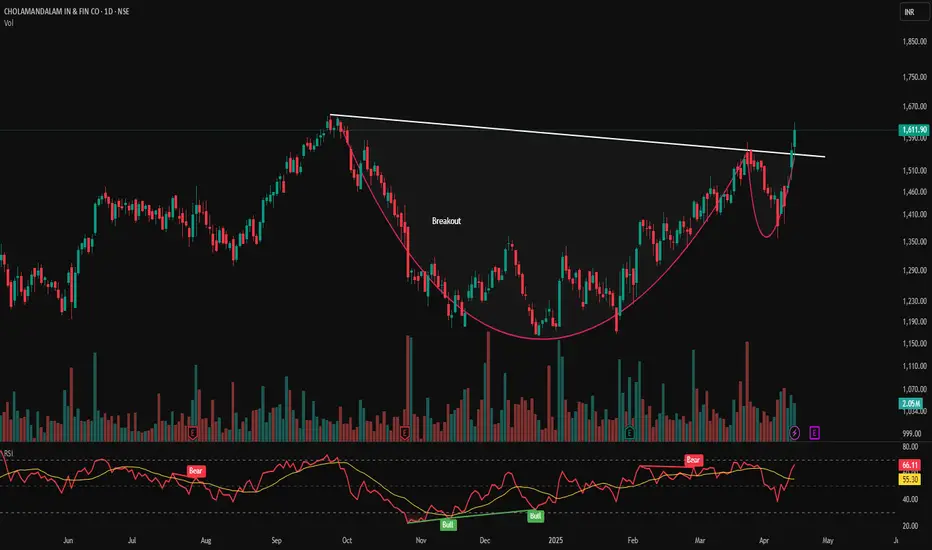
CHOLAFIN- Cup & Handle Breakout with Strong FundamentalsCHOLAFIN – Cup & Handle Breakout with Strong Fundamentals ☕📈
📅 Published on: April 17, 2025
📊 Technical Analysis:
CHOLAFIN has formed a classic Cup & Handle pattern on the daily chart, indicating a potential bullish continuation. The breakout above the neckline is accompanied by increased volume, suggesting strong buying interest.
Pattern: Cup & Handle
Neckline Breakout Level: ₹1,570
Current Price: ₹1,611.90 (+3.31%)
Volume: 2.05M—significant increase confirming breakout
Support & Resistance Levels:
Immediate Support: ₹1,570
Next Support: ₹1,500
Resistance Levels:
₹1,635
₹1,680
₹1,750
Indicators:
RSI: 66.11—approaching overbought territory, indicating strong momentum
MACD: Bullish crossover observed, supporting upward movement
🏢 Fundamental Analysis:
Cholamandalam Investment and Finance Company Ltd. is a leading NBFC in India, operating in vehicle finance, home loans, and corporate finance sectors.
Key Financial Metrics:
Market Cap: ₹1,20,302 Cr
PE Ratio: 29.60
PB Ratio: 5.62
ROE: 17.41%
ROCE: 11.23%
Dividend Yield: 0.14%
Recent Performance:
Net Profit Margin: 18.16%
Return on Assets: 2.18%
Asset Turnover Ratio: 0.14
The company has demonstrated consistent profit growth over the past five years, with a CAGR of 23.4%.
📌 Trade Strategy (For Educational Purposes):
Entry Point: ₹1,570–₹1,600 (on retest)
Stop Loss: ₹1,500
Target Levels:
₹1,635
₹1,680
₹1,750
📍 Visual Elements:
Cup & Handle pattern highlighted
Breakout point marked
Support and resistance levels indicated
Volume bars showing increased activity
RSI and MACD indicators displayed
🔔 Disclaimer: This analysis is for educational purposes only. Please conduct your own research or consult a financial advisor before making investment decisions.
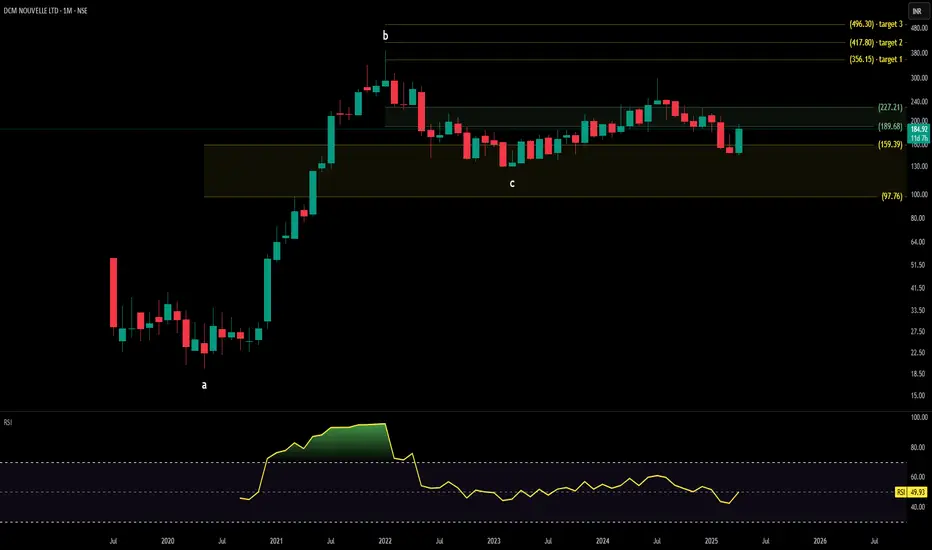
DCM NOUVELLE technical analysisStock Overview: DCM Nouvelle Ltd., listed on NSE, is currently priced at INR 184.92. The company operates in textiles, chemicals, and engineering industries, focusing on manufacturing and selling diverse products.
Key Levels:
Support: INR 97.76
Upside swing zone: Between INR 159.39 to INR 189.68
Possible upside levels: INR 227.21, INR 356.15, INR 417.80, INR 496.30
Technical Indicators:
RSI: The Relative Strength Index (RSI) stands at 49.93, signifying neutral momentum. RSI is a technical indicator used to measure the speed and change of stock price movements, identifying potential overbought or oversold conditions.
Volume: The trading volume is at 424.48K, suggesting moderate activity.
Sector and Market Context: DCM Nouvelle Ltd. operates in the textiles and chemicals sectors, which have shown mixed performance due to recent global economic shifts. These sectors are experiencing varying degrees of volatility due to supply chain disruptions, inflationary pressures, and evolving consumer preferences. The stock's behavior has aligned with these industry trends, displaying periods of consolidation alongside incremental growth phases.
Risk Considerations:
Economic Conditions: Challenges such as inflation, currency fluctuations, and slower growth projections could impact the stock's trajectory.
Sector-Specific Risks: Issues like raw material price volatility, competitive pressures, and environmental regulations pose risks.
Analysis Summary: DCM Nouvelle Ltd. demonstrates promising key levels, indicating potential for growth while maintaining robust support levels. The technical indicators suggest a balanced state, neither excessively bullish nor bearish. The stock's alignment with sector trends highlights its resilience amidst external challenges. Investors are advised to monitor the broader market context and industry-specific developments to make informed decisions.
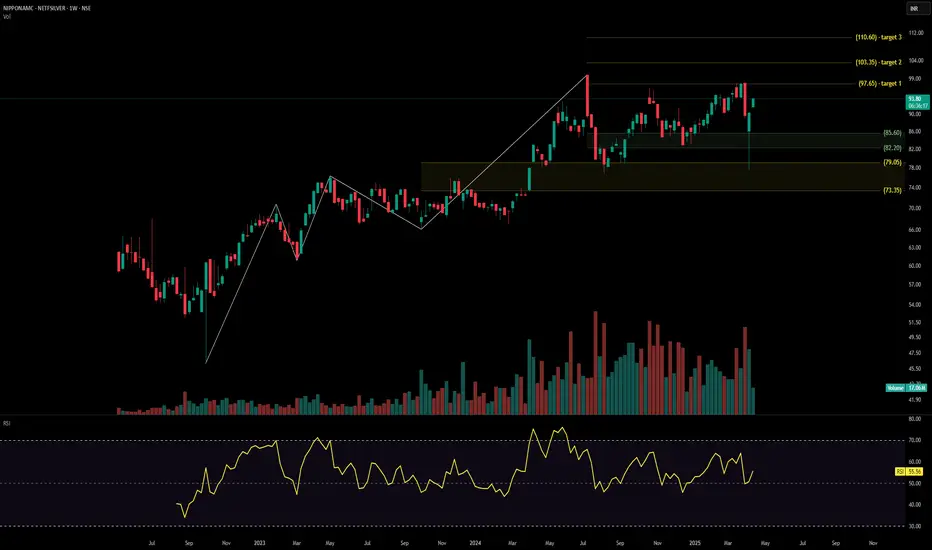
SILVERBEES ETF technical analysis Stock Overview: NIPPONAMC - NETFSILVER, listed on the Indian exchange, is currently priced at ₹93.80. This stock represents the Nippon India Silver ETF, which tracks the performance of silver, offering investors a commodity-linked investment avenue.
Key Levels:
Support Levels: ₹85.60, ₹82.20, ₹79.05, and ₹73.35.
Upside Swing Zone: ₹97.65 and ₹103.35.
Possible Upside Levels: ₹110.60.
Technical Indicators:
RSI (Relative Strength Index): Currently at 55.56, indicating that the stock is in a neutral momentum zone, neither overbought nor oversold. This suggests a balanced trading sentiment, with potential to move either way depending on market cues.
Volume: The stock shows a trading volume of 17.06 million, reflective of moderate investor activity. Consistent or spiking volumes could provide clues for trend continuation or reversal.
Sector and Market Context: The ETF's performance is closely tied to silver prices, which are influenced by global demand-supply dynamics, currency fluctuations, and macroeconomic factors. Within the broader commodity sector, silver has shown resilience amidst fluctuating market conditions, benefiting from its dual demand as both an industrial and precious metal. In the Indian market context, commodity-linked instruments like silver ETFs are gaining traction as investors diversify their portfolios.
Risk Considerations: Potential risks include high volatility in silver prices driven by geopolitical tensions, global economic uncertainty, and changes in industrial demand. Additionally, fluctuations in the Indian Rupee against major global currencies could affect returns. Adverse regulatory changes or taxation policies impacting commodity ETFs may also play a role.
Analysis Summary: NIPPONAMC - NETFSILVER offers an intriguing opportunity for investors seeking exposure to silver. The technical indicators suggest neutrality, allowing room for further analysis based on market and sector trends. Investors should remain vigilant about external factors like economic data, currency movements, and geopolitical developments that could influence silver prices and, consequently, the ETF’s performance.
### Bajaj Finance Price Analysis (April 11, 2025)### Bajaj Finance Price Analysis (April 11, 2025)
#### **Current Price and Recent Trends**
- **Latest Price:** ₹8,727.10 (as of April 9, 2025)
- **Intraday Movement (April 4, 2025):**
- **Open:** ₹8,656.00
- **High:** ₹8,797.00
- **Low:** ₹8,583.80
- **Close:** ₹8,718.85
- **52-Week Range:** ₹6,500 – ₹9,974
#### **Performance Metrics**
- **Short-Term Returns:**
- Past Week: -4.48%
- Past Month: +0.85%
- **Medium-Term Returns:**
- Past 3 Months: +17.71%
- Past 6 Months: +20.90%
- **Long-Term Returns:**
- Past Year: +19.71%
- Past 5 Years: +286.93%
#### **Fundamental Insights**
- **Market Cap:** ₹543,171 crore
- **P/E Ratio:** 33.85 (TTM)
- **Dividend Yield:** 0.42%
- **ROCE (Return on Capital Employed):** 11.14%
- **Assets Under Management (AUM):** Grew by 26% YoY to ₹416,750 crore as of March 31, 2025
#### **Sector and Peer Comparison**
- Bajaj Finance is the top performer in the financial services sector with a robust YTD return of +29% as of April 8, 2025
- Peers like SBI Cards (+27%) and Aavas Financiers (+24%) also showed strong growth due to prudent asset management and loan growth
#### **Technical Indicators**
- **Moving Averages:**
- Price is above the SMA20 (₹8,651), indicating bullish momentum .
- **Bollinger Bands:**
- Upper Band: ₹9,149
- Lower Band: ₹8,153
- The stock is trading near the upper range of Bollinger Bands, suggesting potential resistance at higher levels .
- **Momentum Indicators:**
- RSI: BUY signal with strong momentum.
- MACD: BUY signal for short-term gains.
- **Volume Analysis:** High trading volume indicates strong investor interest but also suggests selling pressure building up in the short term .
#### **Strengths**
1. Strong revenue growth driven by a diversified lending portfolio across retail, SME, and commercial customers.
2. Robust YTD returns (+29%), outperforming peers and sector indices .
3. Consistent growth in AUM (+26% YoY) and deposits (+19% YoY) .
#### **Weaknesses**
1. High P/E ratio (33.85) suggests overvaluation compared to historical averages and peers.
2. Short-term price volatility (-4.48% in the past week) indicates potential consolidation or correction.
#### **Outlook and Forecast**
- Analysts expect continued growth driven by strong customer additions (+4.7 million in Q4 FY25) and increased loan disbursements.
- Resistance levels are near ₹9,000–₹9,100; support levels are around ₹8,600–₹8,700.
- Long-term investors may benefit from holding due to consistent performance and robust fundamentals.
### Conclusion:
Bajaj Finance remains a leader in the financial services sector with strong growth metrics and solid fundamentals. However, its high valuation and recent price volatility suggest caution for short-term traders while offering long-term potential for investors focused on consistent returns and sector leadership.

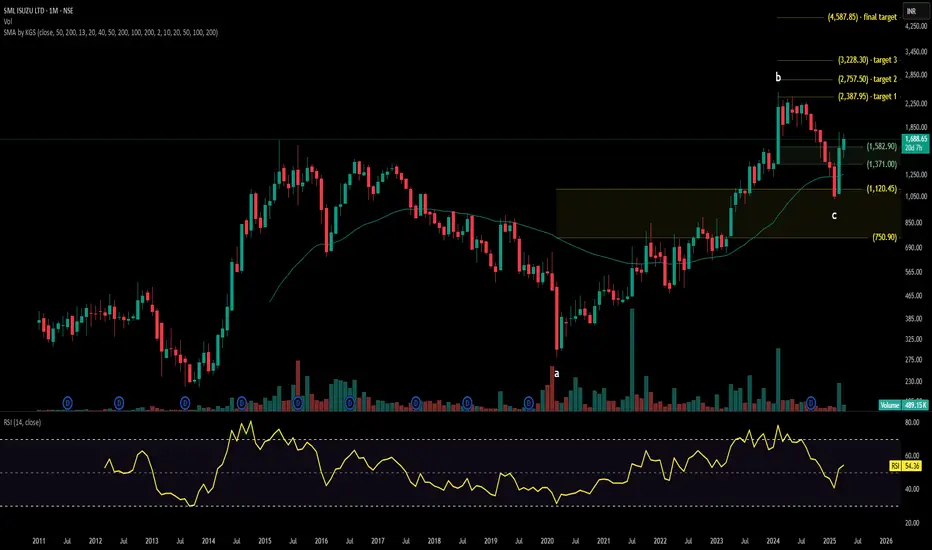
SMLISUZU technical analysisTechnical Analysis Report
Stock Overview: SML ISUZU LTD, NSE, current price: ₹1,688.65. SML ISUZU LTD is engaged in the manufacturing and sale of commercial vehicles and related components.
Key Levels:
Support: ₹750.90, ₹1,120.45
Upside swing zone: ₹1,371.00, ₹1,582.90
Possible upside levels: ₹2,387.95, ₹2,757.50, ₹3,228.30, ₹4,587.85
Technical Indicators:
RSI (Relative Strength Index) is currently at 54.36, indicating a neutral momentum.
Volume is at 489.15K, showing moderate trading activity.
MA (Moving Average) is trending upwards, suggesting a potential bullish trend.
Sector and Market Context: SML ISUZU LTD's performance should be analyzed in the context of the commercial vehicle sector, which has shown resilience and growth potential. The overall market trends indicate a recovery phase, with increased demand for commercial vehicles.
Risk Considerations: Potential risks include market volatility, changes in regulatory policies, and economic conditions that could impact the commercial vehicle industry. Additionally, supply chain disruptions and fluctuating raw material prices might influence stock movement.
Analysis Summary: SML ISUZU LTD shows promising technical indicators with potential upside levels. However, investors should consider sector performance and market conditions, along with possible risks, before making investment decisions.
XAUUSD 1H SELL PROJECTION 08.04.25Instrument: Gold Spot / U.S. Dollar (XAUUSD)
Timeframe: 1 Hour (1H)
Current Price: ~$2,995.25
Projection Date: April 8, 2025
Analysis Type: Bearish/Sell Projection
📊 Technical Elements:
🔹 Trend Analysis:
A 1H downtrend is marked with a descending trendline.
Price previously broke a key support zone, retested it (now acting as resistance), and is expected to drop again.
🔹 Trade Setup:
Entry: Near current price ($2,995.25)
Stop Loss: Above Resistance R1 at $3,010.27
Take Profit Targets:
TP1: At Support S1 (~$2,980)
TP2: At Support S2 (~$2,957)
📈 Indicators:
📍 Stochastic Oscillator (5, 3, 3):
Reading: 79.61 (green) and 80.17 (red)
Interpretation: Just above 80 → Overbought Zone
Signal: Potential reversal downwards
📍 Relative Strength Index (RSI - 14):
Value: 44.84
Interpretation: Below neutral 50, not oversold
Signal: Bearish momentum building
🧠 Conclusion / Strategy:
The chart suggests a short/sell setup for XAUUSD.
The price has retested the broken support (now resistance) and formed a rejection candle at the trendline.
Indicators support a potential downward move (Stochastic overbought + RSI weak).
Targeting lower supports for potential exit points.

EURUSD ANALYSIS OF BY & SELL ENTRY POINTAs of April 2, 2025, the EUR/USD currency pair is trading cautiously ahead of anticipated tariff announcements by President Donald Trump. Market participants are closely monitoring these developments, as they could have significant implications for global trade and currency valuations.
Multi-Timeframe Analysis:
Daily Chart: The EUR/USD pair is trading near the 1.0800 level. The 200-day Simple Moving Average (SMA) around 1.0730 has acted as a significant support level recently.
Weekly Chart: The pair has exhibited choppy range trading, with a potential to reach the 1.0900 level during this key tariff week.
TalkMarkets
Key Support and Resistance Levels:
Support Levels:
1.0730: The 200-day SMA, providing a critical support zone.
1.0800: A psychological level that has acted as a pivot in recent sessions.
Economies.com
Resistance Levels:
1.0850: Identified as a minor resistance level.
1.0900: A key resistance level that, if breached, could signal further bullish momentum.
Breakout Points:
Upside Breakout: A sustained move above the 1.0850 resistance could open the path towards the 1.0900 level.
Downside Breakout: A break below the 1.0730 support may lead to further declines, with the next significant support potentially around 1.0700.
Trade Setup:
Entry Point: Consider entering a long position if the price breaks and closes above the 1.0850 resistance level, confirming bullish momentum.
Take Profit: Set the take profit target near the 1.0900 resistance level to capitalize on potential upward movement.
Stop Loss: Place a stop loss just below the 1.0800 support level to manage risk effectively.
Risk Management:
Risk-Reward Ratio: Aim for a risk-reward ratio of at least 1:2 to ensure that potential profits justify the risks taken.
Position Sizing: Adjust your position size based on your account balance and risk tolerance, ensuring that a stop loss hit does not exceed 1-2% of your trading capital.
Additional Considerations:
Economic Events: Monitor upcoming economic data releases and geopolitical developments, especially related to tariff announcements on April 2, which could influence the EUR/USD pair.
Technical Indicators: Utilize technical indicators such as the Relative Strength Index (RSI) and Moving Averages to confirm trade signals and assess market conditions.

Technical analyses indicate a "Strong Buy" signal for EUR/USDAs of March 30, 2025, the EUR/USD currency pair has exhibited a modest upward trend, closing above 1.0830 on Friday. This movement suggests a potential continuation of the recovery.
EWM Interactive
DailyForex
Support and Resistance Levels:
Support Levels: Key support is observed near the 1.0800 mark.
Resistance Levels: The pair faces resistance around 1.0951.
Technical Indicators:
Technical analyses indicate a "Strong Buy" signal for EUR/USD
Trade Setup:
Entry Point: Consider entering a long position if the price breaks and consolidates above 1.0785.
FX.co
Take Profit Levels:
First target: 1.0854
Second target: 1.0986
Stop Loss: Place a stop loss below the 1.0742 support level to manage risk effectively.
Risk Management:
Implement appropriate risk management strategies, such as:
Using a risk-reward ratio of at least 1:2.
Adjusting position sizes based on account equity and risk tolerance.
Monitoring economic events and news that may impact the EUR/USD pair.
Conclusion:
The EUR/USD currency pair exhibited bullish tendencies throughout March 2025, with key resistance and support levels identified for potential trade opportunities. Traders should remain vigilant, considering both technical indicators and fundamental factors, to make informed decisions.

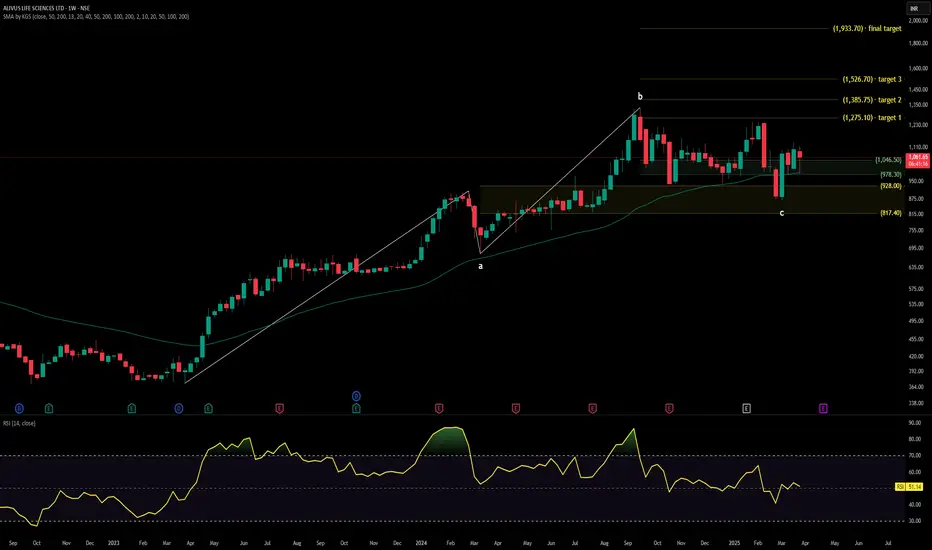
ALIVUS LIFESCIENCESStock Overview: Alivus Life Sciences Ltd, NSE, current price: ₹1,061.65. Alivus Life Sciences Ltd specializes in pharmaceuticals and life sciences, focusing on drug development and healthcare products.
Key Levels:
Support level (Yellow Zone): ₹817.40
Swing zone (Green Zone): ₹928.00 - ₹1,046.50
Target levels (T): T1: ₹1,275.10, T2: ₹1,385.75, T3: ₹1,526.70, Final target: ₹1,933.70
Technical Indicators:
RSI (Relative Strength Index): Currently at 51.14, indicating neutral momentum as it is neither overbought nor oversold.
Volume: Significant spikes during price movements, reflecting strong trading activity and investor interest.
MA (Moving Average): The stock price is above the 200-period moving average, suggesting a long-term bullish trend.
Sector and Market Context: The pharmaceutical sector has demonstrated resilience and growth potential due to ongoing healthcare demands. Alivus Life Sciences Ltd's performance aligns with this trend, showing cautious optimism in a market focused on stable growth sectors.
Risk Considerations: Potential risks include regulatory changes, market competition, and global economic conditions affecting the pharmaceutical industry. Adverse events related to drug approvals or clinical trials could also impact the stock's movement.
Analysis Summary: Alivus Life Sciences Ltd presents a promising technical setup with identified support and target levels. Neutral to bullish indicators like RSI and moving averages, coupled with strong volume activity, suggest investor interest. However, sector-specific risks and broader market conditions should be carefully considered. This analysis is for informational purposes and does not constitute a direct buy/sell recommendation.
EURUSD SELL OPTION
NEWS :
U.S. Dollar Strength: The U.S. dollar has strengthened to a three-week high against the euro, bolstered by robust U.S. services data and a more cautious stance from President Donald Trump on imposing new tariffs. This has alleviated some fears of an economic slowdown and contributed to the dollar's appreciation.
Technical Indicators: The EUR/USD pair has broken below the 1.0800 support level, reaching three-week lows. This decline suggests potential for further downside movement
Resistance Levels (Sell Zone)
1.0925 - 1.0950 → Major resistance (Double Top Formation)
1.0860 - 1.0885 → Key resistance (Previous swing high)
1.0820 - 1.0800 → Intraday resistance (Breakout Level)
🔻 Support Levels (Buy Zone)
1.0720 - 1.0700 → First support (Recent low)
1.0650 - 1.0630 → Strong support (Fib 61.8% retracement)
1.0590 - 1.0560 → Major support (Critical demand zone)
🔴 Sell Trade Setup:
Entry Point: 1.0800 - 1.0820 (Confirmed resistance zone)
Stop Loss: 1.0860 (Above key resistance to limit risk)
Take Profit 1: 1.0720 (+80 pips)
Take Profit 2: 1.0650 (+150 pips)
Take Profit 3: 1.0590 (Major support level)
📉 Key Indicators Supporting Sell Bias
Break Below Support: Price has breached 1.0800, signaling potential further downside.
Moving Averages: Trading below the 50-SMA and 200-EMA, confirming a bearish trend.
RSI: Below 50, indicating bearish momentum.
MACD: Bearish crossover, showing selling pressure.
Double Top Formation: Resistance at 1.0950 suggests further decline.
Conclusion:
EUR/USD is currently exhibiting bullish momentum across multiple timeframes, with key resistance levels approaching. Traders should monitor these levels closely and consider the outlined trade setup, ensuring adherence to risk management principles. As always, stay updated with economic events and market news that could influence currency movements.

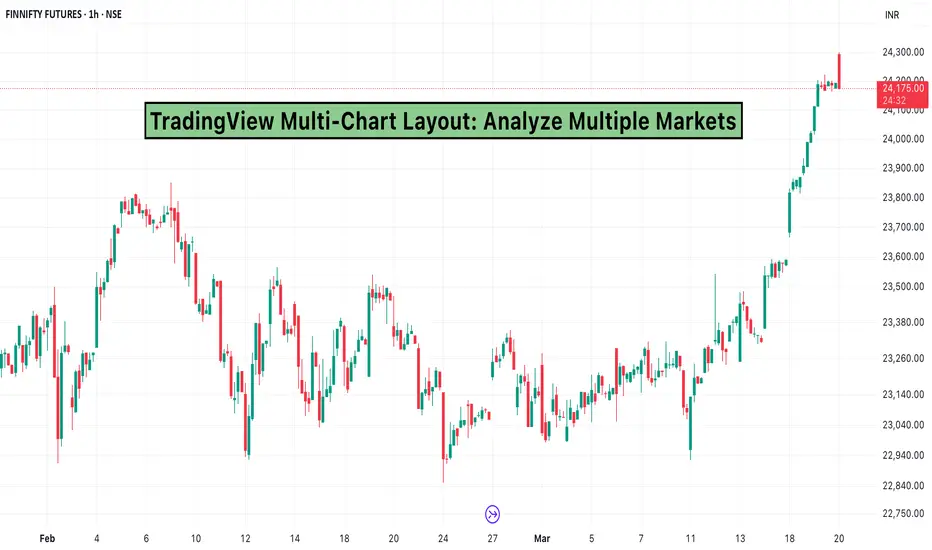
TradingView Multi-Chart Layout: Analyze Multiple MarketsEffective market analysis requires tracking multiple assets simultaneously. TradingView’s multi-chart layout allows traders to monitor different markets, time frames, and instruments within a single workspace.
1. Why Use the Multi-Chart Layout?
Compare Different Markets: Analyze stocks, forex pairs, and commodities side by side.
Monitor Multiple Time Frames: Track short-term trends while keeping an eye on the bigger picture.
Improve Efficiency: Avoid switching between tabs and maintain a seamless trading experience.
Enhance Strategy Execution: Spot correlations and divergences across different instruments.
2. How to Set Up a Multi-Chart Layout in TradingView
Open the TradingView Chart – Start by launching the TradingView platform.
Select the Multi-Chart Layout – Click on the "Select Layout" option in the toolbar and choose from available configurations (2, 4, 6, or more charts per screen).
Add Different Markets or Time Frames – Assign each section of the layout to a different asset, index, or time frame.
Sync Chart Settings – Enable options like synchronized time frames, crosshairs, and drawings for seamless comparisons.
Customize Each Chart – Apply indicators, change themes, and adjust chart types to fit your analysis.
3. Best Practices for Using Multi-Chart Layouts
Use Different Time Frames for the Same Asset: Helps in confirming trends before making a trade.
Compare Correlated Assets: Track movements in related markets, such as gold and the US dollar.
Monitor Leading Indicators: Watch for signals in major indices before entering trades in individual stocks.
Keep the Layout Organized: Avoid clutter by using only the necessary number of charts for your strategy.
4. Who Should Use Multi-Chart Layouts?
Day Traders: Quickly compare assets and spot opportunities in real time.
Swing Traders: Analyze market trends across different time frames before entering trades.
Portfolio Managers: Track multiple holdings simultaneously to manage risk effectively.
Macro Analysts: Compare global markets and intermarket relationships.
Conclusion
The TradingView multi-chart layout is a powerful tool that helps traders analyze multiple markets efficiently. Whether you are tracking stocks, forex, or commodities, using this feature can enhance decision-making and improve your trading strategy.
Tata Motor 15 minWave 3 Extension: Wave 3 appears extended, as is common in Elliott Wave patterns. This strengthens the impulse count.
Wave 4 Complexity: The exact nature of Wave 4 is crucial. A deeper correction would invalidate the current count.
Potential Wave 5 Target: If Wave 5 materializes, we can use Fibonacci to project potential price targets.
Indicators: The MACD and Williams %R are showing some divergence, which could be an early warning sign of a potential reversal or continuation of the trend. However, these indicators should be used in conjunction with price action and wave patterns.

HindalcoLet's analyze **Hindalco Industries Ltd.** from both a **fundamental** and **technical** perspective.
### **Fundamental Analysis of Hindalco Industries Ltd.**
#### **Overview of Hindalco Industries Ltd.**
- **Sector:** Metals, Mining, Aluminium, Copper
- **Industry:** Aluminium, Copper, and Metal Products
- **Founded:** 1958
- **Headquarters:** Mumbai, Maharashtra, India
- **Market Cap:** Approx. ₹90,000 crore (as per the latest data)
**Hindalco Industries Ltd.**, a part of the **Aditya Birla Group**, is one of the largest manufacturers of aluminium and copper products in India. The company is a leading player in the metal sector, with a diverse product portfolio, including aluminium sheets, foil, wire rods, copper cathodes, and more.
Hindalco operates through two primary business segments:
- **Aluminium:** Including alumina refining, primary aluminium production, rolling, and extrusions.
- **Copper:** Includes copper cathodes and related products, which are widely used in electrical, industrial, and telecommunications applications.
#### **Key Financials (Latest Report)**
- **Revenue Growth:** Hindalco has seen consistent revenue growth driven by strong demand in both aluminium and copper products. The company benefits from robust demand in the infrastructure, automotive, and electrical industries.
- **Profitability:** Hindalco's profitability is relatively stable, benefiting from economies of scale, a diversified product portfolio, and integrated operations. The company has maintained solid operating margins.
- **Debt Levels:** Hindalco has a manageable debt load, though it operates in a capital-intensive sector. The company has demonstrated a consistent ability to service debt, supported by strong cash flows from operations.
- **Cash Flow & Dividend Yield:** Hindalco generates strong operational cash flow, allowing it to fund capital expenditures, debt servicing, and pay consistent dividends to shareholders.
#### **Valuation Ratios**
- **P/E Ratio:** Hindalco's P/E ratio is typically lower than that of high-growth sectors, reflecting its cyclical nature. However, its stable growth in aluminium and copper makes it a defensive play in the metals sector.
- **P/B Ratio:** The P/B ratio is moderate, reflecting Hindalco’s substantial asset base in aluminium and copper production. This ratio tends to track closely with the company’s earnings growth and commodity prices.
- **Dividend Yield:** Hindalco is known for paying consistent and healthy dividends, which is attractive for long-term investors seeking income alongside capital appreciation.
#### **Industry & Macro Trends**
- **Global Aluminium and Copper Demand:** The demand for aluminium and copper is tied to global economic growth, particularly in infrastructure, automotive, and construction sectors. Hindalco benefits from rising global demand for lightweight materials like aluminium.
- **Commodity Prices:** Hindalco’s margins are highly sensitive to fluctuations in the prices of aluminium, copper, and energy. The prices of these commodities are volatile and can impact profitability, especially in periods of global supply disruptions or changes in demand.
- **Government Regulations and Policies:** Being in the metals sector, Hindalco is impacted by government policies related to environmental regulations, mining rights, and pricing regulations for raw materials.
- **Competition:** Hindalco competes with global players such as **Norsk Hydro**, **Rio Tinto**, and **Vedanta** in aluminium and copper. Domestic competitors include **National Aluminium Company (NALCO)** and **Vedanta Limited**.
---
### **Technical Analysis of Hindalco Industries Ltd.**
Let’s evaluate the **technical outlook** of Hindalco based on its stock price patterns, momentum indicators, and key levels:
#### **Price Action:**
- **Current Price:** Hindalco has experienced volatility over time, reflecting both global commodity price trends and company-specific events. The stock could move in line with broader metal sector trends.
#### **Key Levels:**
- **Support Levels:**
- **₹430-₹450:** This support level has historically been an important area where Hindalco’s stock tends to find buying interest. A fall below this zone could signal further downside risk.
- **₹400-₹420:** If the stock pulls back, this level could provide another level of support, especially during market corrections or commodity price pullbacks.
- **Resistance Levels:**
- **₹500-₹520:** This range is a significant resistance zone for Hindalco. A breakout above this level would signal strong bullish momentum, especially if accompanied by high volume.
- **₹550:** This is another key resistance level. A break above ₹550 could signal that the stock is entering a new bullish phase and could lead to further upside.
#### **Moving Averages:**
- **50-Day Moving Average (50-MA):** If Hindalco is trading above its 50-day moving average, it is considered to be in a short-term uptrend. A cross below the 50-day MA would indicate a potential shift to a bearish phase.
- **200-Day Moving Average (200-MA):** The 200-day moving average is a strong indicator of the long-term trend. A stock trading above this level signals long-term bullishness, while a fall below this would indicate a bearish trend.
#### **Momentum Indicators:**
- **RSI (Relative Strength Index):**
- An RSI above 70 would suggest that Hindalco might be overbought and due for a pullback.
- An RSI below 30 indicates the stock may be oversold and could be due for a reversal or consolidation.
- **MACD (Moving Average Convergence Divergence):**
- A positive MACD (when the MACD line crosses above the signal line) would suggest upward momentum.
- A negative MACD (when the MACD line crosses below the signal line) would indicate weakening momentum or potential reversal to the downside.
#### **Volume Analysis:**
- **Volume Trends:** Rising volume during price increases suggests strong buying interest and can confirm a bullish trend. Similarly, decreasing volume during price drops could indicate that selling pressure is subsiding.
- **Volume Spikes:** A large spike in volume at key support or resistance levels (₹450, ₹500) could signal a breakout or breakdown, depending on the direction of the price move.
---
### **Conclusion:**
- **Fundamental Strengths:**
- Hindalco Industries is a dominant player in the global aluminium and copper markets with strong fundamentals, including a solid revenue base, good profitability, and strong cash flow.
- The company is well-positioned to benefit from the growing demand for aluminium, driven by sectors like automotive, infrastructure, and electrical.
- Despite the cyclical nature of the metals industry, Hindalco’s diversified business and strong management enable it to weather volatility and continue to generate value for shareholders.
- **Technical Outlook:**
- **Support levels:** ₹430-₹450 (primary), ₹400-₹420 (secondary).
- **Resistance levels:** ₹500-₹520 (primary), ₹550 (psychological resistance).
- The stock is likely to follow the global trends in aluminium and copper prices. Keep an eye on the breakout above resistance levels for further upward momentum.
#### **Risks to Consider:**
- **Commodity Price Volatility:** Hindalco’s performance is closely tied to fluctuations in aluminium and copper prices. Global economic conditions and supply-demand imbalances in metals can significantly impact profitability.
- **Geopolitical Risks:** Trade tariffs, sanctions, and other geopolitical factors can impact the prices and supply of raw materials, potentially affecting Hindalco’s margins.
---
**Disclaimer:**
The information provided is for educational purposes only and should not be construed as financial or investment advice. I am not a SEBI-registered advisor, and this analysis is not a recommendation to buy, sell, or hold any securities. Accuracy and timeliness of the data cannot be guaranteed. Always conduct your own research or consult with a professional before making investment decisions. I do not take responsibility for any losses incurred.

Chambl-Fertilizer watch for breakoutLet's analyze **Chambal Fertilizers and Chemicals Ltd. (CHAMBLFERT)** from both a **fundamental** and **technical** perspective.
### **Fundamental Analysis of Chambal Fertilizers & Chemicals Ltd. (CHAMBLFERT)**
#### **Overview of Chambal Fertilizers & Chemicals Ltd.**
- **Sector:** Fertilizers & Agrochemicals
- **Industry:** Fertilizers, Chemicals
- **Founded:** 1985
- **Headquarters:** Kota, Rajasthan, India
- **Market Cap:** Approx. ₹20,000 crore (as per the latest data)
Chambal Fertilizers & Chemicals Ltd. is one of India’s leading manufacturers and marketers of fertilizers. The company primarily produces Urea and other nitrogenous fertilizers. It is part of the **SKS Group**, which has a strong presence in the Indian agricultural and chemical sectors.
#### **Key Financials (Latest Report)**
- **Revenue Growth:** Chambal Fertilizers has shown consistent growth, driven by increased demand for fertilizers, especially in India’s agricultural sector. The company's revenue is sensitive to changes in fertilizer subsidies, raw material costs, and government policies.
- **Profitability:** The company has maintained stable profitability due to its scale and integrated operations, with a focus on efficient production. Chambal Fertilizers benefits from favorable subsidies provided by the Indian government to the fertilizer sector.
- **Debt Levels:** Chambal Fertilizers has a moderate debt-to-equity ratio typical for companies in the capital-intensive fertilizer industry. The company’s debt levels have been manageable, as it generates stable cash flows.
- **Cash Flows:** The company benefits from a predictable cash flow structure due to the government support for fertilizers. However, fluctuations in raw material costs and subsidy payments can affect cash flow in the short term.
#### **Valuation Ratios**
- **P/E Ratio:** Chambal Fertilizers has a relatively low P/E ratio compared to many other sectors, which is typical for companies in the fertilizer space. The P/E ratio is influenced by the company's steady revenue and stable margins.
- **P/B Ratio:** The price-to-book ratio of Chambal Fertilizers is generally moderate, reflecting its asset base and efficient management of capital.
- **Dividend Yield:** Chambal Fertilizers has a strong dividend track record, reflecting its stable earnings and cash flow generation. Investors in this stock typically benefit from a regular dividend payout.
#### **Industry & Macro Trends**
- **Fertilizer Demand in India:** India remains one of the largest consumers of fertilizers due to its large agricultural sector. Government subsidies and policies support demand for fertilizer products, including urea and other nitrogenous fertilizers.
- **Subsidy Support:** The Indian government has a significant impact on the fertilizer sector due to subsidies for urea. Any changes in subsidy policy can influence the profitability of companies like Chambal Fertilizers.
- **Raw Material Costs:** Chambal Fertilizers' margins are sensitive to fluctuations in raw material costs, such as natural gas (used for urea production), which can affect production costs.
- **Agricultural Growth:** The growth in India’s agricultural output, including increased acreage for key crops like wheat and rice, directly impacts the demand for fertilizers.
- **Competition:** Chambal Fertilizers faces competition from other major fertilizer producers like National Fertilizers Ltd., IFFCO, and Rashtriya Chemicals and Fertilizers (RCF).
---
### **Technical Analysis of Chambal Fertilizers & Chemicals Ltd. (CHAMBLFERT)**
Let’s evaluate the **technical outlook** of Chambal Fertilizers, based on its stock price patterns and key levels:
#### **Price Action:**
- **Current Price:** Chambal Fertilizers' stock price tends to move in tandem with the overall agricultural and chemical sector sentiment. The price may consolidate within a range depending on the broader market conditions and agricultural output forecasts.
#### **Key Levels:**
- **Support Levels:**
- **₹300-₹320:** This range could be considered as the first level of support. If the stock approaches this level and bounces, it would suggest buying interest around this zone.
- **₹280-₹290:** If the stock falls below the ₹300 level, the ₹280-₹290 range could act as a secondary support level, marking a strong point for potential price stabilization or reversal.
- **Resistance Levels:**
- **₹350-₹370:** This level is a critical resistance zone, where selling pressure might emerge. A breakout above this level could signal bullish movement in the stock.
- **₹400:** This is a key psychological resistance level. If the stock breaks above ₹400 with strong volume, it could indicate further upside potential.
#### **Moving Averages:**
- **50-Day Moving Average (50-MA):** If the stock is trading above the 50-day moving average, it suggests short-term bullish momentum. A cross below the 50-MA could signal weakness.
- **200-Day Moving Average (200-MA):** This is the key indicator for long-term trends. If the stock is above the 200-day MA, it suggests that the long-term trend remains bullish. If the stock is below, it could indicate a prolonged downtrend or neutral market conditions.
#### **Momentum Indicators:**
- **RSI (Relative Strength Index):**
- An RSI above 70 would indicate that the stock is overbought and might be due for a pullback.
- An RSI below 30 suggests oversold conditions and could present a buying opportunity if the stock shows signs of reversal.
- **MACD (Moving Average Convergence Divergence):**
- A positive MACD (when the MACD line crosses above the signal line) would suggest bullish momentum.
- A negative MACD (when the MACD line crosses below the signal line) would suggest weakening momentum.
#### **Volume Analysis:**
- **Volume Trends:** Pay attention to volume trends. If the stock rallies with increasing volume, it would suggest strong buying conviction. Conversely, declining volume during price increases may suggest a lack of conviction.
- **Volume Spikes:** A significant volume spike at key support or resistance levels could indicate that a breakout or breakdown is imminent.
---
### **Conclusion:**
- **Fundamental Strengths:**
- Chambal Fertilizers benefits from a stable and predictable demand for its products due to India’s large agricultural sector and government subsidies.
- The company has a robust track record of profitability, strong cash flows, and a shareholder-friendly dividend policy.
- It faces risks from raw material cost fluctuations and any changes in government subsidy policy but is well-positioned in the fertilizer market due to its scale and distribution reach.
- **Technical Outlook:**
- **Support levels:** ₹300-₹320 (primary) and ₹280-₹290 (secondary).
- **Resistance levels:** ₹350-₹370 (primary) and ₹400 (psychological resistance).
- The stock is likely to remain range-bound unless it breaks out of the key resistance levels. Watch for momentum indicators like the MACD and RSI for potential trend changes.
#### **Risks to Consider:**
- **Policy Risks:** Any changes in fertilizer subsidies or government regulations could impact profitability.
- **Commodity Price Volatility:** Rising raw material costs could compress margins.
---
**Disclaimer:**
The information provided is for educational purposes only and should not be construed as financial or investment advice. I am not a SEBI-registered advisor, and this analysis is not a recommendation to buy, sell, or hold any securities. Accuracy and timeliness of the data cannot be guaranteed. Always conduct your own research or consult with a professional before making investment decisions. I do not take responsibility for any losses incurred.

#Nmdc stock longLet's dive into the analysis of **NMDC Limited (National Mineral Development Corporation)**. I'll provide both a **technical** and **fundamental** analysis based on the current data available.
### **Fundamental Analysis**
#### **Overview of NMDC**
- **Sector:** Mining & Metals
- **Industry:** Iron Ore Mining
- **Market Cap:** Approx. ₹37,000 crore (as of the last update)
- **Headquarters:** Hyderabad, India
NMDC is one of India’s largest iron ore producers, with operations in Chhattisgarh and Karnataka. The company is largely involved in the extraction, production, and sale of iron ore, which is a key input for steel manufacturing.
#### **Key Financials (Latest Report)**
- **Revenue Growth:** The company has witnessed fluctuating revenue growth, largely driven by global demand for iron ore, and domestic supply-demand dynamics. For the fiscal year, revenue growth can be influenced by iron ore price changes.
- **Profitability:** NMDC has a strong profitability profile, with solid margins driven by the strategic positioning in the mining industry. The profitability tends to be cyclical, linked to iron ore prices.
- **Debt Levels:** NMDC is considered financially stable with moderate debt levels.
- **Dividends:** Historically, NMDC has been a consistent dividend payer, which is attractive to income-focused investors.
#### **Valuation Ratios**
- **P/E Ratio:** This can vary based on market conditions. A lower P/E ratio could indicate the stock is undervalued, while a high P/E suggests higher growth expectations.
- **P/B Ratio:** Reflects how the market values the company’s assets.
- **Dividend Yield:** Historically around 6-7%, making it an attractive stock for dividend investors.
#### **Industry & Macro Trends**
- **Iron Ore Prices:** The profitability of NMDC is closely tied to global iron ore prices, which are affected by demand from countries like China, and trends in the steel industry.
- **Domestic Demand:** The demand for iron ore in India is rising as infrastructure projects and steel production increase.
- **Regulatory Risks:** NMDC’s operations could be impacted by changes in government policy and regulations related to mining in India.
---
### **Technical Analysis**
Let’s analyze the stock's technical position as of today.
#### **Price Action**
- **Current Price:** This fluctuates frequently, so it's important to get the exact data from a live market feed.
- **Chart Patterns:** Keep an eye on whether the stock is showing signs of consolidation, upward/downward trends, or forming specific patterns like triangles, head and shoulders, etc.
#### **Key Levels:**
- **Support Levels:**
- **₹95-₹100**: Historically, this zone has provided strong support, where buyers have stepped in during price declines.
- **₹85-₹90**: Another level of support if the stock experiences a sharp decline.
- **Resistance Levels:**
- **₹120-₹125**: This level has acted as resistance in the past, where selling pressure increased.
- **₹130-₹135**: A critical resistance zone; breaking this could signal a stronger bullish trend.
#### **Moving Averages:**
- **50-Day Moving Average (50-MA):** If the stock is trading above the 50-day MA, it indicates bullish momentum.
- **200-Day Moving Average (200-MA):** Acts as a long-term trend indicator. A stock trading above the 200-MA is considered to be in a long-term uptrend.
#### **Momentum Indicators:**
- **RSI (Relative Strength Index):** Measures the strength of a trend. If RSI is above 70, the stock could be overbought; if below 30, it could be oversold.
- **Current RSI:** Check for signs of overbought or oversold conditions.
- **MACD (Moving Average Convergence Divergence):** A helpful trend-following indicator. Positive MACD signals could point to bullish momentum, while negative signals indicate a possible bearish reversal.
#### **Volume Analysis:**
- **Volume Trends:** Rising volume with an upward price trend confirms the strength of a bullish move, while increasing volume during a decline signals selling pressure.
- **Volume Spikes:** Can indicate strong interest in either buying or selling, especially during breakout or breakdown scenarios.
#### **Recent Price Action and Trend:**
- **Uptrend/Downtrend:** Evaluate whether the stock is in an uptrend or downtrend over the past 6-12 months.
- **Breakouts/Breakdowns:** Look for any signs of breakout (price above resistance) or breakdown (price below support) in recent charts.
---
### **Conclusion:**
- **Fundamental Strengths:**
- NMDC is well-positioned within the mining sector in India, with strong market positioning in iron ore production.
- The company's stable financial health and regular dividend payouts make it attractive for long-term investors.
- **Technical Outlook:**
- The stock has been in a range-bound movement recently, with significant support around ₹100 and resistance near ₹125.
- Any break above ₹125 might see further bullish momentum, while a fall below ₹100 might trigger a bearish trend.
- RSI, MACD, and volume indicators can give further insights into short-term market moves.
This analysis should be cross-verified with real-time market data and investor sentiment for more accurate decision-making.

Technical Analysis and Trading Plan for Nifty Bank IndexNifty Bank Index (5-minute Chart)
Current Price: ₹49,519.50
Trend Analysis:
Resistance Levels: The index is approaching a resistance zone around ₹49,800 to ₹49,900.
Support Levels: A strong support zone appears between ₹49,400 and ₹49,000.
The recent price action suggests the formation of a potential bullish pattern as it attempts to bounce from the support zone.
Volume: Monitor the volume during breakouts; high volume could confirm strength.
Indicators: Look for indicators such as RSI to confirm overbought or oversold conditions.
Trading Plan for Nifty Bank Index:
Buy Entry: Above ₹49,800 with a confirmation candle.
Target Price: ₹50,100 and then ₹50,300 on upward momentum.
Stop Loss: Below the support level at ₹49,400.
