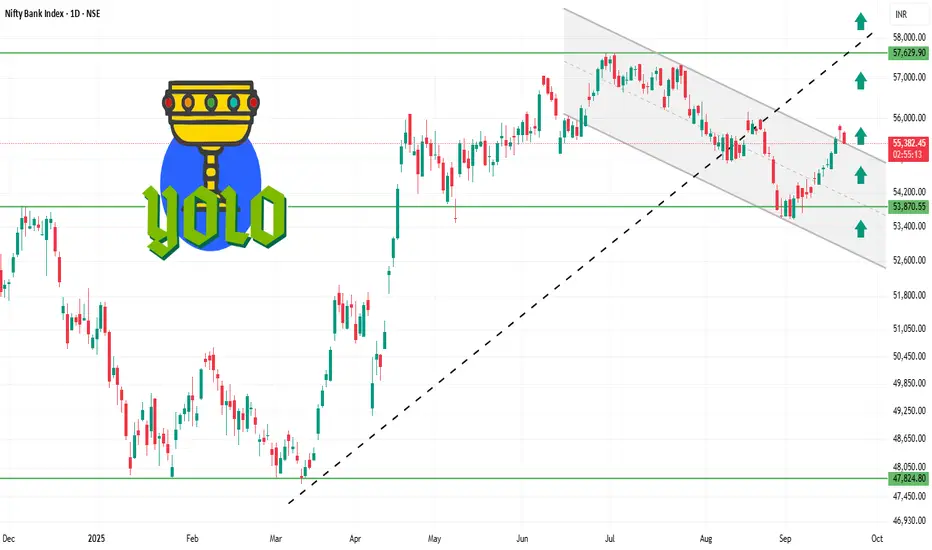
BANKNIFTY 1D Time frame✅ Current Facts
Current Level: ~ 55,400 – 55,480
Trend: Mildly bullish; trading above short-term moving averages (20-day & 50-day EMA).
Momentum Indicators:
RSI (14-day): ~61 → bullish but not overbought.
MACD: Positive → supporting the upward trend.
Price Action: Daily candles show small upper wicks → minor profit-taking near resistance.
⚙️ Outlook
Bullish Scenario:
Holding above 55,350 → retest 55,550–55,600 and possibly 55,700–55,750.
Range / Consolidation:
Price oscillates between 55,350 – 55,550 → sideways trading likely.
Bearish Scenario:
Close below 55,350 → downside risk toward 55,150–55,200 or lower.
⚠️ Key Facts
55,400 – 55,500 is acting as a short-term pivot: above it favors bulls, below it favors bears.
Resistance at 55,550–55,600 is the first hurdle; breakout here can lead to further upside.
Support at 55,300–55,350 is critical; failing to hold may lead to short-term correction.
Search in ideas for "INDICATORS"
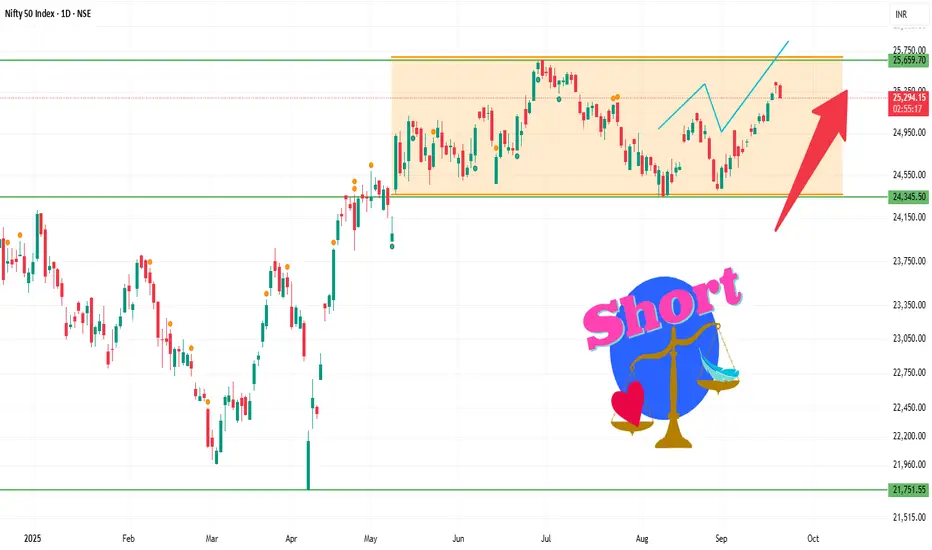
Nifty 1D Time frameCurrent Facts
Current Level: ~25,300–25,310
Trend: Mildly bullish; Nifty is trading above short-term moving averages (20-day & 50-day EMA).
Momentum Indicators:
RSI (14-day): ~60 → positive but not overbought.
MACD: Positive → supports short-term bullish bias.
Price Action: Daily candles show small upper wicks → slight profit-booking near resistance levels.
⚙️ Outlook
Bullish Scenario:
Holding above 25,270 → retest 25,350–25,370 and possibly 25,420–25,450.
Range / Consolidation:
Price oscillates between 25,270 – 25,350 → sideways action expected.
Bearish Scenario:
Close below 25,250 → downside risk toward 25,180–25,200 or lower.
⚠️ Facts
25,300–25,310 acts as a short-term pivot — above it favors bulls, below it favors bears.
Immediate resistance is at 25,350–25,370; breakout here can trigger upside momentum.
Support at 25,250 is crucial; failure to hold may result in deeper correction.
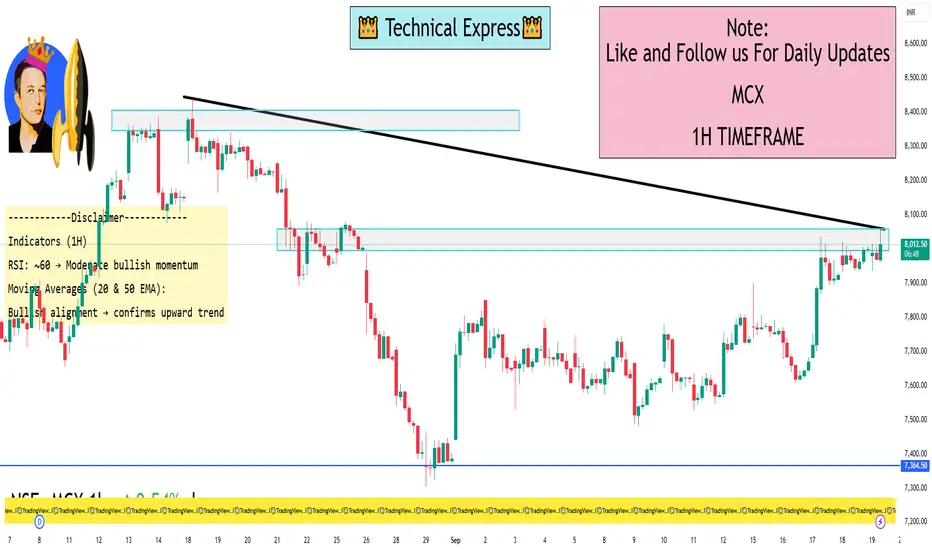
MCX 1 Hour ViewMCX 1-Hour Time Frame Levels (Structured View)
Current Price: ₹8,550 (as of 19th Sep 2025, 11:36 AM IST)
Trend Analysis (1H):
Short-term: Slightly bullish
Price action: Higher highs and higher lows in an upward channel
Key Levels:
Support Levels:
₹8,400 – Major intraday support
₹8,300 – Strong support for potential bounce
Resistance Levels:
₹8,650 – First intraday resistance
₹8,750 – Strong resistance, breakout confirmation above this
Indicators:
RSI (1H): ~60 → Moderate bullish momentum
Moving Averages (1H):
MA 20 above MA 50 → Supports bullish trend
MA alignment confirms upward momentum
Intraday Trading Notes:
Watch price reaction at ₹8,400 and ₹8,650 for reversal or breakout setups
Candlestick patterns near support/resistance levels can indicate entry/exit
Keep an eye on broader market news affecting commodities
Heritage Foods (Daily) - Will the Bullish momentum continue ?Heritage Foods executed a powerful bullish move today, surging by +8.08% on the back of exceptionally high trading volume. The stock successfully breached two critical resistance levels, signaling a potential shift in trend.
The most significant of these was the breakout from a long-term horizontal resistance trendline , a barrier that has been in place for a considerable period. Additionally, it cleared a more recent short-term horizontal resistance .
Confirmation Signals 👍
The bullish outlook is supported by key technical indicators:
- Massive Volume: The breakout was accompanied by a huge surge in trading volume , indicating strong conviction from buyers and validating the move.
- Positive Momentum: Short-term Exponential Moving Averages (EMAs) are in a positive crossover state , which further confirms the building upward momentum.
Future Outlook and Scenarios
- Upside Potential 📈: If the breakout is sustained and the bullish momentum continues, the stock could be headed towards the next price target of ₹593 .
- Downside Risk 📉: Conversely, if the breakout fails to hold and the momentum reverses, the stock may pull back to find support near the ₹457 level.
Keep an eye on the price-action !!

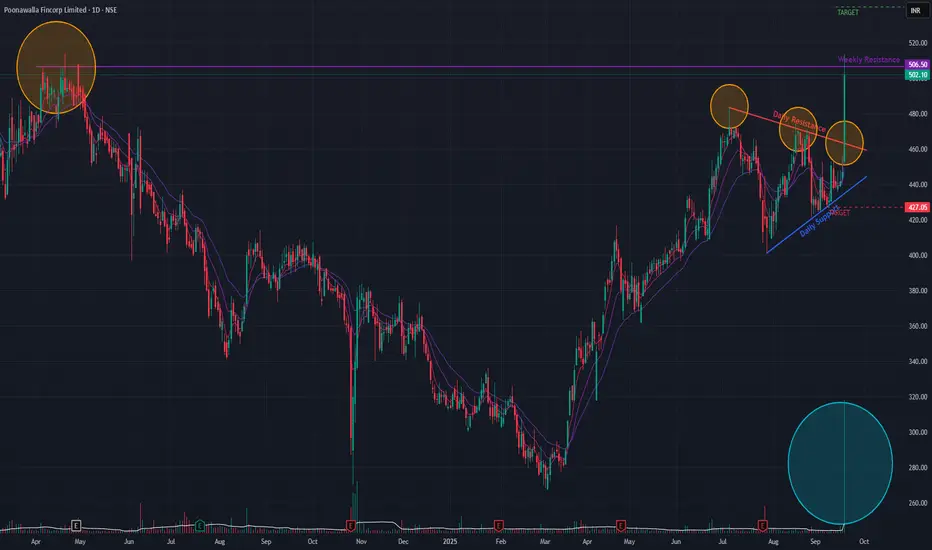
Poonawalla Fincorp (Daily) - Potential ATH ?Poonawalla Fincorp has shown a significant bullish development, decisively breaking out of a Triangle continuation pattern today. This breakout was marked by a substantial 12.30% surge in price , backed by exceptionally high trading volume.
This move signals a potential continuation of the bullish run that began in March 2025, which itself was a reversal of a downtrend initiated by a Double-Top bearish pattern in April 2024.
Bullish Confirmation Signals 👍
The positive outlook is supported by several key indicators:
- Breakout Volume: The price surge was accompanied by a massive spike in volume , indicating strong conviction and participation from buyers.
- Momentum: Short-term Exponential Moving Averages (EMAs) have formed a positive crossover , confirming the renewed bullish momentum in the immediate term.
Immediate Hurdle Ahead 🚧
Despite the strong breakout, the stock is now trading at a crucial long-term resistance level . Overcoming this barrier is essential for the upward trend to continue.
Future Outlook and Scenarios
- Bullish Case 📈: If the upward momentum is sustained and the stock successfully breaks through the current long-term resistance, it could clear the path to test its all-time high . An initial price target in this scenario would be the ₹539 level.
- Bearish Case 📉: Conversely, if the stock fails to breach this resistance, the momentum could fade, potentially leading to a price correction towards the ₹427 support level.
Watchout for the price-action in the next few sessions !!
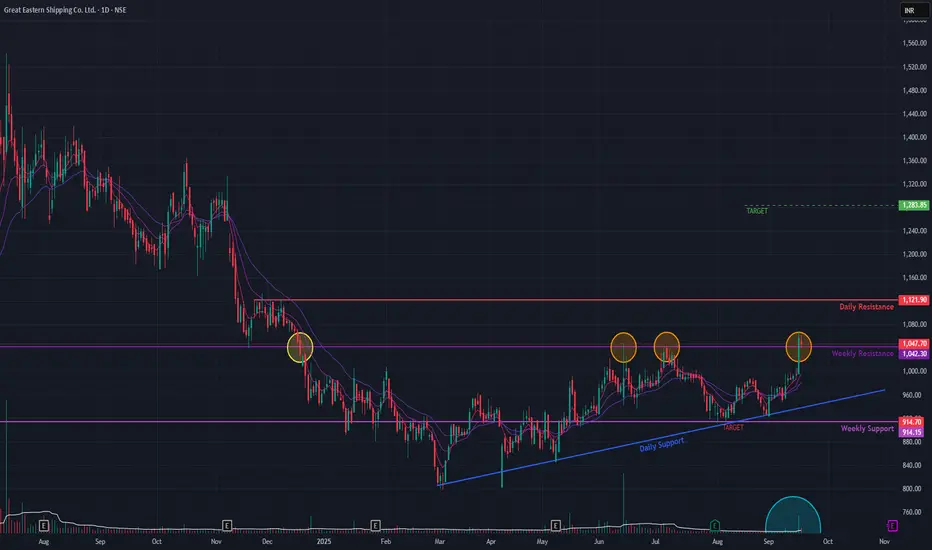
GE Shipping (Daily Timeframe) - Potential Breakout ??GE Shipping has broken out from a critical, long-term resistance level originating from December 2023. The stock is showing strong bullish momentum, confirmed by multiple technical signals.
Key Observations:
Pattern: A double-bottom in April 2025 ended the prior downtrend, leading to a period of consolidation.
Breakout: On Sep 16, 2025, the stock decisively broke above the resistance on high volume.
Confirmation: The breakout was confirmed on Sep 17, as the old resistance successfully held as new support.
Indicators: Bullish EMA crossovers and sustained above-average volume support the move.
Price Outlook :
Upside Target: ₹1283 if the price remains above the breakout level.
Downside Risk: A failure to hold this new support could lead to a decline towards the ₹914 level.
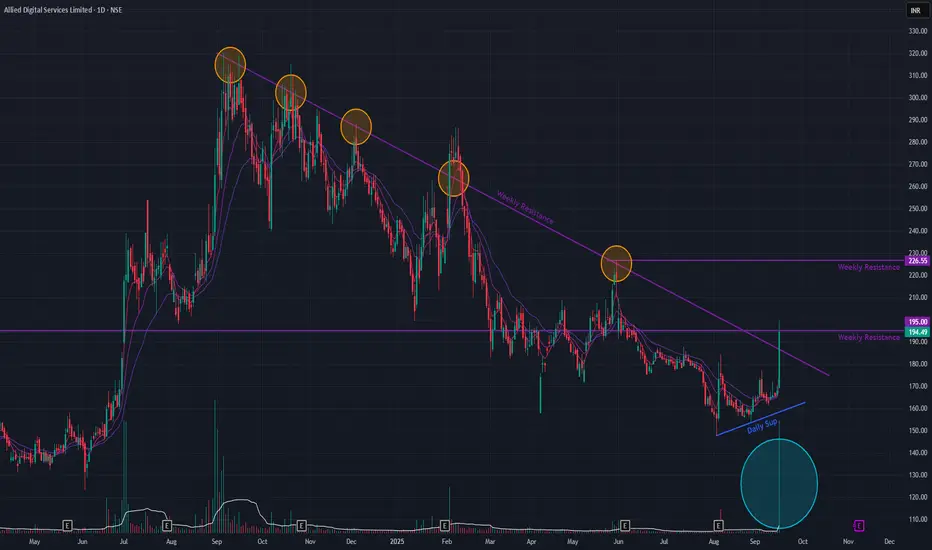
ADSL (Daily Timeframe) - Potential BreakOut / Reversal ?After a sustained downtrend since September 2024, ADSL is exhibiting significant bullish activity that requires careful monitoring.
Today's Action: The stock gained +15.73% on massive volume, challenging its primary descending trendline.
Bullish Indicators: Short-term Exponential Moving Averages (EMAs) have formed a positive crossover, signaling a potential shift in momentum.
Confirmation Required:
Historical Precedent: Similar breakout attempts have failed in the past, raising the possibility of a "false breakout."
Key Levels: To confirm the reversal, ADSL must hold above the trendline (a successful re-test) and decisively break the horizontal resistance established in January 2024.
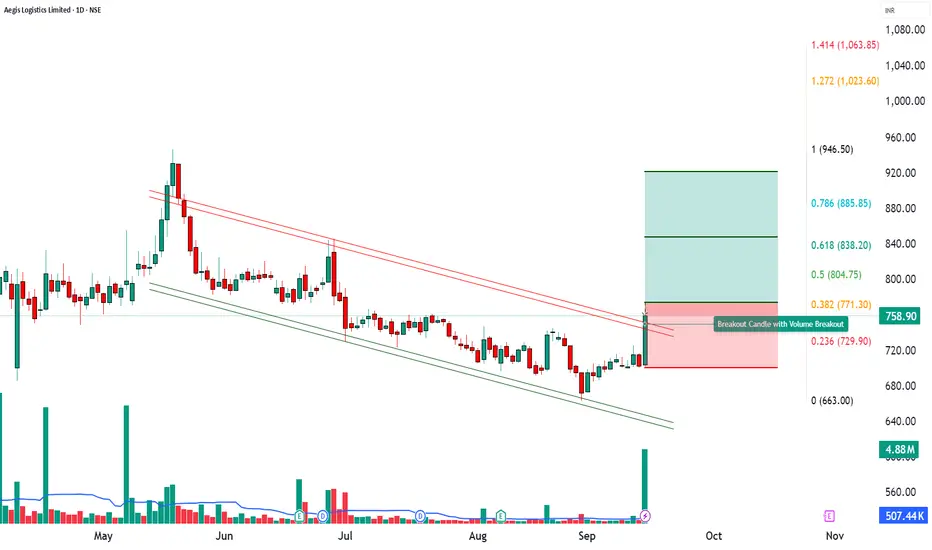
“Aegis Logistics | 20x Volume Breakout Signals Fresh Upside MomAegis Logistics Ltd (CMP: ₹758.90 | +8.07%)
🔎 Technical Outlook:
Aegis Logistics witnessed a 20-day volume breakout with an extraordinary 20X spike in price-volume activity, signaling strong market participation. The stock formed a powerful bullish candle, indicating robust momentum and accumulation interest.
The breakout above recent consolidation zones suggests the potential for a trend continuation if follow-up buying sustains.
________________________________________
📈 Key Levels:
Entry Zone: ₹774
Stop Loss: ₹700.25
Support Levels: 715.5 / 672.1 / 642.85
Resistance Levels: 788.15 / 817.4 / 860.8
Major Resistance Zone: ₹946 – ₹995
________________________________________
🎯 Upside Targets:
Target 1 → ₹847.75
Target 2 → ₹921.50
Target 3 → ₹995.25
Target 4 → ₹1,069
________________________________________
⚡ Why Bullish?
20-Day & 52-Week Volume Breakout confirmation
RSI, Stochastic & MACD supporting bullish bias on daily & weekly charts
Strong momentum candle near breakout zone
Rising interest seen from institutional volumes
________________________________________
📢 Summary:
Aegis Logistics is entering a high-momentum zone. Sustaining above ₹774 can trigger multi-level rallies toward ₹921–₹1,069 in the coming sessions. However, a dip below ₹700 will negate this bullish structure.
📰 Latest News
Aegis Logistics shares surged ~10% in a single day, driven by strong volumes. It was the stock’s highest single-day gain since March. Trading volume hit a four-month high (~31 lakh shares) much above its 20-day average. Business Today
The stock exceeded its 50-day moving average around ₹724, touching resistance zones around ₹763 to ₹772 (100- & 200-day moving averages). Business Today
Additional longer-term news: The joint-venture Aegis Vopak Terminals (AVTL) is planning a ₹2,800 crore IPO to reduce debt and fund expansion; Aegis Logistics has ~50.1% stake in that JV. The Economic Times
Also, an in-principle approval for a new LPG siding (rail facility) at Panambur (New Mangalore Port) for AEGIS Vopak was granted by Palakkad railway division. This could improve LPG logistic flows. The Times of India
📈 Investment Outlook
Aegis Logistics delivered a strong 20-day volume breakout (VolX ≈ 20x) with a sharp bullish candle. Technical momentum plus upcoming catalysts like the JV IPO and new LPG siding approval are fueling sentiment.
________________________________________
📈 Bullish Case – Why the stock could go up
High-volume breakout (20x average) signals institutional accumulation.
Momentum indicators: RSI 63, CCI 177, Stochastic 86 – still bullish.
Sustaining above ₹774 can open upside toward ₹847 – ₹921 initially, then ₹995 – ₹1069.
Positive news: JV IPO plans and LPG siding approval provide structural growth drivers.
📉 Bearish Case – Potential downside risks
Resistance near ₹788 – ₹817 may trigger profit booking.
Failure to sustain above ₹774 could lead to correction back toward ₹729 – ₹715.
Sectoral risks: energy/logistics costs, regulatory delays may hurt sentiment.
⚡ Momentum Case – Short-term Trading Edge
20x volume + bullish MACD on daily and weekly = strong near-term edge.
Bollinger Band breakout adds volatility momentum.
Holding ₹774 may fuel a rally toward ₹847 – ₹921 in 2–5 sessions.
📅 Short-term vs Long-term Perspective
Short-term (1–2 weeks): Test of ₹847–₹921 likely; supports 729–715 are critical.
Long-term (1–3 months): Sustained breakout plus IPO news flow can re-rate stock higher toward ₹995–₹1069.
________________________________________
⚠️ Disclaimer – Please Read Carefully
The information shared here is meant purely for learning and awareness. It is not a buy or sell recommendation and should not be taken as investment advice. I am not a SEBI-registered investment advisor, and all views expressed are based on personal study, chart patterns, and publicly available market data.
Trading — whether in stocks or options — carries risk. Markets can move unexpectedly, and losses can sometimes exceed the money you have invested. Past performance or past setups do not guarantee future results.
If you are a beginner, treat this as a guide to understand how the market works — practice on paper trades before risking real money. If you are experienced, always assess your own risk, position sizing, and strategy suitability before entering trades.
Consult a SEBI-registered financial advisor before making any real trading decision. By engaging with this content, you acknowledge full responsibility for your trades and investments.
💬 Found this useful?
🔼 Give this post a Boost to help more traders discover clean, structured learning.
✍️ Drop your thoughts, questions, or setups in the comments — let’s grow together!
🔁 Share with fellow traders and beginners to spread awareness.
👉 “If you liked this breakdown, follow for more clean, structured setups with discipline at the core.”
🚀 Stay Calm. Stay Clean. Trade With Patience.
Trade Smart | Learn Zones | Be Self-Reliant 📊
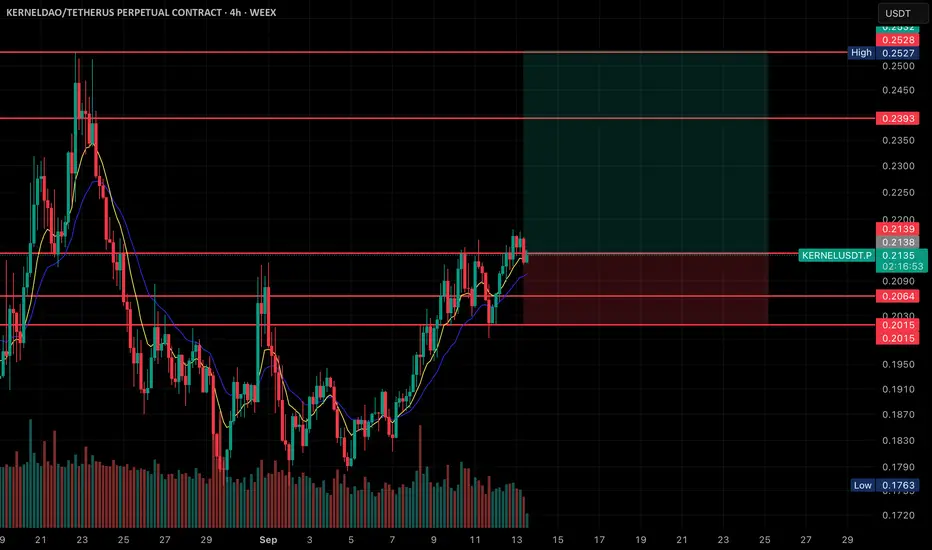
Kernel long idea• Pair/Timeframe: KERNELDAO/USDT Perpetual Contract, 4H chart (WEEX).
• Current Price: ~0.2133 USDT (slightly down −0.79%).
⸻
🔹 Market Structure:
• The price has been in a steady uptrend since early September, forming higher lows and pushing into resistance.
• Current movement shows consolidation near the 0.2139 zone, which was a previous resistance now acting as support.
⸻
🔹 Trade Setup (Highlighted Box):
• Entry Zone: Around 0.2133 – 0.2139.
• Stop-Loss: Below support levels, around 0.2040 – 0.2015.
• Target (Take-Profit): ~0.2393 – 0.2527, with the upper resistance being the main target.
• Risk-to-Reward: Favorable setup, as the potential upside is significantly higher than the defined downside.
⸻
🔹 Key Levels:
• Resistance Levels:
• 0.2139 (current breakout retest zone)
• 0.2393 (major resistance)
• 0.2527 (upper resistance / target area)
• Support Levels:
• 0.2064 (first support)
• 0.2040 (secondary support)
• 0.2015 (stop-loss zone)
• 0.1763 (major swing low)
⸻
🔹 Indicators:
• Moving averages (short-term) are aligned upward, supporting bullish continuation.
• Volume shows increased activity during the recent breakout, adding strength to the trend.
⸻
📈 Summary: The chart is showing a bullish continuation setup. As long as price holds above 0.2139 support, it has potential to rally toward 0.2393 – 0.2527. The stop-loss is well protected below 0.2040 – 0.2015.
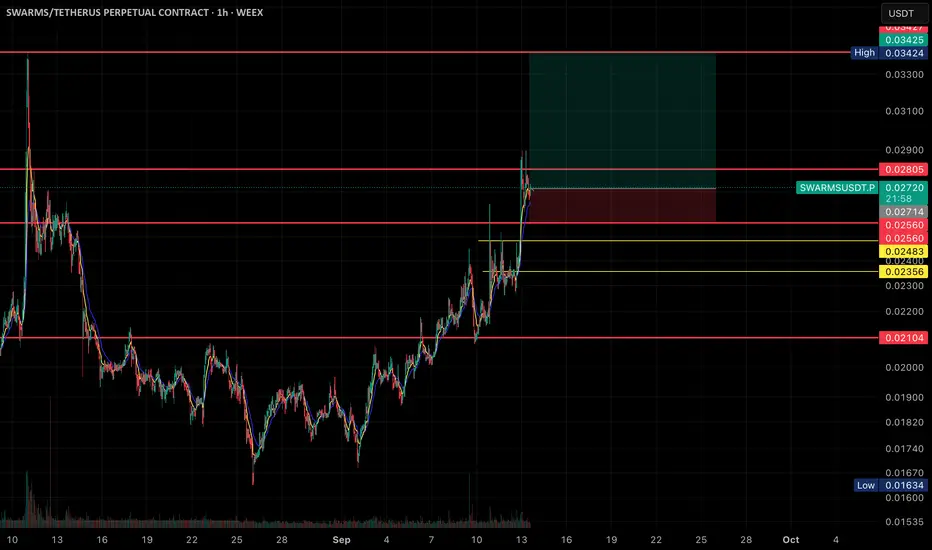
Swarms long ideaPair/Contract: SWARMS/USDT Perpetual Contract (1H timeframe, WEEX).
• Current Price: ~0.02719 USDT (+3.19%).
• Price Action:
• The chart shows a strong uptrend with higher highs and higher lows from early September.
• Price recently broke above a key resistance around 0.02714 – 0.02805, now acting as support.
• Setup:
• A long trade position is highlighted.
• Entry Zone: around current price (0.02719).
• Stop-loss: placed below the breakout zone, around 0.02560.
• Target Zone: ~0.03324 (upper resistance area).
• Support & Resistance Levels:
• Resistance: 0.02805, 0.03424.
• Supports: 0.02714, 0.02560, 0.02483, 0.02400, 0.02356, and a major support at 0.02104.
• Risk/Reward:
• The highlighted green/red box shows a favorable risk-to-reward ratio (larger upside potential vs downside).
• Indicators: Short-term moving averages are aligned upward, supporting bullish momentum.
📈 In summary: The chart is showing a bullish breakout setup where the price has pushed above resistance, with upside potential toward the 0.033+ zone, while stop-loss is set just below the breakout level.
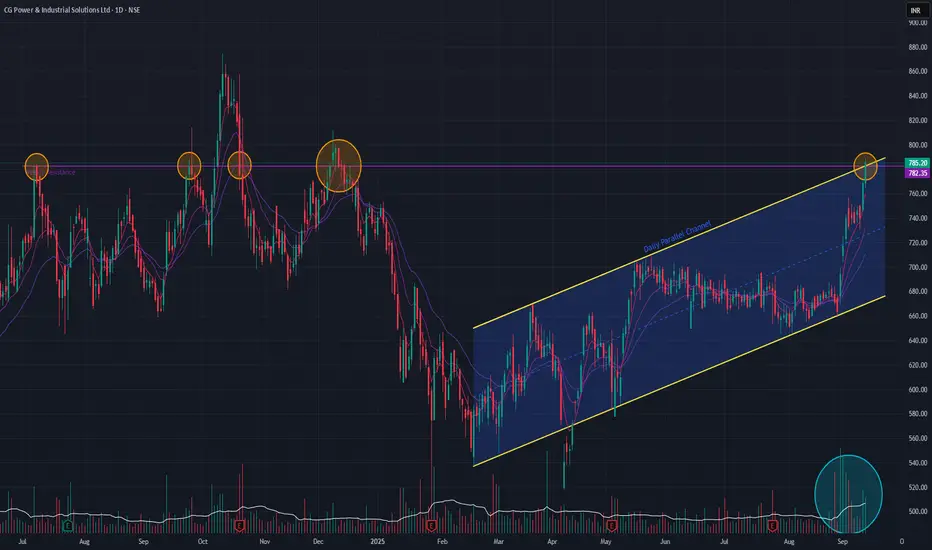
CG Power (Daily Timeframe) - Potential BreakOut CG Power has been consolidating below a major horizontal resistance line established in July 2024, which has so far prevented new all-time highs. Following a downtrend that began in October 2024, the stock has been trading within a well-defined parallel channel.
Today's price action is particularly bullish, as the stock is attempting a breakout from a confluence of resistance: the top of the parallel channel and the long-term horizontal trendline.
This significant move is supported by two key technical indicators:
The short-term EMAs are in a Positive Crossover (PCO) state.
An SMA Golden Cross occurred just a few days ago.
A sustained breakout above this confluence would be a strong signal that the uptrend is resuming.
NIFTY_MID_SELECT 1D Time frameCurrent Level: 13,022.90
Daily Range: 12,967.10 – 13,087.35
52-Week Range: 10,382.55 – 13,537.80
Technical Indicators:
RSI (14): 56.75 – positive momentum
MACD: 9.37 – upward trend
Stochastic Oscillator: 75.03 – strong bullish momentum
Rate of Change (ROC): 2.59 – confirming positive movement
Trend & Levels:
Trading above Supertrend: 13,065.50 – bullish trend
Support: ~13,000 (next support ~12,900)
Resistance: ~13,100 (next target 13,200–13,300)
Summary:
The Nifty Midcap Select Index is showing a bullish trend with strong momentum and potential for further gains if current momentum continues.

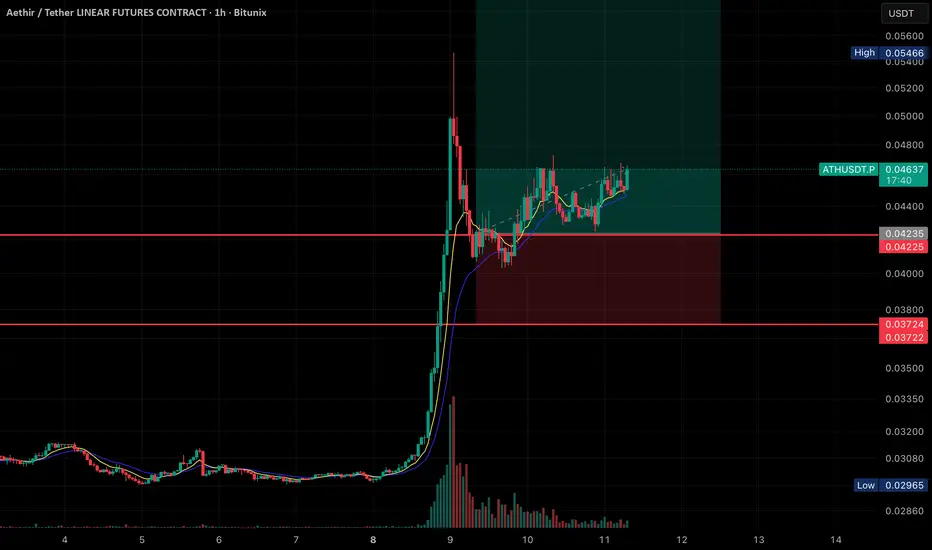
ATH/USDT Going for ATHHere’s the breakdown of what’s shown:
• Price Action:
The chart shows a massive spike in price on September 8th, followed by a retracement and consolidation phase.
Currently, the price is trading at 0.04634 USDT, with slight bullish movement (+1.58%).
• Indicators:
• Moving averages (likely EMA 9 & 21) are plotted, and the price is staying above them, showing bullish support.
• Volume spiked heavily during the breakout and has since decreased while consolidation is happening.
• Trade Setup (Highlighted Zone):
• Entry: Around the current price (0.0463 USDT).
• Stop Loss: Just below 0.0422–0.0423 support zone.
• Target Zone: Extends upward past 0.054 (previous high), indicating a long trade setup with a good risk-to-reward ratio.
• Support & Resistance:
• Support 1: 0.04225 – 0.04235
• Support 2: 0.03722 – 0.03724
• Resistance: 0.05466 (recent swing high)
👉 Overall, this looks like a bullish continuation setup after a breakout, with price consolidating in a higher range before a possible push toward the recent highs
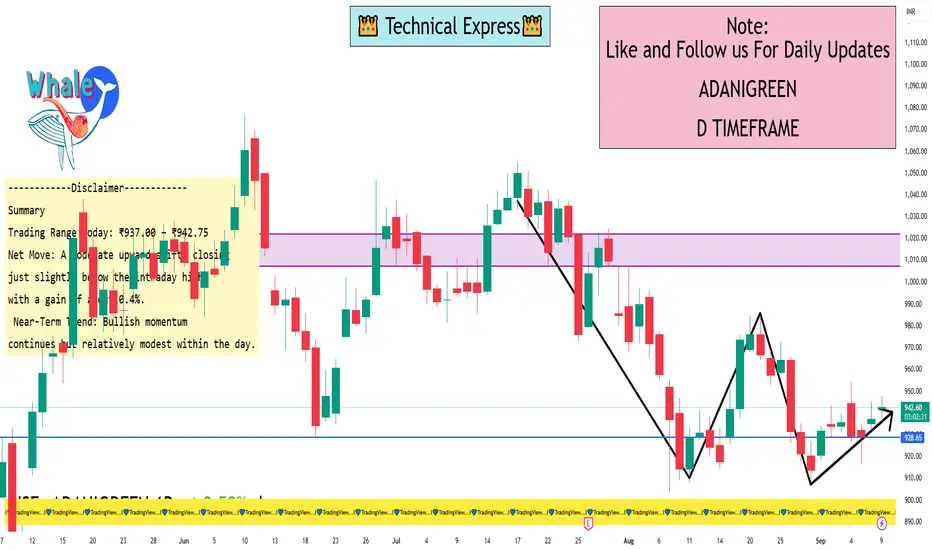
ADANIGREEN 1 Day ViewToday (September 9, 2025):
Close Price: ₹941.15
Open: ₹941.90
High: ₹942.75
Low: ₹937.00
Change: +0.42% from the previous day
Previous Day (September 8, 2025):
Close Price: ₹937.20
Open: ₹934.90
High: ₹945.00
Low: ₹931.85
Change: +0.84%
Summary
Trading Range Today: ₹937.00 – ₹942.75
Net Move: A moderate upward shift, closing just slightly below the intraday high, with a gain of about 0.4%.
Near-Term Trend: Bullish momentum continues but relatively modest within the day.
Interpretation & Trading Considerations
Short-term outlook: Slightly bullish above ₹940, but capped by resistance at ₹942–943 and the key MA200 ~₹952.
Support zone: Strong near ₹937–938—if broken, watch for potential downward move.
Momentum indicators: RSI and MACD support modest gains, but intraday technicals suggest vigilance.
Broader view: While moving averages are mostly positive, the overall technical ratings (daily/week/month) remain in the Sell zone—implying caution.
ATH GONNA MAKE ATH• Setup:
• A long position is marked with a risk/reward box.
• Entry Zone: ~0.0422 USDT (current level).
• Stop-Loss (SL): ~0.0372 – 0.0378 USDT (red zone below).
• Target (TP): ~0.0621 USDT (green box top).
• Key Levels:
• Support Zone: 0.0372 – 0.0378
• Resistance Zone: 0.0546 – 0.0560 (previous high before correction)
• Major Target: 0.0621
• Indicators:
• Price recently had a strong parabolic pump followed by a retracement.
• Now consolidating near the moving averages (yellow & blue lines), testing resistance.
• Volume shows decreasing selling pressure after the initial dump.
📌 Summary:
ATH/USDT had a sharp rally but retraced back to a support zone near 0.042. A potential bounce setup is forming if price holds this support. Upside target sits around 0.062, but a break below 0.0372 would invalidate the long setup.

SOMI 1H LONG Set upCurrent Price: Around 1.5764 USDT, trading slightly bearish (-4.51%).
• Setup:
• A long trade setup is marked with risk/reward box (green zone above, red zone below).
• Entry Zone: Around 1.56 – 1.58 USDT (current price).
• Stop-Loss (SL): Around 1.55 – 1.42 USDT (marked red levels).
• Target (TP): Around 2.50 USDT (green box top).
• Key Levels:
• Resistance 1: 1.80
• Resistance 2: 1.89 – 1.90 (previous high)
• Major Target: 2.50
• Support Zone: 1.55 – 1.42
• Indicators:
• Moving averages (short-term) are shown, price is consolidating around them.
• Volume is relatively higher before consolidation, suggesting accumulation.
📌 Summary:
This chart shows a bullish setup with a long entry around the current consolidation zone (1.56–1.58). If price holds above 1.55, potential upside target is 2.50. But if it breaks below 1.55, downside risk extends to 1.42.

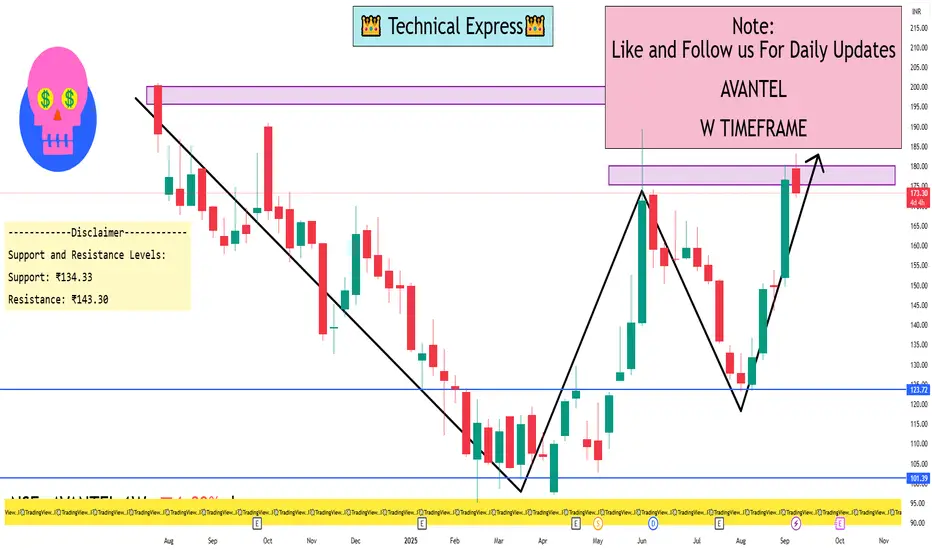
AVANTEL 1 Week ViewKey Technical Indicators:
Moving Averages: The stock is trading above its 200-day exponential moving average (EMA), indicating a long-term uptrend.
Stochastic RSI: The stochastic RSI is in the overbought zone, suggesting potential for a short-term pullback.
MACD: The Moving Average Convergence Divergence (MACD) is above the signal line, supporting the current bullish momentum.
Support and Resistance Levels:
Support: ₹134.33
Resistance: ₹143.30
Hemi 4H Bullish Play • Pair: HEMI/USDT (Perpetual Futures)
• Timeframe: 4H (4-hour chart)
• Current Price: Around 0.03724 USDT
• Price Movement:
• The price is consolidating just below a resistance zone at 0.0402 – 0.0403.
• A recent bullish push attempted to break this level but got rejected.
• The support zone is near 0.0369 – 0.0370.
• Chart Setup:
• A long position trade is set up with entry around 0.0372 USDT.
• Stop Loss: Around 0.0369 USDT (tight SL just below support).
• Target (TP): Extends upward to nearly 0.085 USDT (suggesting a high reward-to-risk ratio).
• Indicators:
• Moving averages (yellow, red, blue lines) are starting to slope upward, suggesting bullish momentum.
• Volume spikes show active trading interest around the breakout attempts.
• Observation:
• If the price breaks and sustains above 0.0403, strong bullish momentum could follow.
• If rejected again, it may retest 0.0369 – 0.0370 support.

Bearish Trade Setup for SOLUSDOverview:
This is a short position on SOLUSD, entering on the 1-hour chart with a well-defined risk-to-reward ratio. The trade is based on a downward trend confirmed by the price action and EMAs, making this a high-probability bearish scenario.
Key Levels and Indicators:
Entry Point: 186.6736
The entry is triggered when the price moves below the resistance level. This confirms the continuation of the downtrend.
Stop Loss: 202.2042
The stop loss is set above the most recent swing high to protect from any sudden price reversals. This level is designed to avoid a whipsaw and ensures the trade is kept within a reasonable risk range.
Target: 155.5356
The target is calculated based on a projected price movement in line with the current trend. Given the current market structure, this target provides an optimal reward-to-risk ratio.
Why is this a Bearish Setup?
Trend Confirmation:
The price has been consistently moving lower, showing strong bearish momentum. The EMAs (9 and 20) are also sloping downwards, reinforcing the likelihood of further downside movement.
Price Action:
The recent price action has formed lower highs and lower lows, a key indication of a strong downtrend.
EMA Alignment:
The 9-period EMA (188.6387) is below the 20-period EMA (192.3233), a classic bearish crossover that confirms the downward bias of the market.
Risk-to-Reward Setup:
The trade offers an excellent risk-to-reward ratio of approximately 1:3, which ensures that potential profits outweigh the risk taken on the trade.
Trade Management:
Entry Criteria: Enter the position when the price breaks below the support zone, ideally near the entry point.
Exit Strategy: Target is set at 155.5356, but keep an eye on the price action in case a trend reversal occurs before hitting the target. Always adjust the stop loss to lock in profits as the price moves in your favor.
Final Thoughts:
This is a well-structured bearish trade idea based on both technical analysis and price action. Always ensure that you follow proper risk management rules and adjust your stop loss or take profit levels based on market conditions.

Mina 2H LongPair: MINA/USDT Perpetual Contract
• Timeframe: 2 hours
• Current Price: ~0.1822 USDT
• Indicators:
• EMA (likely short-term, e.g., EMA 9 & 20)
• Volume profile below
⸻
🔹 Key Observations
1. Descending Trendline:
• A downward sloping resistance line is drawn from August highs.
• Price is consolidating below this line, suggesting a possible breakout attempt.
2. Support Zone:
• Strong horizontal support near 0.1810 – 0.1709 (marked in red).
• This zone has been tested multiple times, showing buyer defense.
3. Resistance Levels (Upside Targets):
• 0.1991 – first resistance after breakout.
• 0.2055 – 0.2215 – mid-range resistance cluster.
• 0.2365 – major resistance zone.
• 0.2950 – 0.3126 – extended upside target area.
4. Trade Setup (Highlighted Box):
• Entry: Around 0.1822 (current price).
• Stop-loss: Below 0.1570 (strong support breakdown).
• Take-Profit (TP): Staged at resistance zones up to ~0.2950.
5. Risk/Reward:
• Favorable R:R as the stop is tight compared to higher upside potential.
⸻
🔹 Bias
• Bullish Setup: If price breaks above the descending trendline and holds above 0.1900–0.1990, it could trigger a rally toward 0.22 → 0.2365 → 0.29.
• Bearish Risk: If 0.1709 – 0.1570 breaks, the next downside level is around 0.1450 (previous low).

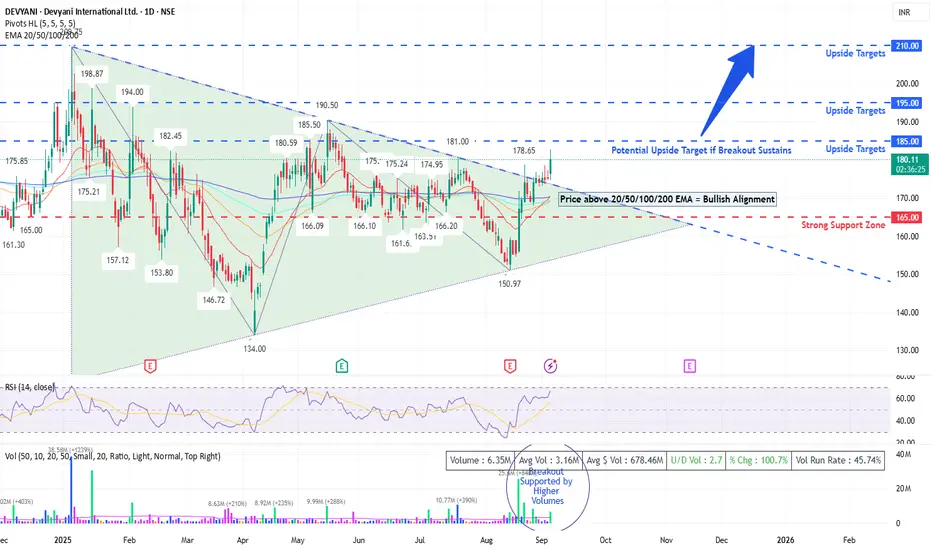
DEVYANI - TRINGLE BREAKOUTDevyani Intl – Triangle Breakout Loading? 🚀
📊 Stock Analysis: Devyani International Ltd (NSE: DEYANI)
🔹 Technical Overview
Pattern: Symmetrical Triangle breakout attempt visible on daily charts. Price has tested the upper resistance trendline multiple times (₹190–₹195 zone) and is now trading above short-term EMAs.
Key Support Levels : ₹165, ₹150
Immediate Resistance Levels: ₹185, ₹195 (major breakout zone)
Indicators:
RSI (14): 66.5 → Positive momentum, but near overbought levels.
EMA Cluster (20/50/100/200): Price trading above all key EMAs – strong short-term bullish signal.
Volume: Breakout supported with above-average volumes (5.3M vs 3.1M avg).
➡️ A sustained close above ₹185–₹190 could trigger a rally towards ₹200–₹210.
🔹 Fundamental Snapshot
Business Model: Devyani International Ltd is the largest franchisee of Yum! Brands in India, operating KFC, Pizza Hut, and Costa Coffee.
Growth Drivers:
Rapid store expansions (targeting Tier II/III cities).
Rising QSR demand in India with improving urban disposable income.
Long-term industry tailwinds in organized food retail.
Risks:
Margin pressures due to inflation in raw materials.
Intense competition in QSR space (Domino’s, McDonald’s, Burger King).
High dependence on discretionary consumer spending.
🔹 Trading Strategy
Short-Term (1–3 weeks): Buy on dips near ₹170–₹175, SL below ₹165. Target: ₹190 / ₹200.
Medium-Term (2–3 months): If breakout above ₹195 holds with volume, positional target can be ₹220+.
Risk Management: Keep SL below triangle support (₹160) for positional trades.
🔹 Sentiment & Outlook
📈 With improving consumer demand and strong expansion plans, Devyani remains a long-term growth story in India’s QSR sector. Current technical setup indicates a potential breakout rally if momentum sustains above ₹185–₹190.
⚡ Conclusion:
👉 Stock is at a make-or-break zone. Sustained move above ₹190 could unlock fresh highs, while failure may keep it in consolidation within the triangle.
RLC going goodPrice was consolidating below a descending trendline (blue). It has now broken above it with momentum, suggesting a bullish breakout.
• Entry Zone:
Current price is around 1.3480 USDT after reclaiming the breakout area. The long entry zone starts above this breakout.
• Stop-Loss Zone (Red Area):
Placed below 1.3100 – 1.2500 USDT, with deeper support around 1.1770. This covers previous consolidation lows, protecting against false breakouts.
• Target Zone (Green Area):
The first target is around 1.4085 USDT (near resistance).
The major target is 1.6296 USDT, extending up toward 1.72 USDT (previous highs).
• Risk-to-Reward (RR):
The setup looks to be a high RR trade, aiming for more than 2–3x reward compared to the risk zone.
• Indicators:
Short EMA (yellow) has crossed above the longer MA (blue), confirming bullish momentum. Volume has also picked up on the breakout, which strengthens the setup.
👉 Overall: This is a bullish breakout trade with stop-loss protection below recent supports and upside targets toward 1.62–1.72 if momentum continues.

Yatharth Hospital & Trauma Care Services Ltd. 4 Hour View4-Hour Time-Frame View – Technical Snapshot
While many platforms don’t provide a dedicated 4-hour technical summary, we can still glean insights from related intraday data—particularly from platforms like Investing.com (5-hour view) and TopStockResearch’s 4-hour-specific metrics.
Investing.com (5-Hour, closest available proxy)
Technical Summary (5-Hour): Strong Buy
Overall Summary (5 Hrs → Strong Buy) indicates strong upward momentum even over shorter intraday frames
TopStockResearch (4-Hour TSR Strength Index)
This platform provides a more granular “4-Hour” breakdown:
TSR Strength Index: Strong Bullish — YATHARTH is more bullish than 97–98% of stocks
Indicators:
RSI: ~69–70 → Buy
MACD: ~20 → Buy
ADX: ~36 → Buy
Stochastic: ~42 → (Neutral or Buy range)
ROC: ~4–5 → Buy
Supertrend: ~647 → indicating upward trend
Williams %R: Slightly negative (near overbought region)
CMF (Chaikin Money Flow): Positive (~0.13) → Buying pressure
PSAR: ~674
These inputs together reinforce a strong bullish bias over the 4-hour window
Pivot Levels (Intraday / 4-Hour Range)
TopStockResearch provides intraday pivot level analysis:
Current Price (~₹749) is trading above all primary resistance levels—including R3 (Classic), Camarilla R4, Fibonacci R3, Woodie’s R2, and DeMark R1, signaling a robust intraday breakout
