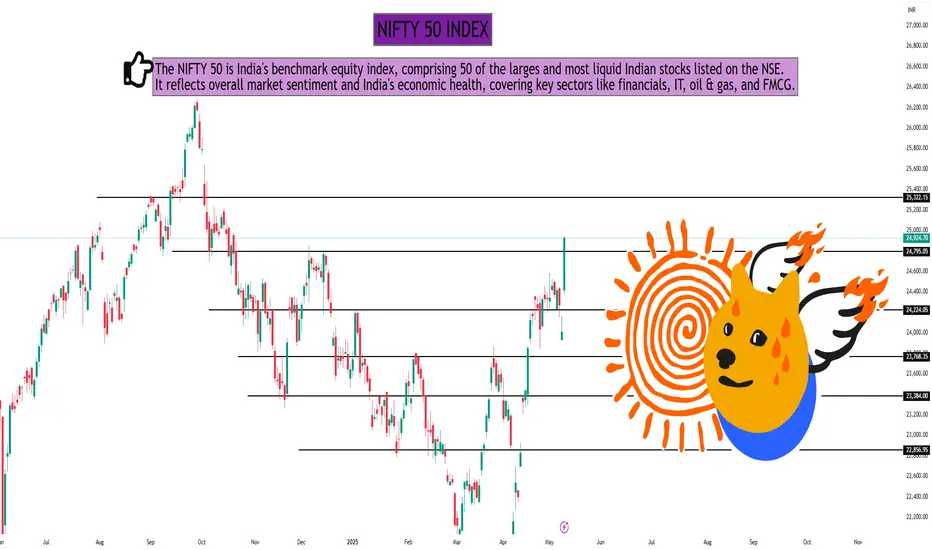
NIFTY 50 INDEX NIFTY 50 Index – 1-Day Timeframe Analysis
Technical Structure:
Trend: Uptrend intact; recent candles show strong bullish momentum.
Price Action: Forming higher highs; currently trading near resistance.
Support Levels: 22,500 / 22,200
Resistance Levels: 22,850 / 23,000
Indicators:
RSI: Around 68 – nearing overbought but still bullish
MACD: Positive crossover sustained
Volume: Rising on green candles – confirms buying interest
Outlook:
If NIFTY sustains above 22,850, a breakout toward 23,200 is likely. A rejection could lead to short-term pullback toward 22,500 support.
Search in ideas for "INDICATORS"
XAUUSD ( Gold/USD ) - Swing and Possitional Research Report.🟡 XAUUSD (Gold/USD) – Swing & Positional Trading Research Report
📅 Date: 12 May 2025
💰 CMP: 3279.000
📉 Bias: Bullish → Buy on dips
📊 Trend: Uptrend with short-term correction
📆 Time Frames Used: 4H, Daily, Weekly
🔍 Market Overview
Gold is currently trading near a key **Fibonacci retracement zone** of the previous impulse wave from **3170 to 3365**. The market has pulled back from highs, offering a swing and positional entry opportunity.
🔩 Technical Structure & Analysis
| Resistance 3365 Recent Swing High
| Resistance 3310 Minor Hurdle (supply)
| Support 3270–3250 Fib 38.2–50% Zone
| Support 3225 Swing Structure Support
| Strong Support 3190 Weekly Support – Invalidates Positional Bull Case
Indicators:
* RSI (D1): \~54 → Neutral, not overbought
* MACD (D1)**: Still positive, but flattening
* 200 EMA (D1)**: \~3100 → Strong uptrend confirmed
🎯 Swing Trade Setup (1–10 Days)
* Buy Zone: 3275–3250
* Stop Loss: 3235
* Target 1: 3310
* Target 2: 3365
* Target 3: 3400
* Risk–Reward: 1:2.5+
📝 Entry can be layered, SL to be trailed above 3310 once hit.
🚀 Positional Trade Setup (2–6 Weeks)
* Accumulation Range: 3275–3225
* Stop Loss (Weekly Close): 3190
* Target 1: 3400
* Target 2: 3520
* Target 3: 3675
* Bonus Target: 3820 (if global risk-off accelerates)
📌 *Macro tailwinds such as potential Fed easing, geopolitical tensions, or inflation worries continue to support medium-term upside in gold.*
⚠️ Risk Factors to Watch
* Unexpected Fed hawkish stance
* Strong USD rebound (watch DXY)
* Positive surprise in U.S. CPI data

Daily Market Update - 09-05-2025Daily Market Update - May 9, 2025
Updated: 08:45
Expected Opening: 23900++
Indian Stock Market
• BSE Sensex: Closed at 80,334.81, down 412 points (-0.51%) on May 8, 2025, amid rising India-Pakistan geopolitical tensions.
• Nifty 50: Ended at 24,273.80, down 141 points (-0.58%) on May 8, 2025, with volatility driven by selling in banking, FMCG, and auto sectors.
• Sector Performance (May 8, 2025):
• Losers: Nifty Metal (-2.09%), Healthcare (-1.95%), Auto (-1.90%), PSU Bank, Oil & Gas, Pharma, Consumer Durables, and Realty (down 1-2%).
• Gainers: Nifty IT and Media showed modest gains.
• Top Nifty Losers: Shriram Finance, Eternal, M&M, Tata Consumer, Adani Enterprises.
• Top Nifty Gainers: HCL Technologies, Kotak Mahindra Bank, Titan Company, Axis Bank, Coal India.
• Broader Indices: BSE Midcap (-1.90%) and Smallcap (-1.05%) underperformed.
• Market Sentiment: Escalating tensions with Pakistan, particularly after India’s military actions on May 7-8, 2025, targeting terror sites and foiling Pakistani drone/missile attacks, weighed heavily on markets. However, experts suggest market impact may be temporary unless trade routes or economic centers are disrupted.
• FII Activity: Foreign Institutional Investors bought equities worth ₹2,585.86 crore on May 7, 2025.
• Gift Nifty: Trading around 23,970.50 (-0.91%) as of May 9, 2025, indicating a weak opening for Indian markets.
Global Markets
• US Markets (May 8, 2025):
• Dow Jones Futures: 41,345.01 (-0.06%).
• S&P 500: 5,663.94 (+0.58%).
• Nasdaq: 17,928.14 (+1.07%).
• SPY (S&P 500 ETF): Closed at $565.06 (+0.70% from previous close of $561.15) with a daily high of $570.292 and low of $561.387.FinancialData
• Gift Nifty: 23,970.50 (-0.91%).
• Nikkei: Specific data unavailable, but Asian markets trading mixed.
• US Market Context: The U.S. Federal Reserve maintained interest rates at 4.25%–4.5% in its May 2025 meeting, amid tariff hike uncertainties and mixed economic signals.
Key Highlights
• Geopolitical Tensions: India’s “Operation Sindoor” on May 7, 2025, targeting terror camps in Pakistan, and Pakistan’s failed drone/missile attacks on May 7-8, 2025, have heightened market volatility. Markets showed resilience on May 7 but fell on May 8 due to profit booking and cautious sentiment.
• Corporate Updates:
• Larsen & Toubro (L&T): Reported a 25% YoY rise in Q4 FY25 net profit to ₹5,497 crore, with revenue up 11% to ₹74,392 crore. Recommended a final dividend of ₹34 per share.
• Bajaj Consumer Care: Reported a 13% decline in Q4 FY25 net profit to ₹30.98 crore.
• IPO News: Chennai-based Manoj Jewellers’ ₹16.20 crore SME IPO opened on May 5, 2025, offering 30 lakh shares at ₹54 each.
• Economic Indicators: India’s consumer price inflation hit a 67-month low of 3.34% in March 2025, potentially lowering FY26 CPI forecasts below 4%.
Outlook
• Indian markets may open lower on May 9, 2025, as indicated by Gift Nifty’s decline. Investors are likely to remain cautious due to ongoing India-Pakistan tensions, though analysts expect any market impact to be short-lived unless escalation affects trade or economic hubs.
• Globally, stable US markets and mixed Asian cues suggest cautious optimism, but tariff concerns and geopolitical developments will remain key drivers.

Grindwell Norton - Powerful RetestNSE:GRINDWELL Made Beautiful Chart Structure today before Q4 Results with Good Price and Volume action.
Price Action Analysis:
Base Formation and Breakout: a critical technical development with today's powerful price surge:
1. Base Structure: Grindwell Norton formed a well-defined horizontal base in the ₹1,750-1,800 range (highlighted in green), which has served as strong resistance since January 2025. This level has been tested multiple times and rejected, creating a clear technical ceiling.
2. Today's Retest: With a massive 14.67% gain, the stock has finally retested through this stubborn resistance zone after multiple failed attempts. This represents a significant technical event after approximately 4 months of price struggle at this level with Volumes.
3. Prior Downtrend Context: The Retest is especially meaningful as it comes after a prolonged downtrend from the ₹2,300 level in late 2024, indicating a potential trend reversal.
Volume Analysis:
The volume characteristics strongly support the Retest breakout's validity:
- Today's volume at 79.44K shares is substantially higher than normal trading activity
- The volume spike (visible as a large green bar at the bottom) coincides perfectly with the price breakout
- Prior resistance tests showed diminishing volume, indicating sellers were becoming exhausted
- The volume pattern shows classic accumulation characteristics before the breakout
Key Support and Resistance Levels:
Key Resistance Levels
1. Immediate Resistance: ₹1,900-1,950 (prior consolidation zone)
2. Intermediate Resistance: ₹2,100 (previous reaction high)
3. Major Resistance: ₹2,300 (52-week high)
Key Support Levels
1. New Support: ₹1,750-1,800 (previous resistance may likely to act as support - this is critical)
2. Secondary Support: ₹1,550-1,600 (consolidation zone from April)
3. Strong Support: ₹1,400 (major reaction low from February/March)
Technical Pattern Recognition:
The chart demonstrates a classic "break and retest" pattern:
- Initial drop below the ₹1,800 level in early 2025
- Multiple attempts to reclaim this level
- Extended period of base-building and consolidation
- Final powerful Retest on exceptional volume
This pattern often precedes sustained upward movements, particularly when the Retest breakout occurs on high volume, as seen today.
Accumulation Indicators:
Several signs of institutional accumulation appear in the chart:
- Increasing volume on up days versus declining volume on down days
- Formation of higher lows since the March bottom
- Clear volume divergence during the April-May consolidation phase
- Today's massive volume spike suggests strong institutional buying
Technical Outlook:
The combination of a decisive breakout from a multi-month base coupled with exceptional volume support suggests the potential for continued upward momentum. The prior resistance level at ₹1,750-1,800 should now function as support in any pullbacks.
Traders should closely monitor whether the stock can maintain positions above the breakout level in subsequent sessions, as this will confirm the pattern's validity and potential for a new uptrend toward the ₹2,000-2,100 range.
Keep in the Watchlist and on your Radar.
NO RECO. For Buy/Sell.
📌Thank you for exploring my idea! I hope you found it valuable.
🙏FLLOW for more
👍BOOST if useful
✍️COMMENT below with your views.
Meanwhile, check out my other stock ideas on the right side until this trade is activated. I would love your feedback.
Disclaimer: "I am not SEBI REGISTERED RESEARCH ANALYST AND INVESTMENT ADVISER."
This analysis is intended solely for informational and educational purposes and should not be interpreted as financial advice. It is advisable to consult a qualified financial advisor or conduct thorough research before making investment decisions.

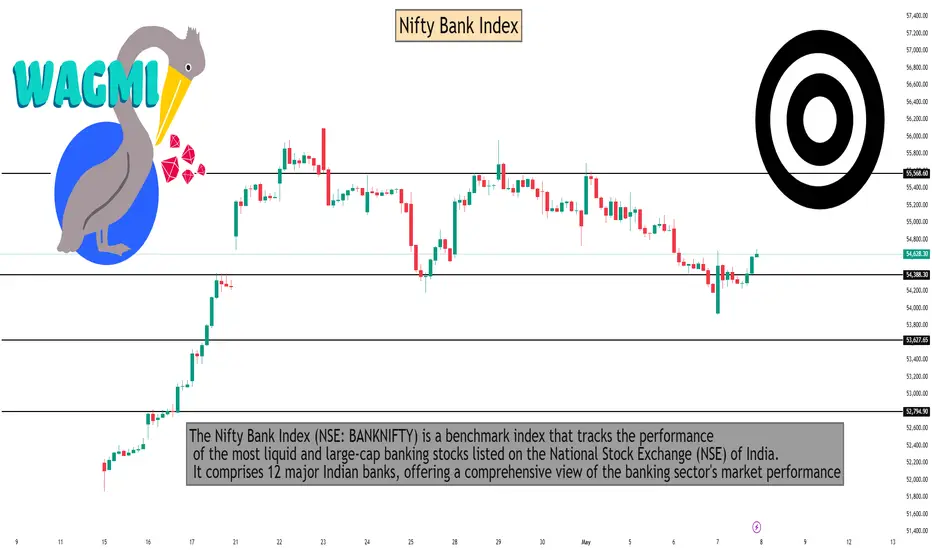
Nifty Bank Index As of May 8, 2025, here are the key intraday support and resistance levels for the Nifty Bank Index (BANKNIFTY), based on various pivot point calculations:
📊 Intraday Support & Resistance Levels
Pivot Type Support Levels Resistance Levels
Classic S1: 54,125.76S2: 53,640.63S3: 53,361.36 R1: 54,890.16R2: 55,169.43R3: 55,654.56
Fibonacci S1: 54,113.03S2: 53,932.63S3: 53,640.63 R1: 54,697.03R2: 54,877.43R3: 55,169.43
Camarilla S1: 54,540.83S2: 54,470.76S3: 54,400.69 R1: 54,680.97R2: 54,751.04R3: 54,821.11
Woodie S1: 54,228.70S2: 53,692.10 R1: 54,993.10R2: 55,220.90
Demark S1: 54,265.40 R1: 55,029.80
Note: The central pivot point (PP) across these methods is approximately 54,405.03.h
🔍 Observations
Immediate Support: The 54,000–54,200 range is a crucial support zone. A breach below this could indicate a bearish trend.
Immediate Resistance: The 54,800–55,200 range serves as a significant resistance area. Sustained trading above this may suggest bullish momentum.
Technical Indicators: The Relative Strength Index (RSI) for Nifty Bank is currently in the neutral zone (45–55), indicating a balanced market without a clear bullish or bearish bias.
📈 Trading Strategy Tips
Bullish Scenario: If the index maintains levels above 54,800, it may target the 55,200–55,650 range.
Bearish Scenario: A drop below 54,000 could lead to further declines toward 53,600 or lower.
Neutral/Bounce Zone: The area between 54,400 and 54,700 is pivotal. Monitoring price action here can provide insights into potential breakouts or reversals
“Positional Swing Volume Breakout: A Strategic Trade Setup” Poly Medicure Ltd. on the NSE (POLYMED)
>>>Stock Price: The latest closing price is ₹2,882.70 , reflecting a 15.50% increase.
>>>High/Low: The stock hit a high of ₹2,919.80 and a low of ₹2,495.60 within the observed period.
>>>Trading Indicators: The Stochastic indicator is showing values 96.23 and 89.66, suggesting strong momentum.
>>>Exponential Moving Average (EMA): The 20-day EMA is at ₹2,409.40.
>>>Trading Volume: The 20-day trading volume is 2.58M shares.
>>>Market Cap: The company’s market capitalization is ₹769.73K INR.

Master Trust Ltd (NSE) - 1D ChartMaster Trust Ltd. (NSE) - 1D Chart | Breakout or Fakeout?
• Pattern: The stock has broken above the descending trendline, but it is facing strong resistance at ₹137.80.
• Volume: Noticeable increase in buying volume, indicating bullish interest.
• Indicators:
• RSI: Currently at 54.09, showing improving momentum but still near neutral levels.
• Price Action: The stock is testing the breakout level, and confirmation is needed.
📌 Key Levels:
🟢 Support: ₹105.78 (major demand zone)
🔴 Resistance: ₹137.80 (strong supply zone)
• Outlook:
• If the price sustains above ₹137.80, we could see further upside.
• If it rejects from here, a retest of the ₹126-₹120 range is possible before another move.
🚨 Not financial advice. Do your own research before trading. 🚨

Asian Paints: A Blue-Chip Opportunity at 3-Year LowsAsian Paints, a stalwart in the Indian Paint market, has dropped to ₹2,300, marking a three-year low. Amidst this decline, the stock exhibits noteworthy indicators:
1. **Relative Strength Index (RSI)**: Currently below 50, signaling potential oversold territory.
2. **Price-to-Earnings Ratio (P/E)**: Historically low at <46, presenting a rare valuation opportunity.
Here’s why I believe this is an attractive long-term investment:
1. **Attractive Dividend Yield**: At the current price, the dividend yield is 1.46%, offering a steady income stream.
2. **Robust Financial Health**: The company boasts negligible debt, ensuring financial stability.
3. **Strong Reserves**: Asian Paints has a reserve of ₹17,928 crore, a solid buffer for future growth.
4. **Cash Flow Strength**: With a cash generation of ₹6,104 crore, the company has ample liquidity for operations and expansion.
5. **Growth-Oriented Investments**: The company is investing ₹2,500 crore in fixed assets, underscoring its focus on long-term growth.
As Warren Buffett says, *"Be fearful when others are greedy, and greedy when others are fearful."* This downturn may present a strategic buying opportunity for patient investors.
---
**Disclaimer**
1. Perform your own analysis or consult a financial advisor before investing.
2. This investment may require a long horizon to yield significant returns.

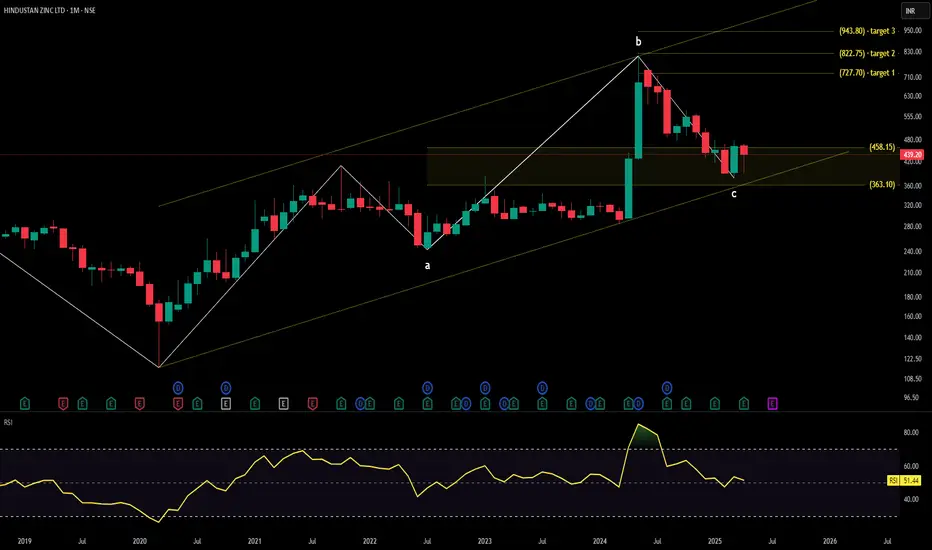
HINDUSTAN ZINC technical analysisHindustan Zinc Ltd. (NSE: HINDZINC) is currently trading at INR 439.20. The company is a leading producer of zinc, lead, and silver in India and operates as a subsidiary of Vedanta Limited.
Key Levels:
Support Level: INR 368 - 458
Swing Level: INR 542
Possible Upside Levels: INR 727.70, INR 822.75, INR 943.80
Technical Indicators:
RSI (Relative Strength Index): The RSI is currently at 51.44, indicating a neutral position. RSI is a momentum oscillator that measures the speed and change of price movements.
Volume: The volume for the current period is 38.99 million. Volume represents the number of shares traded in a given period. High volume can indicate strong investor interest and potential price movement, while low volume can suggest a lack of interest and possible price stagnation.
Sector and Market Context:
Hindustan Zinc Ltd. operates in the metals and mining sector, which has been experiencing volatility due to fluctuating commodity prices and global economic conditions. The overall market trend has been influenced by factors such as inflation, interest rate changes, and geopolitical events. Within its sector, Hindustan Zinc Ltd. has demonstrated resilience due to its strong market position and diversified product portfolio.
Risk Considerations:
Commodity Price Fluctuations: The prices of zinc, lead, and silver can be highly volatile, impacting the company's revenue and profitability.
Regulatory Changes: Environmental regulations and mining policies can affect the company's operations and costs.
Global Economic Conditions: Economic slowdowns or recessions can reduce demand for industrial metals, negatively impacting the company's performance.
Currency Exchange Rates: As an exporter, the company is exposed to currency exchange rate fluctuations, which can affect its earnings.
Analysis Summary:
Hindustan Zinc Ltd. has shown stable performance. The RSI indicates a neutral position, suggesting that the stock is neither overbought nor oversold. The volume suggests moderate investor interest. While the company is well-positioned in the metals and mining sector, potential risks such as commodity price fluctuations and regulatory changes should be considered. Investors should monitor these factors closely and evaluate the overall market context before making investment decisions.
#MAHEPC Price Overview:
Current Price: ₹141.72
Week's High/Low: ₹148.50 / ₹138.10
Change: +2.01% this week
Chart Type: Weekly candlestick
🔍 Technical Breakdown:
1. Price Structure & Trend:
Strong breakout from the ₹130–132 range recently.
Faced rejection near ₹159.75 (recent top), forming a red candle last week.
This week shows a green candle holding support near ₹138, indicating buyers stepped in.
2. Key Support Zones:
₹142.45 – immediate overhead resistance (needs to close above for bullish continuation).
₹130.25 – recent breakout level; strong support.
₹119 / ₹110 – intermediate supports if correction deepens.
₹107.55 – last swing low before breakout.
₹96.5 – major bottom formed in Jan 2025.
3. Momentum Indicators:
Daily (D): 97.99 — strong positive.
Weekly (W): 138.33 — very bullish.
Monthly (M): 84.44 — strongly positive.

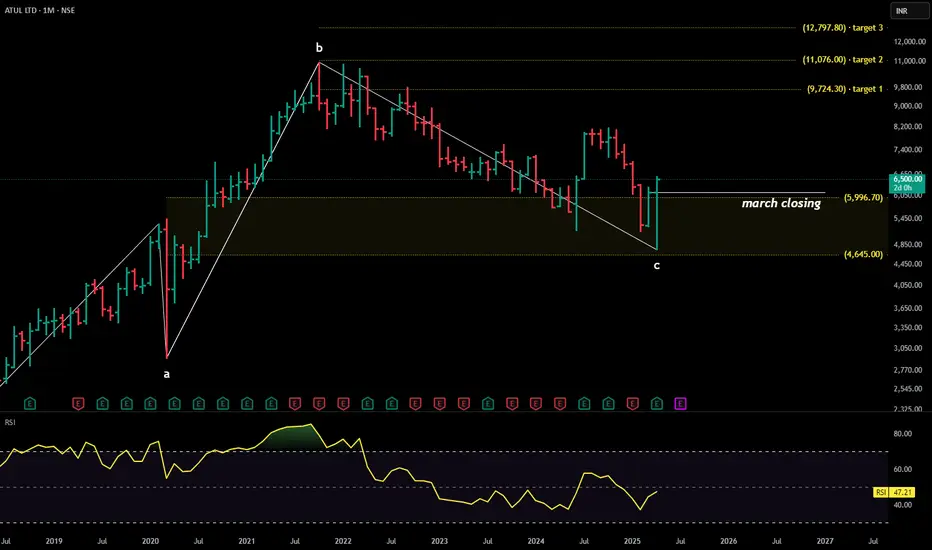
ATUL technical analysisStock Overview: ATUL LTD, listed on the NSE, is currently priced at INR 6,500.00. The company specializes in manufacturing chemicals across diversified industries such as agriculture, pharmaceuticals, and textiles, with a strong focus on innovative solutions.
Key Levels:
Support: 4,645 - 5,996
Upside swing zone: 6219 - 7126
Possible upside levels: 9724, 11076, 12979
Technical Indicators:
RSI (Relative Strength Index): At 47.21, the RSI shows a neutral momentum, indicating that the stock is neither overbought nor oversold. This suggests balanced sentiment without immediate direction bias.
Volume: The current trading volume stands at 3.33M, demonstrating a notable surge compared to previous levels.
Sector and Market Context: ATUL LTD operates in the chemical sector, which has exhibited steady growth amid economic uncertainties, benefiting from surging demand in industries like pharmaceuticals and agriculture. The company's diversified product portfolio positions it well to tap into such growing markets. However, broader market trends are mixed, with global geopolitical tensions and supply chain challenges influencing sector stability. Despite these factors, ATUL LTD has maintained a consistent performance trajectory, leveraging strong fundamentals and market adaptability.
Risk Considerations:
Sector-Specific Risks: Fluctuations in raw material costs and stringent regulatory changes could impact profitability.
Company-Specific Risks: Operational inefficiencies, competitive pressures, and management decisions remain key considerations affecting stock performance.
Analysis Summary: ATUL LTD presents an intriguing case in the chemical sector with well-defined support and upside levels, signaling a balanced technical setup. While the broader chemical sector and market trends provide room for optimism, investors should carefully evaluate potential risks, including regulatory changes and market conditions.
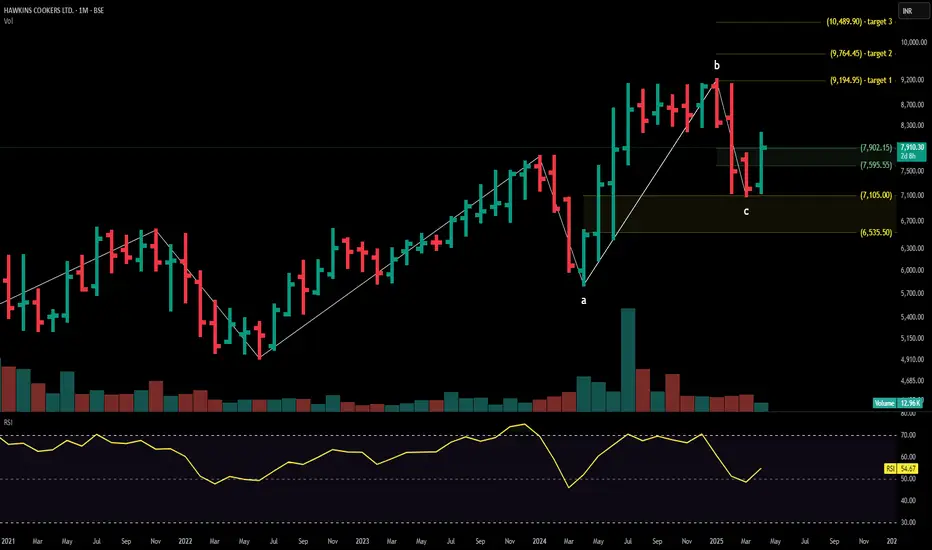
HAWKINS technical analysisStock Overview: Hawkins Cookers Ltd., BSE, current price: ₹7,910.30. Hawkins Cookers Ltd. is a trusted manufacturer of high-quality pressure cookers and cookware, catering to the growing needs of domestic and international markets.
Key Levels:
Support levels: ₹6,535.50, ₹7,105.00
Upside swing zone: ₹7,595.55, ₹7,902.15
Possible upside levels: ₹9,194.95, ₹9,764.45, ₹10,489.90
Technical Indicators:
RSI (Relative Strength Index): The current RSI is at 54.67, indicating a neutral momentum.
Volume: The trading volume is 12.96K, reflecting stable investor activity.
Sector and Market Context: Hawkins Cookers Ltd. operates in the consumer goods sector, particularly in the kitchen appliances niche. This sector has demonstrated resilience, buoyed by increasing urbanization, rising consumer income, and demand for quality appliances. The stock's performance aligns with the sector's growth trajectory, which is positively influenced by innovation and expanding distribution networks. However, the broader market trends remain cautious due to macroeconomic uncertainties and inflationary pressures, with selective recovery across various industries.
Risk Considerations:
Competition: The presence of other strong players in the kitchen appliances industry may impact market share.
Supply Chain Factors: Delays or rising costs in raw materials and logistics could affect production efficiency and margins.
Regulatory Environment: Changes in policies or taxation could create operational challenges for the company.
Analysis Summary: Hawkins Cookers Ltd. demonstrates a steady outlook. The consumer goods sector’s overall growth prospects align favorably with the company’s performance, although potential risks like market volatility, competition, and supply chain disruptions should not be overlooked. Investors may find Hawkins Cookers Ltd. a reliable candidate for monitoring, with room for steady performance subject to market dynamics and sectoral developments.
#CNXITMassive Rebound: This week, Nifty IT posted a very strong gain of +6.56%, showing strong bullish momentum after weeks of selling.
Current Level: It closed at 35,562.25, slightly above the intermediate support/resistance level of 33,520.65.
Resistance Zone: Immediate resistance lies between 36,539 – 36,892. Clearing this zone will be crucial for continued upside.
Momentum Indicators:
Daily (D): Slightly negative (-6.4) but improving.
Weekly (W): Still quite weak (-144.23) but seems to be bottoming out.
Monthly (M): Fairly neutral (47.93).
Short-Term View: There's some room for further upside, but once near 36,500–36,900, expect some consolidation or pullback unless there's strong follow-through buying.

"Plan the Short: DXY Targeting 98.004 "2. Current Price:
Around 99.587 💵
3. Indicators:
EMA 70 (Exponential Moving Average) ➡️ 99.442 📈
Price is dancing around the EMA, meaning trend is a bit bullish for now.
4. Chart Pattern:
Price moving inside an ascending channel 📈➰
Bouncing between channel support and resistance levels ⚡
5. Trading Plan:
Wait for price to reach the blue resistance zone ⬛ (around 100.5 to 100.9)
Look for sell (short) signals after reaching there ⛔
Expecting a reversal and drop down to target 98.004 🎯
6. Stop Loss & Target:
STOP LOSS: 🔴 100.870 (above resistance zone)
TARGET: 🎯 98.004
7. Key Observations:
Current Trend: Short-term bullish 📈 inside channel
Expected Move: Reach blue box ➡️ sell ➡️ fall toward 98.004 📉
News Events: Upcoming 📅🔔 (could create volatility)
Summary:
* 📈 Uptrend inside a channel.
* ⬛ Wait for price to hit the blue zone (100.5–100.9).
* ⛔ Look for short signals in the zone.
* 🔴 Stop Loss: 100.870.
* 🎯 Target: 98.004.
* ⚡ Watch out for news events that can move the market!

GBP/CAD Bullish Reversal Setup – Demand Zone PlaybookBias: Bullish 📈
Key Zones & Levels:
🔵 Demand Zone:
* Area: 1.83024 - 1.83527
* Role: Strong support where buyers previously entered
✅ Entry Point:
* 1.83527
* Right above the demand zone — wait for price to retrace here
🛑 Stop Loss:
* 1.83024
* Below demand zone — protects against a breakdown
🎯 Target Point:
* 1.85280
* Upper resistance level — offers ~3:1 reward-to-risk ratio.
Structure & Indicators:
📏 Bullish Flag/Channel:
* Price is consolidating inside a small ascending channel
* Orange arrow suggests potential drop to demand zone before rising
🧭 EMA (7-period):
* Currently at 1.84020
* Price above EMA = short-term uptrend still intact.
Trade Plan:
1. ✨ Wait for price to dip into the demand zone
2. 🕵️♂️ Look for bullish signals (candlestick patterns or bounce)
3. ✅ Enter around 1.83527
4. 🛑 Stop loss at 1.83024
5. 🎯 Target 1.85280

CASTROL technical analysisStock Overview: Castrol India Ltd, NSE, current price: INR 202.98. Castrol India Ltd is a prominent player in the manufacturing and marketing of automotive and industrial lubricants, greases, and related products, with a strong presence in the automotive sector.
Key Levels:
Support levels: INR 191.34, INR 169.85, INR 138.71.
Upside swing zone: INR 209.13.
Possible upside levels: INR 277.15, INR 308.30, INR 347.95.
Technical Indicators:
RSI (Relative Strength Index): The RSI is currently at 54.44, indicating a neutral stance. This suggests that the stock is neither overbought nor oversold, reflecting balanced momentum. Typically, RSI above 70 suggests overbought conditions, while below 30 indicates oversold zones.
Volume: The trading volume stands at 84.45M, showcasing active investor participation. Higher peaks in trading volume highlight periods of heightened investor interest, which may signal forthcoming price volatility or pivotal movements.
Sector and Market Context: Operating in the lubricants industry, Castrol India Ltd’s performance is closely tied to automotive production and industrial activity. The automotive sector, being sensitive to consumer demand, technological shifts, and regulatory influences, is currently witnessing a mix of recovery and innovation trends. The overall market reflects a cautious optimism, with moderate growth visible in some segments despite macroeconomic headwinds. Castrol's position as a lubricant leader aligns it well with the sector's evolving demands, though the sector remains subject to fluctuations tied to global oil prices and economic cycles.
Risk Considerations:
Market Volatility: Rapid shifts in market sentiment could lead to unpredictable price fluctuations.
Economic Dependency: Any downturn in industrial or automotive production could directly impact demand for lubricants.
Regulatory Policies: New environmental or industry regulations could pose challenges to operations.
Commodity Price Risks: Variability in crude oil prices could influence input costs, affecting margins.
Analysis Summary: Castrol India Ltd reflects a steady technical stance with firm support levels offering resilience. Its potential upside levels and a positive swing zone indicate opportunities for momentum-based movements. The RSI’s neutral position suggests balanced momentum, while trading volumes emphasize active investor engagement. Factoring in sector dynamics and broader market conditions, the stock holds a balanced outlook. However, potential investors should remain mindful of broader market trends, sector-specific developments, and potential risks before making any decisions. This analysis provides a comprehensive perspective without any direct buy or sell recommendations.

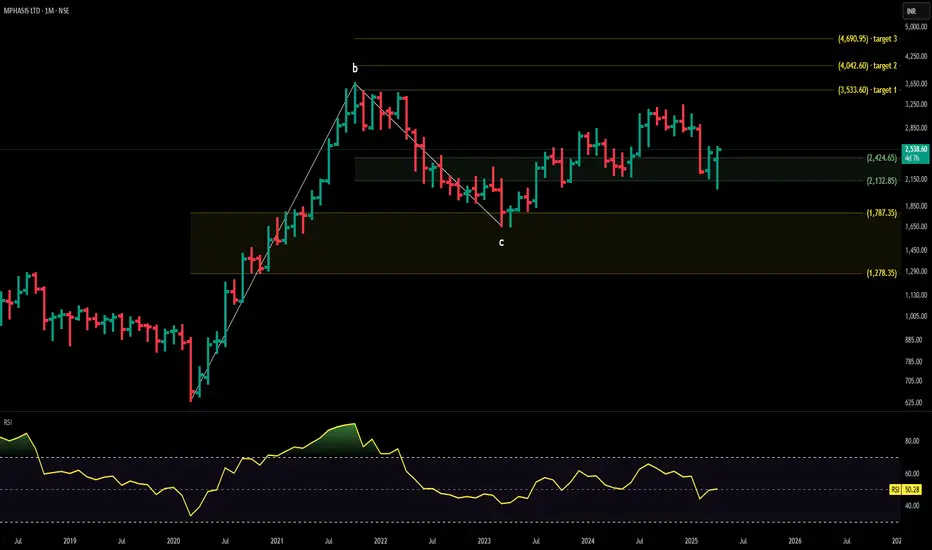
MPHASIS technical analysisStock Overview: Mphasis Limited, traded on the NSE, is currently priced at ₹2,538.60. The company specializes in IT services, offering application development, infrastructure outsourcing, and business process outsourcing to industries like banking, financial services, and insurance.
Key Levels:
Support: ₹1,787.35, ₹1,278.35
Upside Swing Zone: ₹2,424.65, ₹2,132.85
Possible Upside Levels: ₹3,533.60, ₹4,042.60, ₹4,690.95
Technical Indicators:
RSI (Relative Strength Index): The RSI stands at 50.28, indicating a neutral position. This suggests balanced buying and selling pressure without extreme market sentiment.
Volume: The trading volume is 14.03M, reflecting varying levels of activity. Higher volume periods may correlate with significant price movements.
Sector and Market Context: Mphasis operates within the IT services sector, which has demonstrated resilience and growth potential due to increasing demand for digital transformation and cloud services. The sector's overall market trend remains positive, driven by technological advancements and businesses adapting to digital solutions. However, the sector is sensitive to global economic conditions, regulatory changes, and technological disruptions.
Risk Considerations:
Company-Specific Risks: Mphasis faces challenges like competition, client concentration, and the need to keep pace with technological changes.
Sector Risks: The IT services sector is highly competitive and requires continuous innovation to maintain relevance.
Analysis Summary: Mphasis Limited's stock possible upside levels indicate price points the stock could reach under favorable conditions. Investors should consider sector performance, market trends, and company-specific risks before making decisions. Staying informed about developments affecting the stock is crucial for navigating its movement effectively.
"Bank Nifty Faces Resistance as Sellers Dominate"The Bank Nifty index closed at 54,239.05, down 1.74% today. Here's a detailed technical analysis based on daily and weekly charts:
Daily Chart Analysis:
Moving Averages: The 20-day EMA is at 52,732.58, indicating a bearish trend as the index is trading below this level.
Volume: The trading volume was 109.62M, showing moderate activity.
Stochastic Oscillator: The current value is 73.21, suggesting the index is nearing overbought territory.
Support and Resistance: Immediate support is at 54,176.45, while resistance is at 55,350.55.
Weekly Chart Analysis:
Trend: The weekly chart shows a descending channel breakout, targeting 57,450+.
Indicators: The RSI (Relative Strength Index) is neutral, while MACD (Moving Average Convergence Divergence) signals a potential bullish crossover.
Pivot Points: Key levels include:
Support: 53,447.67 (S2), 52,605.13 (S3).
Resistance: 55,249.73 (R2), 56,092.27 (R3).

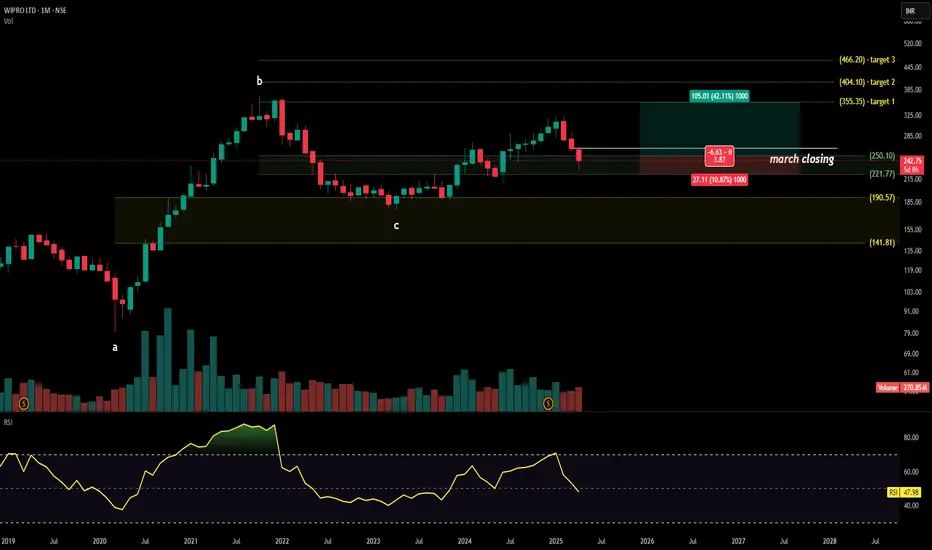
WIPRO technical analysisStock Overview: Wipro Ltd., traded on the National Stock Exchange of India (NSE), is currently priced at ₹376.90. The company is a leading global IT services provider, offering consulting, business process outsourcing, and digital transformation solutions.
Key Levels:
Support Zone: ₹141 - ₹190
Upside Swing Zone: ₹250
Possible Upside Levels: ₹335, ₹404, ₹466
Technical Indicators:
RSI (Relative Strength Index): At a value of 47.98, the RSI indicates neutral momentum, neither in overbought nor oversold territory.
Volume: Trading volumes exhibit steady activity with no significant spikes, suggesting a balanced buying and selling interest.
Sector and Market Context:
Wipro operates within the dynamic IT services sector, which is witnessing moderate growth driven by global digital transformation initiatives.
Compared to its peers, Wipro shows stable performance but lacks aggressive market positioning. The overall market sentiment is cautiously optimistic, with broader indices showing resilience despite macroeconomic pressures.
Risk Considerations:
Sector Challenges: Intense competition from Indian and international firms may weigh on margins and market share.
Stock-Specific Risks: Dependence on major clients and foreign exchange rate fluctuations could influence earnings.
Analysis Summary: Wipro Ltd. demonstrates steady technical and sectoral positioning, with support levels ensuring downside protection and potential upside levels offering room for growth. While the RSI and volumes suggest neutral momentum, broader sector dynamics highlight a cautiously optimistic outlook. Investors should consider macroeconomic and sectoral risks while evaluating Wipro's performance within their portfolio strategy.
"EUR/USD Bullish Setup: Demand Zone Bounce with 205+ Pip Target Current Price:
1.13894 ⚪️ (hovering just above EMA)
Zones & Key Levels:
🔵 Demand Zone (Strong Buy Area)
▪️ 1.13059 – 1.13580
Price bounced here!
➡️ Buyers stepping in!
⚫ Support (Old Resistance, New Support)
▪️ Just above 1.13580
➡️ Important to hold this level for bulls
🟠 Stop Loss
▪️ 1.13059
⚠️ Break below = trade invalid
🎯 Target Point
▪️ 1.15646
🚀 Big upside potential! (~205 pips gain)
Indicators:
📈 EMA (9) = 1.13580
▪️ Price is above it → Bullish sign
Setup Summary:
📍 Entry: Around 1.1389
⛔ Stop Loss: Below 1.13059
🎯 Target: 1.15646
⚖️ Risk-Reward Ratio:
1:2.5+ — Great setup!
Bullish Bias
If price keeps climbing from the demand zone
⬆️ Expect continuation toward 1.15646
But if it breaks down...
⬇️ Watch out below 1.13059

Buy Equitas Small Finance Bank Ltd (EQUITASBNK Equitas Small Finance Bank Ltd (EQUITASBNK)
Current Price: ₹65
Trend: Uptrend
Technical Indicators:
Support: ₹62
Resistance: ₹68
RSI: Approaching 70, indicating strong momentum
MACD: Bullish crossover observed
Trade Setup:
Entry Point: ₹65
Target Price: ₹68 (short-term), ₹70 (extended)
Stop Loss: ₹62
Rationale: The stock has shown a consistent uptrend with strong volume support. The bullish MACD crossover and RSI nearing overbought levels suggest continued upward momentum.

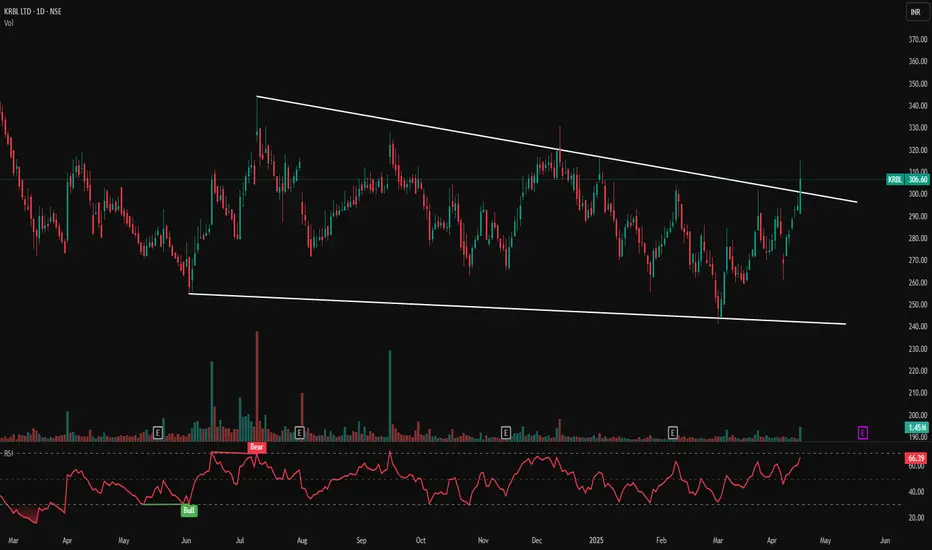
KRBL LTS- Falling Wedge Breakout | Trend Reversal Signal Ahead?KRBL LTD – Falling Wedge Breakout 💥 | Trend Reversal Signal Ahead?
📅 Published on: April 17, 2025
📈 Technical Analysis:
KRBL has shown a bullish breakout from a long-term falling wedge pattern on the daily chart — a classic reversal pattern signalling a potential upward move after prolonged consolidation. The breakout candle is supported by strong volume and a bullish RSI setup.
Pattern: Falling Wedge (Bullish)
Breakout Price: ₹306.60
Previous Resistance Line: Now acting as support
Breakout Volume: 1.45M (above average)
🧭 Key Support & Resistance Levels:
Immediate Support: ₹290
Major Support: ₹275
Immediate Resistance: ₹315
Next Resistance Zone: ₹330 – ₹345
Trendline Resistance (Broken): ₹300 (now support)
🔍 Indicators:
RSI (Relative Strength Index):
Current RSI: 66.39 — bullish, nearing overbought zone, shows strong momentum.
RSI Bullish Crossover observed in April, indicating accumulation before breakout.
🧠 Price Action Observations:
Price respected the wedge formation since March 2024.
A strong bullish candle broke above the upper wedge with conviction.
RSI confirms strength, aligning with price action breakout.
Volume surge supports the breakout's validity.
📌 Strategy (For Educational Purposes):
Entry: ₹305–310 (on retest)
Stop Loss: ₹285 (below wedge support)
Targets:
₹330
₹345
₹360+
📊 Visual Markings & Icons:
White Trendlines: Highlighting falling wedge support and resistance.
Bullish RSI Tags: Marking key bullish RSI crossovers.
Volume Spikes: Notable on breakout day.
Breakout Candle: Large green candle breaching the upper wedge line.
⚠️ Disclaimer:
This analysis is for educational and informational purposes only. Please consult your financial advisor before making any trading decisions.
Godfrey Phillips India Limited - 1D - Breakout
Pattern: A cup and handle formation is visible, suggesting a potential breakout.
• Trendlines: Two white downward trendlines indicate previous resistance levels, with the price recently breaking above them.
• Breakout: The latest price action shows a breakout above resistance around ₹7,107, which could indicate a bullish move.
• Volume: The volume bars at the bottom show increasing volume, confirming the breakout.
Indicators:
• RSI (Relative Strength Index) Indicator (Bottom Panel):
• The red line (72.00) represents the RSI value.
• The yellow-green line (60.61) likely represents a moving average or signal line.
• The RSI above 70 suggests the stock is gaining relative strength and could be in an overbought zone.
Resistance Levels:
1. ₹7,100 - ₹7,150 (Breakout Zone) → The stock has recently broken above this resistance. A successful retest and hold above this level could confirm further upside.
2. ₹7,600 - ₹7,700 → Next key resistance from previous highs (potential target if the breakout sustains).
3. ₹8,000+ (All-Time High Zone) → If momentum continues, this could be a longer-term target.
Support Levels:
1. ₹6,800 - ₹6,850 (Breakout Retest Level) → If the price pulls back, this level should act as strong support.
2. ₹6,400 - ₹6,500 (Psychological & Trendline Support) → Below this is the next strong support from past price action and trendline.
3. ₹6,000 (Major Support Zone) → A breakdown below this could invalidate the bullish trend.
