Search in ideas for "INDICATORS"

Divergence reversal LongIndicators are telling that price may try to reverse at this level, specially the RSI divergence when appears in oversold area. I will go long with small stop loss just some ticks below the low made today. IF it works it can give decent return so one can take chance by risking small amount. Good Luck

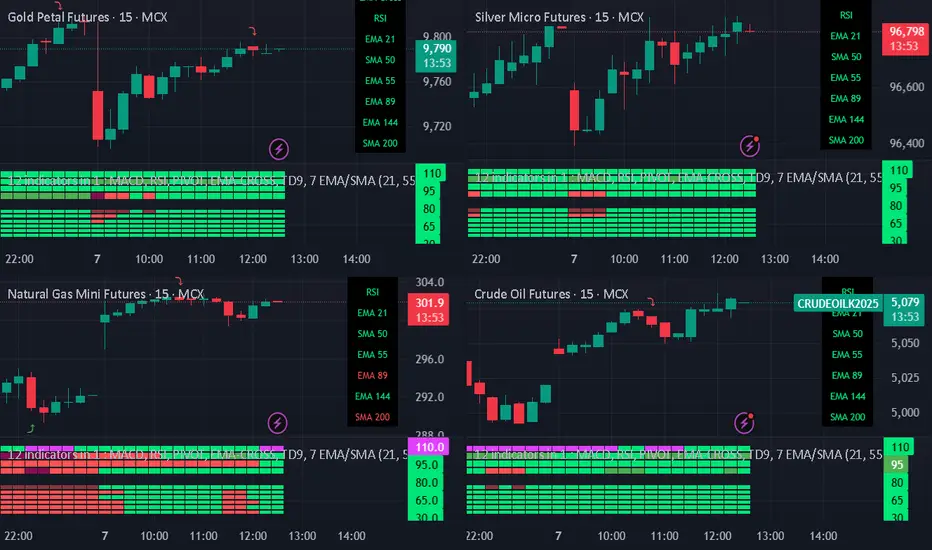
Best Commodity layoutBest Commodity layout
Crafting Your Optimal Commodity Technical Chart Layout in TradingView
The "best" commodity technical chart layout in TradingView is highly personalized, depending on your trading style, strategy, and the specific commodities you're analyzing. However, a well-structured layout should provide a clear, comprehensive view of price action and key technical indicators to aid in decision-making.
Here's a guide to creating an effective commodity technical chart layout in TradingView, incorporating common practices and versatile tools:
1. Choosing Your Main Chart Type:
Candlestick Charts: This is the most popular choice for most traders. Candlesticks provide detailed information about the open, high, low, and close (OHLC) prices for a specific period, making it easier to identify patterns and market sentiment.
Bar Charts: Similar to candlesticks, bar charts also display OHLC data but in a different visual format.
Line Charts: Useful for a quick overview of the overall trend, typically plotting the closing prices.
Heikin Ashi: These charts can help filter out market noise and make trends easier to identify by averaging price data.
Renko or Kagi Charts: These focus solely on price movement, ignoring time, and can be useful for identifying support and resistance levels.
Recommendation: Start with Candlestick charts for their detailed information. You can always switch to other types for different analytical perspectives.
2. Essential Technical Indicators for Commodities:
While the "best" set of indicators is subjective, here are some widely used and effective ones for commodity analysis in TradingView:
Moving Averages (MAs):
Types: Simple Moving Average (SMA) and Exponential Moving Average (EMA) are common. EMAs react faster to recent price changes.
Use: Identify trend direction, support/resistance levels, and potential crossover signals. Common periods include 20, 50, 100, and 200.
Layout: Add 2-3 MAs of different lengths directly onto your main price chart. For example, a 21-period EMA for short-term trends and a 50-period EMA for medium-term trends.
Volume Indicators:
Types: Volume (displays trading activity) and On-Balance Volume (OBV).
Use: Confirm the strength of price movements. A significant price move accompanied by high volume is generally considered more valid.
Layout: Typically displayed in a separate pane below the main price chart.
Oscillators (for identifying overbought/oversold conditions and momentum):
Relative Strength Index (RSI): Measures the speed and change of price movements. Values above 70 often indicate overbought conditions, while below 30 suggest oversold conditions. Standard period is 14.
Moving Average Convergence Divergence (MACD): Shows the relationship between two moving averages of an asset's price. It consists of the MACD line, signal line, and histogram.1 Used for trend identification and momentum.
1.
medium.com
medium.com
Stochastic Oscillator: Compares a particular closing price of an asset to a range of its prices over a certain period. Also used to identify overbought/oversold conditions.
Commodity Channel Index (CCI): Identifies cyclical trends and can signal overbought/oversold levels.
Layout: Oscillators are usually placed in separate panes below the main chart. You might choose 1 or 2 that best suit your strategy (e.g., RSI and MACD).
Volatility Indicators:
Bollinger Bands: Consist of a middle band (typically an SMA) and two outer bands representing standard deviations. They help identify volatility and potential price breakouts or mean reversion.
Keltner Channels: Similar to Bollinger Bands but use Average True Range (ATR) for the outer bands. Can be used for breakout and trend-following strategies.
Average True Range (ATR): Measures market volatility. Useful for setting stop-loss orders.
Layout: Bollinger Bands and Keltner Channels are overlaid on the main price chart. ATR is usually in a separate pane.
Trend-Following Indicators:
Ichimoku Cloud (Ichimoku Kinko Hyo): A comprehensive indicator that defines support/resistance, identifies trend direction, and provides trading signals. It includes several components like the Kumo (Cloud), Tenkan-sen, and Kijun-sen.
Donchian Channels: Plots the highest high and lowest low over a set period. Useful for identifying breakouts and trend direction.
Layout: Ichimoku Cloud and Donchian Channels are overlaid on the main price chart.
Recommendation for a Balanced Layout:
Main Chart: Candlesticks, 2-3 EMAs (e.g., 21, 50, 200), Bollinger Bands or Keltner Channels.
Pane 1 (below main): Volume.
Pane 2 (below main): RSI (14) or MACD.
Pane 3 (optional): CCI or ATR if your strategy heavily relies on them.
3. Drawing Tools:
Effective use of drawing tools is crucial for technical analysis:
Trendlines: Connect swing highs or lows to identify the direction and strength of trends.
Support and Resistance Levels: Horizontal lines drawn at key price levels where the price has historically struggled to break above (resistance) or fall below (support).
Fibonacci Retracement and Extension Levels: Help identify potential support/resistance levels and price targets based on Fibonacci ratios.
Channels: Parallel trendlines that can define a price range.
Chart Patterns: Use tools to identify patterns like head and shoulders, triangles, flags, and pennants.
Layout Tip: Keep your most frequently used drawing tools easily accessible in the TradingView drawing panel.
4. Multi-Timeframe Analysis & Multi-Chart Layouts:
Analyzing commodities across different timeframes can provide a broader market perspective. TradingView allows you to set up multi-chart layouts (the number of charts available depends on your subscription plan).
Common Setup:
Chart 1 (Long-Term): Weekly or Daily chart to identify the major trend.
Chart 2 (Medium-Term): 4-hour or Daily chart for more detailed trend analysis and identifying key levels.
Chart 3 (Short-Term): 1-hour or 15-minute chart for entry and exit signals.
Synchronization: TradingView allows you to synchronize symbols, crosshair, interval, and drawings across multiple charts in a layout, which can be very efficient.
5. Customization and Saving Your Layout:
Appearance: Customize chart colors (background, candles, grids), scales, and lines to your preference for better visual clarity and reduced eye strain. Access these via Chart Settings (the gear icon).
Saving Layouts: Once you have a setup you like, save it as a chart layout in TradingView. You can create multiple layouts for different commodities, strategies, or analytical purposes.
Indicator Templates: Save combinations of indicators as templates for quick application to new charts.
Tips for the "Best" Layout:
Keep it Clean: Avoid cluttering your chart with too many indicators. Focus on a few that you understand well and that complement your strategy.
Consistency: Use consistent settings for your indicators across different charts and timeframes.
Practice: The "best" layout is one that works for you. Experiment with different indicators and setups on a demo account or through backtesting to see what yields the best results for your trading style.
Stay Informed: Be aware that some commodities (e.g., agricultural products) can be influenced by seasonal patterns or specific reports (like USDA reports for crops, EIA for oil). While not a direct part of the "chart layout," integrating this knowledge with your technical analysis is crucial. TradingView has features to display key events like earnings reports or dividends, which can be relevant. Some community scripts on TradingView even offer overlays for planting and harvesting seasons for agricultural commodities.
By following these guidelines and experimenting to find what suits your individual needs, you can create a powerful and effective commodity technical chart layout in TradingView. Remember to regularly review and refine your layout as your trading strategies evolve.
Technical / Chart Study of Bank Nifty FuturesEducational Purpose Only
Technical / Chart Study of Bank Nifty Futures
LTP: 3811.00
Support: 38500.00
Resistance: 38950.00 / 39250.00
38500.00 is to be considered as a crucial level as the supertrend and price action have the same support zone in the hourly chart. We can expect a steep downfall if 38500.00 is broken on the downside.
38500.00 was a resistance level till the 1st of February after which is has been effective as a support. It was broken on the same day but we can ignore the breach as the closing was well above 38500.00
The trend here looks sideways until the resistance at 38950.00 or the support at 38500.00 is breached.
Indicators:
1. Supertrend is bearish.
2. Candles are trading below 21 EMA.
3. MACD is sideways, hence neutral as of now.
4. RSI couldn’t breach the 50 mark but there is a bullish divergence, so, let’s consider it as neutral.
There is no clear trend or any other important information that we can derive from the charts so let’s skip to the indicators.
Indicators:
1. Candles are trading below the 21 EMA which is at 38951.35.
2. Supertrend is bullish.
3. MACD is neutral.
4. RSI is bearish.
Now, let’s jump to the daily charts and see what we can study there.
Here, there is an interesting point that I would like to make. If we drew a trendline from the highs made on 25th October to the high made on 13th January, it is clear the downtrend was broken on the 2nd of February.
It won’t be wise to say that the chart is now in an uptrend because we can clearly see that the trend is sideways but still better than a downtrend.
Indicators:
1. Supertrend is bullish.
2. Candles are above 21 EMA.
3. MACD is neutral.
4. RSI is bullish but there is a reversal so we will consider is at neutral.
Now, time to draw a conclusion.
Bank Nifty futures are in a sideways trend. Trading here may lead to very little profits or losses and there is nothing exciting happening.

BANKNIFTY stuck in a Range in 1 hour timeframeObservations
BANKNIFTY has been consolidating within a defined range for the past 4 trading sessions in one hour candle chart
Support level: 48000
Resistance level: 49660
Price action has been characterized by lack of strong directional bias
Trading Idea
Breakout Strategy:
Long Entry: A decisive break above the resistance level 49660 with increased volume and confirmation from indicators.
Stop-Loss: Below the recent swing low within the range.
Target: Risk-Reward ratio of 1:2
Short Entry: A decisive break below the support level 48000 with increased volume and confirmation from indicators.
Stop-Loss: Above the recent swing high within the range.
Target: Risk-Reward ratio of 1:2
Considerations:
Volume: Increased volume on the breakout can strengthen the move.
Indicators: Consider using indicators like RSI, MACD, or Bollinger Bands to identify potential divergences or confirmations.
News & Events: Be aware of upcoming budget events that could impact market sentiment.
Disclaimer: This is for informational purposes only and not financial advice. Trading involves risk, and you should always conduct your own research and consult with a qualified financial advisor before making any investment decisions.

USDINRCertainly! Here's a detailed analysis of the chart:
The chart analyses the USD/INR currency pair on a daily timeframe, displaying price movements across several months.
**Current Data:**
- **Price**: 86.3670 INR per USD.
- **Daily High**: 86.5950
- **Daily Low**: 86.3040
- **Open Price**: 86.4320
- **Buy Price**: 86.4170
**Trend Analysis:**
The chart includes multiple trend lines that highlight support and resistance levels. These are crucial for identifying potential reversal points:
- **Support Levels**: 85.2961 and 85.2603
- **Resistance Levels**: 83.9388 and 83.4425
**Technical Indicators:**
- **Stochastic Oscillator**: Shows values of 71.68 (orange line) and 66.27 (blue line), indicating possible overbought or oversold conditions which can signal upcoming market trends.
**Timeframe Covered:**
The data spans from September to February, and the analysis was recorded at 12:44:59 (UTC).
This chart is beneficial for making informed trading decisions by analyzing trend patterns, key support/resistance levels, and market indicators.
Great! Let's dive deeper into the analysis.
### Trend Analysis:
The **support levels** and **resistance levels** provide an understanding of where the price might find difficulty moving further or where it might bounce back from:
- **Support Levels**:
- **85.2961 INR**: A point where there has been significant buying interest before.
- **85.2603 INR**: Another strong support level indicating a price floor.
- **Resistance Levels**:
- **83.9388 INR**: A point where selling pressure has previously been strong.
- **83.4425 INR**: Another price point marking significant resistance in the market.
### Technical Indicators:
- **Stochastic Oscillator**:
- Both orange and blue lines are hovering near overbought territory. This usually suggests that the current upward price trend may be weakening, and the currency pair might be due for a correction.
### Market Insights:
Looking at the data, one can infer that the market has been quite volatile. The recent high values in the Stochastic Oscillator imply that buyers might be losing steam, indicating a possible trend reversal. Observing the support and resistance levels alongside the stochastic values can help predict future price movements and advise on trading actions.
Feel free to ask if there's anything more specific you'd like to uncover in this chart analysis. I'm here to assist you!

Bitcoin (BTC/USD) chart analysis
### **1. Chart Overview**
- **Symbol & Timeframe:** The Bitcoin (BTC/USD) chart on a 1-hour timeframe, using Heikin Ashi candles for smoother trend visualization.
- **Indicators:** The chart incorporates multiple indicators:
- Volume.
- MACD (Moving Average Convergence Divergence).
- RSI (Relative Strength Index).
- **Patterns & Levels:** Features such as support & resistance levels, a potential double bottom pattern, and trendlines are marked.
- **Current Price Action:** Bitcoin appears to be breaking out of a consolidation phase.
### **2. Key Chart Feature and Pattern Observation**
- **Double Bottom Pattern:** Two "Bottom" labels are highlighted, signaling a potential bullish reversal. This pattern is confirmed by the breakout above the neckline (pink horizontal line).
- **Ascending Trendline:** A rising trendline from the second bottom indicates bullish momentum.
- **Support & Resistance:**
- **Support Level:** Around $94,273.
- **Resistance Levels:** $98,338 (current breakout level) and $102,104 (target level based on pattern projection).
- **Bullish Divergence:** Observed in the MACD indicator, indicating weakening selling pressure and a potential upward move.
### **3. Indicator Analysis**
- **Volume:**
- Gradual increase during the breakout, confirming bullish activity.
- Higher volume bars on green candles support upward momentum.
- **MACD:**
- **Bullish Crossover:** The MACD line (blue) crosses above the signal line (red), suggesting a bullish trend.
- Positive divergence from price action indicates buying interest.
- **RSI:**
- RSI is rising and nearing overbought territory (~81). This suggests strong momentum, but caution is warranted for potential pullbacks.
### **4. Key Levels or Price Levels**
- **Support Levels:**
- $94,273 (recent bottom).
- $94,220 (marked low of the pattern).
- **Resistance Levels:**
- $98,338 (breakout zone).
- $102,104 (target level from double bottom pattern).
- **Volume-Based Levels:**
- Price reacts strongly to volume spikes near breakout and support zones.
### **5. Overall Summary**
Bitcoin shows clear bullish momentum, supported by:
- Double bottom pattern breakout.
- Increasing volume and bullish divergence on MACD.
- Strong upward RSI, although nearing overbought territory.
However, caution is necessary near resistance levels or in case of volume weakening.
### **6. Recommendation or Trading Strategy**
- **Long Entry:**
- Enter above $98,338 (confirmed breakout).
- Use Heikin Ashi candles to monitor trend consistency.
- **Target:**
- First target: $102,104.
- Extended target: Use Fibonacci extensions for further levels.
- **Stop-Loss:**
- Below $94,220 (below the double bottom structure) or the rising trendline.
- **Cautionary Note:** Monitor RSI for overbought signals and potential corrections.
### **7. Conclusion**
The current setup favors a bullish outlook, with a confirmed double-bottom breakout and positive indicators. Traders should ride the trend but remain cautious as RSI signals possible overextension. Adjust risk management accordingly and monitor volume for sustained momentum.

AGI - Breakout Alert – Strong Volume, Clear Trend, Smart Zones! ________________________________________________________________________________
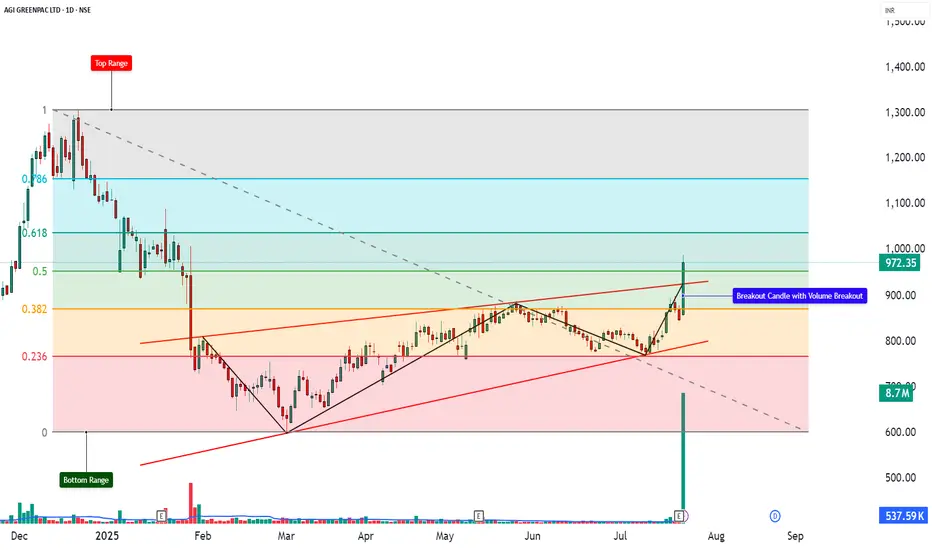
📈 AGI GREENPAC LTD – AGI GREENPAC Breakout Alert – Strong Volume, Clear Trend, Smart Zones! Breakout
🕒 Chart Type: Daily Chart
📆 Date: July 22, 2025
________________________________________________________________________________
📌 Price Action:
AGI GREENPAC has staged a textbook breakout above its rising channel, with a massive +14.83% rally, closing the day at ₹972.35. The price not only cleared a medium-term resistance level but also broke above critical Fibonacci levels, reclaiming bullish control. This is not just a price breakout — it's a structure + volume + indicator alignment, offering a compelling bullish setup with potential for follow-through.
________________________________________________________________________________
📊 Chart Pattern:
✅ Rising Channel Breakout – A bullish continuation pattern formed over several months
✅ Breakout occurred near the channel’s upper boundary with explosive volume
✅ Price cleared 0.5 (₹950.50) and 0.618 (₹1037.15) Fibonacci retracement levels from the prior fall
✅ The structure was backed by a base formation, indicating accumulation beneath resistance. This pattern signals a potential transition from slow ascent to impulsive trend phase — a powerful sign when backed by volume and momentum indicators.
________________________________________________________________________________
🕯️ Candlestick Pattern:
✅ Wide-Range Bullish Candle
✅ Open = Low formation (strength from the first tick)
✅ Strong follow-through above consolidation
✅ Classic “Buy Today, Sell Tomorrow” price action
✅ Confirms structural breakout from channel top
________________________________________________________________________________
🔊 Volume Analysis:
AGI GREENPAC saw a big jump in trading volume, with over 8.7 million shares traded — that’s more than double the usual average of the past 20 days. This kind of volume shows that a lot more people were actively buying the stock, and it wasn’t just a one-time spike — the buying continued throughout the day. What makes this even more special is that it comes after many days of low activity, which often means big investors were slowly building their positions. When such quiet periods are followed by a big volume and price breakout, it usually signals the start of a strong uptrend. Also, this is the highest volume in the past 52 weeks, which gives even more strength to this breakout and shows serious buying interest.
________________________________________________________________________________
📈 Technical Indicators:
The technical indicators are showing strong signs of bullish momentum in AGI GREENPAC. The RSI is at 73, which means the stock is trending strongly and buyers are in control. The MACD, a popular momentum indicator, has given a bullish crossover both on the daily and weekly charts — this is a positive signal that the trend may continue. The CCI, which tracks the speed and strength of price moves, is at 274, indicating very strong upside pressure. The Stochastic is at 93, which means the stock is in the overbought zone, but still confirming the ongoing strength. The price is trading above the VWAP (Volume Weighted Average Price), showing that buyers are dominating the day. Lastly, the stock has broken out of a Bollinger Band squeeze — a setup where the price was moving in a tight range and has now burst out with momentum. When all these indicators point in the same direction, it gives us a high-confidence signal that the breakout is genuine and may continue.
________________________________________________________________________________
🧱 Support & Resistance:
🔻 Supports:
• ₹887.83 – Immediate support (breakout zone)
• ₹803.32 – Mid-structure base
• ₹752.93 – Last support before invalidation
• Bottom Range: ₹599.10 – Historical demand base
🔺 Resistance Zones:
• ₹1022.73 – First resistance (Fibonacci level)
• ₹1073.12 – Previous swing top
• ₹1157.62 – 0.786 Fib level and prior rejection area
• Top Range: ₹1307.90 – Final upside Fibonacci target
________________________________________________________________________________
👀 What’s Catching Our Eye:
What really makes this setup stand out is that everything is coming together at once — and that doesn’t happen often. The stock has broken out of a rising channel, which is a strong chart pattern. It also crossed important Fibonacci levels, showing strength in the move. The volume is more than double the average, which tells us that serious buyers are stepping in. Momentum indicators like RSI and CCI are showing strong upward energy. On top of that, the price has broken out of a tight Bollinger Band range and is staying above VWAP, which adds more strength to the trend. When so many signals align like this, it usually means the stock has a good chance of moving even higher — this is what we call a high-confidence breakout.
________________________________________________________________________________
🔍 What We’re Watching For:
The key thing now is whether the stock can stay above the ₹950–₹960 zone over the next few days. If it does, it will confirm that the breakout is strong and has the potential to move higher. However, if the price dips slightly into the ₹900–₹915 range with low volume, it could be a good opportunity for a safe re-entry. On the other hand, if the stock closes below ₹887, it may be a warning sign that the breakout is failing. This zone is very important — it’s the make-or-break level that will decide if the uptrend continues or fades away.
________________________________________________________________________________
✅ Best Buy Levels (Low Risk Idea):
🔹 Entry: On pullback to ₹861.7–₹864.9 zone with SL ₹848.54
🔹 Low Risk Entry: ₹851.12 with Stop Loss: ₹833.72 (closing basis)
🔹 Risk-Reward: 1:1 | 1:2 +
📌 Avoid chasing — let the price validate the breakout
________________________________________________________________________________
💼 Sector Tailwinds:
AGI GREENPAC is in a business that’s currently seeing strong demand — especially from sectors like real estate, pharmaceutical packaging, alcohol bottling, and FMCG (like food and household products). These industries need high-quality glass and packaging, which is exactly what AGI provides. With growth happening in these areas, the company stands to benefit. This means that the fundamentals are also supporting the chart breakout, making the overall setup even stronger.
________________________________________________________________________________
⚠️ Risks to Watch:
Even though the chart looks strong, there are a few things to be careful about.
First, indicators like RSI and Stochastic show that the stock is in the overbought zone, which means a small pullback or correction is possible. If the price closes below ₹887, it could mean the breakout has failed. Also, if you start seeing red candles with low volume, it might be an early sign that buying interest is fading. Most importantly — don’t invest all your money at once. It's always better to enter with proper risk management and a clear plan, especially after a sharp move.
________________________________________________________________________________
🔮 What to Expect Next:
If AGI GREENPAC stays above the ₹950–₹960 range, it can likely move up to ₹1022–₹1073 in the short term. If the momentum continues and the stock breaks above ₹1073, it could head even higher toward ₹1157–₹1300 in the coming weeks. But if the price drops below ₹887, it could mean the breakout has failed, and the upward trend might not continue. So, the next few days are very important to confirm whether the breakout is real and sustainable.
________________________________________________________________________________
🧠 How to Trade AGI GREENPAC (For Educational Use Only):
🔹 Breakout Plan
• Entry: ₹988.60 or Pullback Zone ₹903–₹915
• SL: ₹842 (Closing basis)
• Risk-Reward: 1:1 | 1:2 +
• Position Sizing: Never all-in — always size by risk
________________________________________________________________________________
⚠ Disclaimer (Please Read):
• These Trades are shared for educational purposes only and is not investment advice.
• I am not a SEBI-registered advisor.
• The information provided here is based on personal market observation.
• No buy/sell recommendations are being made.
• Please do your own research or consult a registered financial advisor before making any trading decisions.
• Trading involves risk. Always use proper risk management.
I am not responsible for trading decisions based on this post.
________________________________________________________________________________
💬 Found this Helpful?
How would you trade this — chase momentum or wait for pullback entry?
👇 Drop your thoughts or questions below
🔁 Share this post with your trading community – let them benefit from clean charts, structured setups, and zone-based learning.
✅ Follow simpletradewithpatience for charts, clean setups, and educational content based on price action, zones, and risk-managed trades.
🚀 Trade with patience, trust your charts, and stay clear-headed!
Be Self-Reliant | Trade with Patience | Learn with Charts & Zones 📊________________________________________
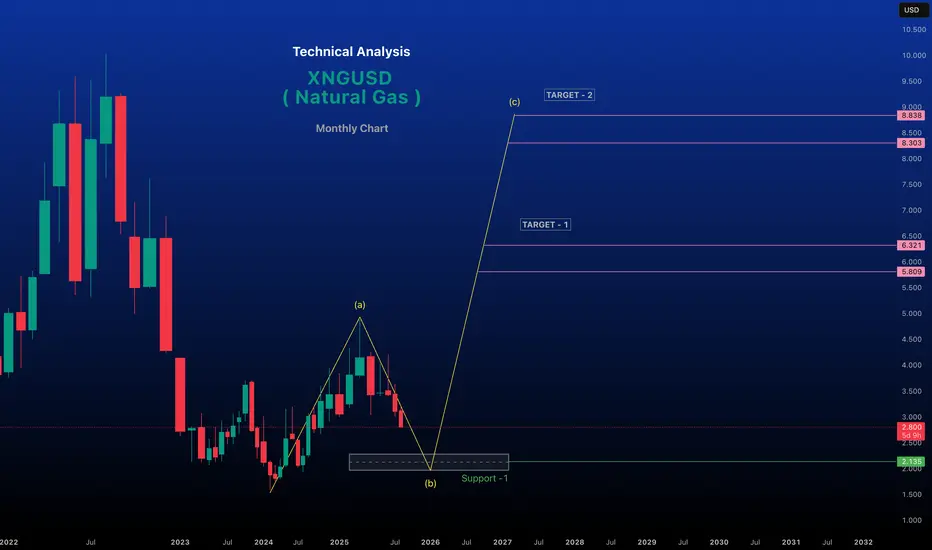
Natural gas analysis Monthly Time frameNatural gas markets are influenced by a complex interplay of supply, demand, weather, geopolitical events, and technical factors. Below is a concise analysis based on recent trends and data as of August 24, 2025, covering key aspects of the natural gas market
Price Trends and Market Dynamics
Spot and Futures Prices: The Henry Hub spot price recently fell from $2.92/MMBtu to $2.81/MMBtu, and the September 2025 NYMEX futures contract dropped from $2.828/MMBtu to $2.752/MMBtu. The 12-month futures strip (September 2025–August 2026) averaged $3.501/MMBtu, reflecting a bearish near-term outlook but expectations of tighter balances later.
Supply and DemandSupply: U.S. natural gas production has risen, with a 3% increase in marketed production in 2025, particularly from the Permian (2 Bcf/d), Haynesville, and Appalachia (0.9 Bcf/d each). However, production is expected to stabilize in 2026 as associated gas from oil declines.
Storage: U.S. storage inventories are projected to reach 3,927 Bcf by October 31, 2025, 174 Bcf above the five-year average, due to higher-than-average injections (20% above the five-year average). This surplus is pressuring prices downward.
Demand: Cool weather forecasts for August 2025, potentially the coolest in 50 years, have reduced demand, contributing to bearish price sentiment. However, LNG exports are rebounding, with Freeport LNG operations resuming, providing some support.
LNG Exports: Maintenance at U.S. LNG terminals earlier in 2025 reduced exports, but recovery and new contracts (e.g., ConocoPhillips’ 4 Mt/y from Port Arthur LNG Phase 2) signal growing export potential.
Technical AnalysisBearish Signals: Technical indicators suggest a "strong sell" for Natural Gas Futures across multiple timeframes (daily, weekly, monthly), driven by a head-and-shoulders pattern with prices breaking below the $3.050 neckline, targeting $2.220–$2.000.
Indicators: RSI, MACD, and stochastic oscillators indicate oversold conditions, but negative momentum persists below key resistance levels like $3.100–$3.320. Pivot points and moving averages reinforce bearish trends, with potential support at $2.200.
Geopolitical and Structural FactorsEurope: The 2022–2023 Russian supply shock shifted Europe to rely on LNG, increasing price volatility. Market reforms have boosted trading volumes (7,300 bcm in 2024, 15x demand), but derivatives trading by physical players dominates, limiting speculative impacts.
Weather Impact: Cooling in the Midwest and Northeast (highs of 60s–80s°F) contrasts with hotter conditions elsewhere (80s–100s°F), driving regional demand differences. Weather models (ECMWF, GFS) forecast continued impacts on heating and cooling degree days, affecting prices.
Energy Transition: Natural gas is increasingly vital for electricity generation as coal phases out, linking gas and power markets and amplifying price sensitivity to weather and demand.
Forecast and OutlookShort-Term (1–6 Weeks): Bearish due to high storage, weak demand from cool weather, and technical indicators. Prices may test support at $2.220–$2.080,
Long-Term: Growing U.S. electricity demand (31% over 15 years) and constrained global supply (e.g., limited OPEC spare capacity) suggest bullish prospects for natural gas as a reliable fuel.
Trading ConsiderationsRisks: High volatility, weather-driven demand shifts, and geopolitical uncertainties (e.g., Russia-Ukraine tensions) pose risks.
Strategies: Traders may consider short positions targeting $2.80, but oversold conditions suggest caution for potential reversals. Long-term investors might accumulate near support zones ($2.220–$2.080) for 2026 upside.
Data Tools: Monitor EIA storage reports, weather forecasts (NatGasWeather.com), and technical indicators (RSI, MACD) for real-time insights.
Note: Trading involves high risks, and past performance does not guarantee future results. Always conduct your own research.
EUR/USD Trading Plan: Key Support, Resistance & Entry Points The European Central Bank (ECB) is anticipated to proceed with an interest rate cut, influenced by the U.S. administration's restraint from imposing broad trade tariffs. This expectation has solidified market sentiments towards monetary easing in the eurozone.
Key Support and Resistance Levels:
Support: 1.05946, 1.0574
Resistance: 1.0469
Trade Setup:
take profit 1.0700
sl 1.05800
echnical Analysis and Sentiment:
EUR/USD Rally: The EUR/USD pair surged 1.4% on Tuesday, climbing 140 pips in a single session as markets sold off the U.S. dollar amid expectations of tariff policy shifts.
Technical Indicators: According to Investing.com's technical analysis, the EUR/USD pair is currently exhibiting strong buy signals across various moving averages and technical indicators.
Alternative Scenario:
If the price fails to break above 1.0500 and shows signs of bearish reversal, consider entering a short position below 1.0480, with a take profit at 1.0376 and a stop loss at 1.0500.
Conclusion:
The EUR/USD currency pair is currently exhibiting bullish tendencies across multiple timeframes, supported by recent economic developments and technical indicators. Traders should monitor key levels and potential breakout points to capitalize on trading opportunities, ensuring proper risk management with well-defined entry and exit points.
✅ #forex
✅ #forextrading
✅ #forexanalysis
✅ #forexsignals
✅ #fxtrading
✅ #trading
✅ #eurusd
✅ #eurusdforecast
✅ #eurusdanalysis
✅ #eurusdtrading
✅ #eurusdsetup
✅ #eurusdsignal
✅ #technicalanalysis
✅ #priceaction
✅ #supportandresistance
✅ #trendanalysis
✅ #chartpatterns
✅ #elliottwave
✅ #swingtrading
✅ #daytrading
✅ #scalping
✅ #riskmanagement
✅ #tradingpsychology
✅ #tradingview
✅ #forexcommunity
@marketanalysis

Crisil Ltd.CRISIL Ltd. (NSE: CRISIL) is currently exhibiting a **Neutral** technical outlook, as indicated by various technical analysis indicators.
**Technical Indicators:**
- **Relative Strength Index (RSI):** The 14-day RSI stands at 38.43, suggesting a neutral market sentiment. citeturn0search3
- **Moving Averages:** The stock is trading below its 5-day, 10-day, 20-day, and 50-day simple and exponential moving averages, indicating a bearish trend. citeturn0search3
- **MACD (Moving Average Convergence Divergence):** The MACD value is -124.85, which is below the signal line, suggesting a bearish momentum. citeturn0search3
- **Stochastic Oscillator:** The Stochastic Oscillator is at 38.63, indicating a neutral market condition. citeturn0search3
**Support and Resistance Levels:**
- **Support:** The stock has support at ₹4,996.55. citeturn0search3
- **Resistance:** The resistance level is at ₹5,455.40. citeturn0search3
**Conclusion:**
CRISIL Ltd. is currently in a neutral technical position, with indicators suggesting neither strong bullish nor bearish momentum. Investors should monitor these indicators closely, as a breakout above resistance levels could signal a bullish trend, while a drop below support levels might indicate a bearish move. It's advisable to consider these technical factors alongside fundamental analysis and broader market conditions when making investment decisions.

APEUSDT taking support at 200MA and Short Term BullishTechnical Analysis:
1. Backtesting within 7 days: There are no clear patterns observed in the MACD, RSI, BOLL, and KDJ indicators. This indicates a lack of significant trend or momentum signals in the short term.
2. Backtesting within 30 days: Similar to the 7-day backtesting, there are no notable patterns in the MACD, RSI, BOLL, and KDJ indicators. This suggests a lack of clear trends or momentum signals in the longer term.
Fundamental Analysis:
1. Token Information: ApeCoin (APE) is an ERC-20 governance and utility token within the APE Ecosystem. It is used to empower a decentralized community building at the forefront of web3. APE will be adopted as the primary token for all new products and services by Yuga Labs, the creators of Bored Ape Yacht Club (BAYC).
2. Token Market Information: The current price of APEUSDT is $1.9386, with a 24-hour price change of -2.26% and a 7-day price change of +12.48%. The token has a market cap of $1,185,668,425, a total supply of 1,000,000,000 tokens, and a circulation supply of 299,531,250 tokens. The BOLL support price is $1.9169, while the BOLL resistance price is $1.9965.
3. Funding Analysis: Bybit's Major Whale Traders position direction is bullish, with a long/short ratio of 1.95.
4. Third-party Indicators: The Market Sentiment Index is at 79, indicating a high level of greed among market participants.

IDFC | Long Term | Cycle RepeatsThe lifecycle of a stock or asset can be broadly understood through a series of phases or stages that represent different patterns of price action. These stages help traders and investors identify where a stock might be in its cycle, and therefore make more informed decisions. Here's a breakdown of the typical lifecycle of a stock:
Stage 1: Accumulation (Consolidation)
Description: During this stage, the stock price moves within a relatively tight range, often after a significant decline or during periods of low market interest. This stage is characterized by low volatility and low trading volumes as institutional investors or informed insiders begin to accumulate shares without significantly moving the price.
Market Sentiment: Neutral to cautiously optimistic.
Price Action: The stock trades sideways, with minor ups and downs, creating a base or a foundation for the next move. This is also known as the consolidation phase.
Technical Indicators: Moving averages might flatten out, and other indicators like the Relative Strength Index (RSI) tend to stay neutral.
Stage 2: Markup (Rise)
Description: In this stage, the stock begins to rise steadily, often breaking out of the consolidation range established during Stage 1. This is when the broader market starts to take notice, and buying interest increases.
Market Sentiment: Bullish, with increasing optimism and momentum.
Price Action: The stock shows a clear uptrend, making higher highs and higher lows. The volume often increases as more participants enter the market.
Technical Indicators: Moving averages typically start to slope upward, and momentum indicators like the RSI often move into overbought territory, though they can stay elevated for extended periods during strong trends.
Stage 3: Distribution (Consolidation)
Description: After a significant rise in price, the stock enters another consolidation phase. This is where the stock price begins to level off after the uptrend, as early investors and institutions start to take profits.
Market Sentiment: Mixed to cautious. Some participants are still bullish, while others are looking to exit.
Price Action: The stock may trade within a range, similar to Stage 1, but typically at a higher price level. The volatility might increase as the market tries to determine the next direction.
Technical Indicators: Indicators like the RSI may show divergence (price making new highs while RSI makes lower highs), signaling weakening momentum. Volume might increase as selling pressure begins to meet or exceed buying pressure.
Stage 4: Mark Down (Bearish) or Markup (Bullish)
Description: This stage can diverge into two different directions:
Bearish (Markdown): If the stock breaks down from the Stage 3 consolidation range, it enters a downtrend. Selling accelerates as more investors look to exit, leading to a decline in the stock price.
Bullish (Further Markup): Alternatively, the stock might resume its upward movement, leading to another rise if the overall market conditions remain favorable and demand continues.
Market Sentiment:
Bearish: Sentiment turns negative, with increasing fear and pessimism.
Bullish: Sentiment remains positive, driven by continued optimism or external factors like strong earnings reports.
Price Action:
Bearish: The stock makes lower lows and lower highs, confirming the downtrend.
Bullish: The stock breaks out of the range to the upside, continuing its uptrend.
Technical Indicators:
Bearish: Moving averages may cross downward (e.g., the "death cross"), and RSI can drop into oversold territory.
Bullish: Moving averages continue to trend upwards, and RSI can remain in overbought territory.
Cycle Repeats:
Once Stage 4 completes, the cycle can begin a new. After a markdown (bearish phase), the stock might enter another accumulation (consolidation) phase as the price stabilizes, setting the stage for a new potential uptrend. Conversely, if the stock continues to rise in the bullish scenario, it may eventually enter a new distribution phase at a higher level.
Understanding these stages helps traders and investors to anticipate potential moves in the market, allowing them to position themselves accordingly.

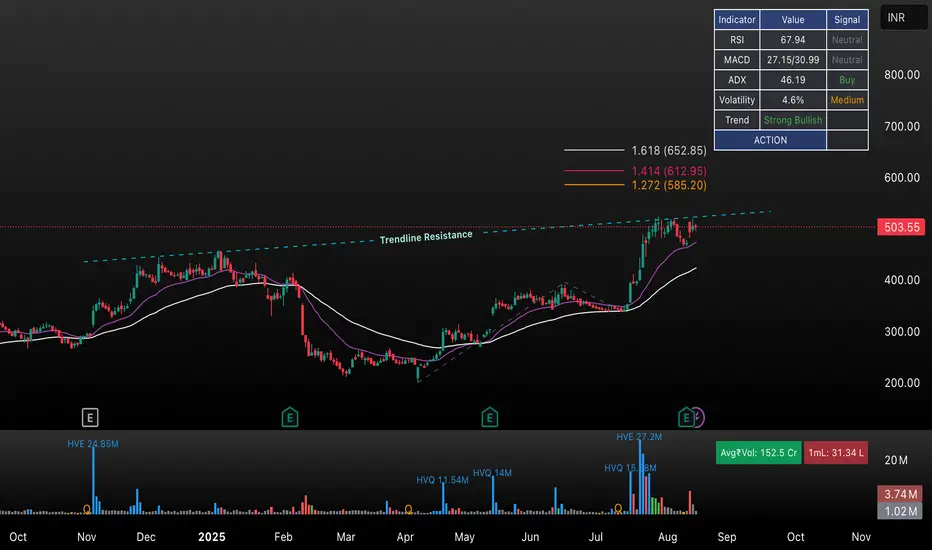
Technical Analysis of TI Stock with Trendline and FibonacciThis TradingView chart analyzes the price action of TI stock using key technical indicators and trend projections as of August 2025. The chart displays:
• Current Price: ₹503.55
• Technical Indicators:
• RSI: 67.94 (Neutral)
• MACD: 27.15/30.99 (Neutral)
• ADX: 46.19 (Bullish/Buy)
• Volatility: 4.6% (Medium)
• Trend: Strong Bullish
• Chart Features:
• Trendline Resistance: Marked above the current price, serving as immediate resistance.
• Fibonacci Extension Levels: Key levels indicated at 1.272 (₹585.20), 1.414 (₹612.95), 1.618 (₹652.85), highlighting possible future price targets after breakout.
• Moving Averages: Two major moving averages (likely 20 EMA and 50 EMA) supporting the uptrend.
• Volume Bars: Indication of recent high volume activities and possible accumulation.
• Market Sentiment: The overall trend remains strongly bullish, but the price is currently testing its trendline resistance. Short-term action depends on whether this resistance is broken or holds.
Summary:
This chart setup provides a comprehensive view for swing traders and investors, focusing on possible breakout levels, critical resistance zones, and momentum confirmation using multiple indicators. The bullish bias is validated by strong trend momentum and the positioning above moving averages, but careful watch is needed near resistance for possible pullbacks or breakout opportunities.
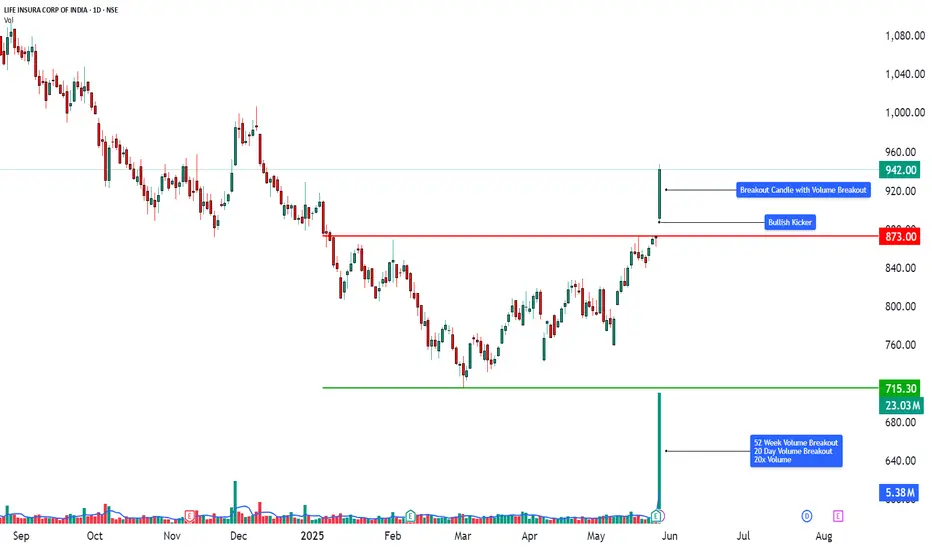
Technical Analysis | Powerful Price Action with Volume Breakout📈 LIFE INSURANCE CORPORATION OF INDIA (LICI) – TECHNICAL ANALYSIS
📆 Date: May 28, 2025
🔍 Timeframe: Daily
________________________________________
Price Action:
LICI surged over 8.12% in today’s session, registering a breakout after weeks of sideways consolidation. The breakout candle was wide-bodied, closing near the day’s high, and supported by a 20-day volume breakout – signaling fresh bullish momentum and accumulation at lower levels.
________________________________________
Chart Pattern / Candlestick Pattern:
• Sideways Consolidation Breakout
• Strong Bullish Candle (Buy Today, Sell Tomorrow setup)
• 52-Week Volume Breakout
• RSI Breakout
• BB Squeeze Exit – Volatility Expansion Phase
• Bollinger Band Expansion + Momentum Surge
• Multiple bullish candlestick patterns across all timeframes = multi-frame trend alignment.
• Gap-Up + Kicker + Long White Candle combo increases conviction of momentum breakout.
• Heikin Ashi continuity indicates a trend in motion without signs of reversal.
________________________________________
Technical Indicators:
• RSI (Daily): 79 – Bullish territory
• MACD: Bullish crossover active
• Stochastic: 97 – Overbought but confirms momentum
• CCI: 206 – Strong upside acceleration
• Volume: 23.03M – Very high vs. 2.24M average, confirms breakout
________________________________________
Support & Resistance Levels:
• Immediate Resistance: ₹964
• Next Resistance: ₹986
• Major Resistance: ₹1024
• Immediate Support: ₹904
• Secondary Support: ₹866
• Major Support: ₹844
• Weak Support Zone: ₹760–₹720
________________________________________
Chart Overview:
This visual representation highlights:
🔸 Clear resistance break with powerful volume
🔸 Bullish momentum confirmed by multiple indicators
🔸 20-day volume breakout indicating accumulation
🔸 Layered resistance levels between ₹964–₹1024
🔸 Tight squeeze breakout offering high R:R setups
________________________________________
Educational Breakdown:
This trade setup showcases:
• Breakout Confirmation: Price + Volume + Momentum Alignment
• Band Expansion: Beginning of volatility trend
• Momentum Shift: From sideways to bullish trend
• Volume Behavior: Institutional interest clearly visible
• Support Layering: Gives fallback levels for pullback traders
Such a chart is a perfect case study in breakout trading, especially post-consolidation and on high volume days.
________________________________________
How to Trade LICI (for learning purpose):
• Entry Example: ₹942.00
• Stop Loss: ₹844.00 (Risk: ₹98.00)
• Target 1: ₹964.00 (Reward: ₹22.00)
• Target 2: ₹986.00 (Reward: ₹44.00)
• Target 3: ₹1024.00 (Reward: ₹82.00)
• Sample Quantity: 50 shares
• RR Ratio: Short-term ~1:0.5; Swing ~1:1 or more
• Aggressive Traders: Can trail stop-loss as price approaches ₹986
• Conservative Traders: Wait for dip toward ₹904 or ₹866 zones
________________________________________
This breakout setup is ideal for swing trades, backed by strong volume and momentum indicators. However, since the RSI and Stochastic are in the overbought zone, traders should manage risk through stop-losses or wait for minor retracements for safer entries.
⚠️ Risk Management Tip: Always trade with a clearly defined stop loss. Avoid entering positions impulsively. It is advisable to start with a smaller quantity and increase your exposure only if the price action confirms the continuation of the trend. Capital protection should always be the priority.
📢 Disclaimer
This content is created purely for educational and informational purposes. It is not intended as investment advice, stock recommendations, or trading tips. Trading and investing in the stock market involves risk. Please consult with a SEBI-registered financial advisor before making any investment decisions. The author/creator is not registered with SEBI and shall not be held responsible for any losses incurred based on this information. Always do your own research and use proper risk management.
👉 If you found this analysis helpful, don’t forget to Follow, so you never miss out on a trade-worthy setup, breakout opportunity, or valuable educational insight again. Stay updated and trade smarter! 💡📈
PIL ITALICA LIFESTYLE LTDAs of May 1, 2025, at 9:20 AM IST, here are the key daily support and resistance levels for Pil Italica Lifestyle Ltd (NSE: PILITA) based on recent technical analysis:
🔹 Support Levels
S1: ₹14.71
S2: ₹14.40
S3: ₹14.02
🔹 Resistance Levels
R1: ₹15.40
R2: ₹15.78
R3: ₹16.09
These levels are derived from the Classic pivot point method, calculated based on the price range of the previous trading day.
Technical Indicators:
RSI (14): 66.92 (Uptrend)
MFI: 88.87 (Strong Uptrend)
CCI (14): 262.93 (Strong Uptrend)
EMA (20): ₹13.37 (Neutral)
EMA (50): ₹12.94 (Uptrend)
EMA (100): ₹12.72 (Uptrend)
EMA (200): ₹12.27 (Uptrend)
These indicators suggest a bullish trend, with the stock trading above key moving averages and strong momentum indicators.
Please note that these levels are based on historical data and are subject to change with market conditions. It's advisable to monitor the stock's price movements and consult with a financial advisor before making any trading decisions.

solarindsLet's analyze **Solar Industries India Ltd. (SolarInds)** from both a **fundamental** and **technical** perspective.
### **Fundamental Analysis of Solar Industries India Ltd. (SolarInds)**
#### **Overview of Solar Industries India Ltd.**
- **Sector:** Chemicals, Industrials
- **Industry:** Explosives, Defense & Aerospace, and Industrial Products
- **Founded:** 1995
- **Headquarters:** Nagpur, Maharashtra, India
- **Market Cap:** Approx. ₹40,000 crore (as per the latest data)
**Solar Industries India Ltd.** is a leading manufacturer of **industrial explosives** and related products. The company is one of the largest producers of explosives in India and has a diverse portfolio that includes products used in **mining**, **construction**, **defense**, and **aerospace** industries. The company also specializes in providing **explosive solutions** for various commercial and military applications.
Key areas of Solar’s operations include:
- **Industrial Explosives:** Solar produces a wide range of explosives for mining, quarries, and construction.
- **Defense:** The company provides solutions for the defense sector, including ammunition and explosive devices.
- **Aerospace & Other:** Solar manufactures various products for the aerospace and defense sectors, such as high-grade explosives and related services.
#### **Key Financials (Latest Report)**
- **Revenue Growth:** Solar Industries has consistently shown strong revenue growth due to its diversified customer base in industries like mining, infrastructure, and defense. Demand for industrial explosives in infrastructure projects and mining has been a significant growth driver.
- **Profitability:** Solar's profitability is solid, driven by strong margins in its high-demand products. The company benefits from its leadership in the industrial explosives sector and has a strong track record of generating healthy profits.
- **Debt Levels:** The company maintains a relatively low level of debt, allowing it to fund its growth and expansion without significant interest burden. Its ability to generate strong operational cash flow supports its debt servicing.
- **Cash Flow & Dividend Yield:** Solar has a strong cash flow from operations, which allows it to reinvest in growth while also rewarding shareholders with consistent dividend payouts.
#### **Valuation Ratios**
- **P/E Ratio:** Solar’s P/E ratio is generally higher than the broader market due to its leadership position in the explosives and defense sectors. This can reflect the market’s expectation of continued growth and profitability.
- **P/B Ratio:** The P/B ratio of Solar is relatively high, indicating that the market values its equity significantly due to its strong asset base and profitability.
- **Dividend Yield:** Solar has a healthy dividend payout ratio, providing attractive dividends for long-term investors.
#### **Industry & Macro Trends**
- **Infrastructure & Mining Demand:** The demand for explosives in mining and infrastructure is strong, particularly in India, which has seen increased investments in infrastructure development, mining, and construction projects.
- **Defense Spending:** Solar’s defense segment benefits from growing defense budgets, both in India and internationally. With increased defense spending in India, Solar is well-positioned to expand its presence in the sector.
- **Government Initiatives:** The government’s push for infrastructure development, especially in roads, railways, and mining, supports long-term demand for Solar's explosives.
- **Regulations & Safety Standards:** As a manufacturer of explosives, Solar is highly regulated. Changes in regulations or safety standards could impact operations and increase compliance costs.
---
### **Technical Analysis of Solar Industries India Ltd. (SolarInds)**
Let’s evaluate the **technical outlook** of Solar Industries based on its price action, key levels, moving averages, and momentum indicators.
#### **Price Action:**
- **Current Price:** Solar Industries has demonstrated strong upward momentum over the years, benefiting from steady demand in its industrial explosives and defense sectors.
#### **Key Levels:**
- **Support Levels:**
- **₹3,200-₹3,300:** This support range has been tested multiple times in the past. A move below this support could suggest further downside potential.
- **₹2,900-₹3,000:** If the stock faces a significant pullback, this is another key support level to monitor.
- **Resistance Levels:**
- **₹3,600-₹3,700:** This level has historically acted as a strong resistance zone. A breakout above this level would signal a bullish trend, potentially leading to further upside.
- **₹3,800:** This is a psychological resistance level, and a breakout above ₹3,800 could lead to a more significant upward momentum in the stock.
#### **Moving Averages:**
- **50-Day Moving Average (50-MA):** If Solar is trading above its 50-day moving average, it suggests short-term bullishness. A price drop below this level could indicate weakening momentum.
- **200-Day Moving Average (200-MA):** The 200-day moving average is a strong indicator of long-term trends. A stock trading above this level signals that the long-term trend remains bullish.
#### **Momentum Indicators:**
- **RSI (Relative Strength Index):**
- An RSI above 70 indicates that the stock could be overbought, and a pullback might be on the horizon.
- An RSI below 30 suggests that Solar Industries might be oversold, signaling a potential buying opportunity if other indicators support it.
- **MACD (Moving Average Convergence Divergence):**
- A positive MACD crossover (when the MACD line crosses above the signal line) would suggest strong bullish momentum.
- A negative MACD crossover could indicate weakening momentum or the potential for a bearish reversal.
#### **Volume Analysis:**
- **Volume Trends:** Rising volume alongside price increases signals strong buying interest, supporting the bullish trend. Conversely, volume spikes during price declines can indicate strong selling pressure.
- **Volume Spikes:** Pay attention to volume spikes near key levels such as ₹3,600-₹3,700 or ₹3,800. A breakout or breakdown accompanied by significant volume could confirm the direction of the next trend.
---
### **Conclusion:**
- **Fundamental Strengths:**
- Solar Industries has a strong foothold in the **industrial explosives** and **defense sectors**, which are expected to continue growing, driven by infrastructure projects and defense spending.
- The company’s financial health, characterized by consistent revenue growth, low debt levels, and strong profitability, supports its long-term potential.
- Government policies promoting infrastructure development and defense spending are favorable for Solar’s business outlook.
- **Technical Outlook:**
- **Support levels:** ₹3,200-₹3,300 (primary), ₹2,900-₹3,000 (secondary).
- **Resistance levels:** ₹3,600-₹3,700 (primary), ₹3,800 (psychological resistance).
- The stock is likely to continue benefiting from strong demand in its key sectors, and a breakout above resistance levels could lead to further upside momentum.
#### **Risks to Consider:**
- **Commodity Price Fluctuations:** Changes in the prices of raw materials (such as chemicals and energy) used in the production of explosives could impact margins.
- **Regulatory Risks:** Stringent safety regulations and compliance requirements for the explosives industry could impact operations and cost structures.
- **Defense and Global Competition:** While Solar enjoys a strong position in the defense sector, it faces competition from both domestic and international players.
---
**Disclaimer:**
The information provided is for educational purposes only and should not be construed as financial or investment advice. I am not a SEBI-registered advisor, and this analysis is not a recommendation to buy, sell, or hold any securities. Accuracy and timeliness of the data cannot be guaranteed. Always conduct your own research or consult with a professional before making investment decisions. I do not take responsibility for any losses incurred.

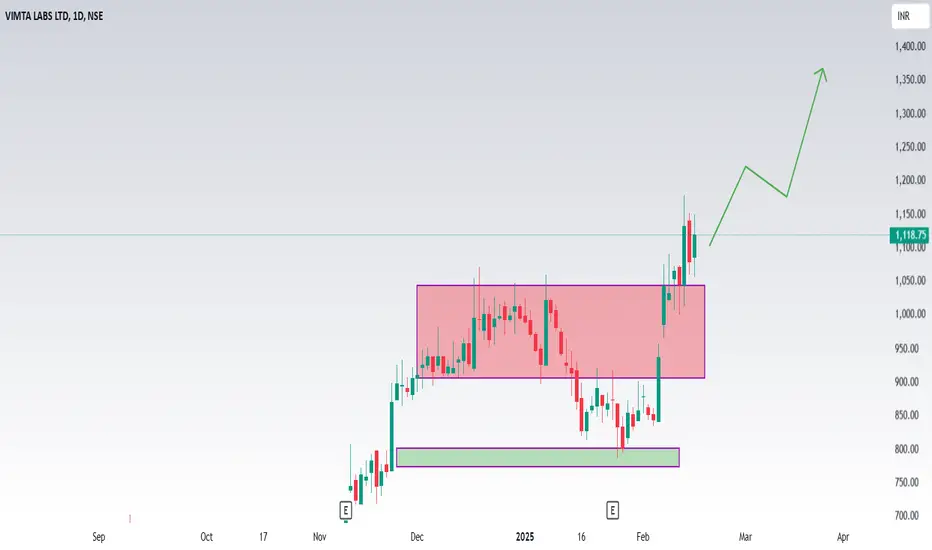
Vimta labs ltdShould I buy VIMTA LABS LTD stock? Our technical rating for VIMTA LABS LTD is buy today. Note that market conditions change all the time — according to our 1 week rating the strong buy trend is prevailing, and 1 month rating shows the strong buy signal.
Vimta Labs Ltd. (NSE: VIMTALABS) is currently exhibiting a strong bullish trend, as indicated by various technical analysis indicators.
**Technical Indicators:**
- **Moving Averages:** All moving averages (5, 10, 20, 50, 100, and 200 periods) are signaling a 'Buy' or 'Strong Buy' position, suggesting sustained upward momentum. citeturn0search2
- **Relative Strength Index (RSI):** The 14-day RSI stands at 89.33, indicating that the stock is in the overbought territory. While this suggests strong momentum, it also implies a potential for price correction. citeturn0search2
- **MACD (Moving Average Convergence Divergence):** The MACD is above the signal line, reinforcing the bullish trend. citeturn0search2
- **Stochastic Oscillator:** The Stochastic Oscillator is in the overbought zone, which may indicate a potential for price pullback. citeturn0search2
**Support and Resistance Levels:**
- **Support:** The stock has support at ₹560. citeturn0search3
- **Resistance:** The resistance level is at ₹1,020. citeturn0search3
**Volume Analysis:**
The stock has experienced high trading volumes at price peaks and lower volumes at price troughs, indicating that price movements are supported by significant trading activity. citeturn0search3
**Conclusion:**
While Vimta Labs Ltd. is currently in a strong bullish phase, the overbought conditions suggested by the RSI and Stochastic Oscillator warrant caution. Investors should monitor these indicators closely, as a price correction could occur if the stock remains in the overbought zone. It's advisable to consider these technical factors alongside fundamental analysis and broader market conditions when making investment decisions.
Unraveling the Chart: A Deep Dive into Infosys' Technical AnalysTechnical Analysis of Infosys Ltd. (INFY)
Overview
Infosys has been on a strong uptrend, with the stock price steadily increasing over the past few years. However, the recent price action suggests a potential short-term consolidation or correction.
Technical Analysis
Let's dive into the technical analysis to understand the potential future movement of INFY:
1. Trend:
* Short-term: The stock seems to be in a consolidation phase, with a slight bearish bias.
* Long-term: A clear uptrend is evident, indicating a bullish sentiment.
2. Support and Resistance Levels:
* Immediate Support: The 1800-1700 INR range appears to be a strong support level.
* Immediate Resistance: The 2000 INR level is a crucial resistance level.
3. Indicators:
* Moving Averages: The 50-day and 200-day moving averages are currently above the price, indicating a bullish trend. However, a bearish crossover might occur if the price falls below the 50-day MA.
* RSI (Relative Strength Index): The RSI is currently above 50, indicating bullish momentum. However, it's not oversold, suggesting that a potential correction might occur.
* MACD (Moving Average Convergence Divergence): The MACD line is above the signal line, indicating a bullish trend. However, a bearish crossover might occur if the MACD line crosses below the signal line.
Potential Future Movement:
Given the current technical indicators and market sentiment, INFY might experience a short-term correction before resuming its uptrend.
Possible Scenarios:
* Bullish Scenario: A sustained move above the 2000 INR resistance level could trigger a new uptrend, with potential targets around the 2200-2300 INR range.
* Bearish Scenario: A breakdown below the 1800-1700 INR support level could lead to a correction, with potential targets around the 1600-1500 INR range.
Disclaimer:
* Technical analysis is not foolproof and should be used in conjunction with fundamental analysis and market sentiment.
* It's important to consider factors like global economic conditions, domestic policies, and industry-specific news while making investment decisions.
* Always consult with a financial advisor before making any investment decisions.
Note: This analysis is based on the current market conditions and technical indicators. Market conditions can change rapidly, and it's essential to stay updated with the latest news and developments.

TEGA: Prior to earnings rally expected📊 NSE:TEGA Technical Analysis - February 5, 2024 📈
Market Overview: 🌐
TEGA Industries, a leader in distribution services and wholesale distributors, has shown significant technical indicators suggesting a bullish 🐂 trend in the National Stock Exchange as of the latest analysis on February 4, 2024.
The last trading price stood at 1186.00 💵.
Technical Indicators: 🛠
EMA & MACD: The Exponential Moving Average and Moving Average Convergence Divergence indicated a buying territory as of February 1, 2024, with a crossover. 📉➡️📈
Parabolic SAR: Continues to indicate a bullish trend. 📈
Fibonacci Levels: Price gained strength from the 0.5 level at 1142.15, closing slightly below the 0.786 level at 1189. 📏
RSI & %R: The Relative Strength Index is in the positive trend, upper band, indicating bullish momentum. 💪
Fisher Transform: Indicates positive territory, supporting the bullish outlook. 📊
Entry & Stop Loss Levels: 🎯
Aggressive Investors: Entry at 1194.70 with a stop loss at the Fibonacci 0.382 level, 1120.70. 🚀🛑
Conservative Investors: Entry at 1224.40 (PO level one) with a stop loss at the Fibonacci 0.5 level, 1142. 🏦🛑
Target Price: 1247.90. 🏦🛑
Market Outlook: 🌤
The broader market positivity supports an uptick for TEGA Industries. The target price, while not explicitly clear, is anticipated to be around 1250 (Target 1) based on current momentum and technical indicators. 🎯📈
Disclaimer: ⚠️
This analysis is for informational purposes only and should not be considered financial advice. Investors should conduct their own research or consult a financial advisor before making investment decisions. Market conditions are subject to change without notice.
#TEGAIndustries #TechnicalAnalysis #StockMarket #Investing #TradingView #BullishTrends #FibonacciLevels #EMA #MACD #RSI ✨

USDJPYIntroduction:
The USD/JPY currency pair, representing the exchange rate between the US Dollar (USD) and the Japanese Yen (JPY), is one of the most traded and closely monitored pairs in the forex market. Traders on TradingView keenly observe the dynamics of this pair for potential trading opportunities, as it often reflects global economic trends and geopolitical developments. In this analysis, we'll delve into the factors influencing the USD/JPY pair and explore possible trading strategies using various technical indicators.
Fundamental Factors Affecting USD/JPY:
Monetary Policy: Both the US Federal Reserve and the Bank of Japan play a significant role in shaping the USD/JPY exchange rate through their monetary policy decisions. Divergence in interest rates between the two economies can lead to substantial movements in the pair.
Economic Indicators: Traders monitor economic indicators such as Gross Domestic Product (GDP), unemployment rates, and consumer sentiment reports from both countries. Strong US economic data relative to Japan's can lead to USD appreciation against the JPY.
Safe-Haven Status: The Japanese Yen is often considered a safe-haven currency, sought b

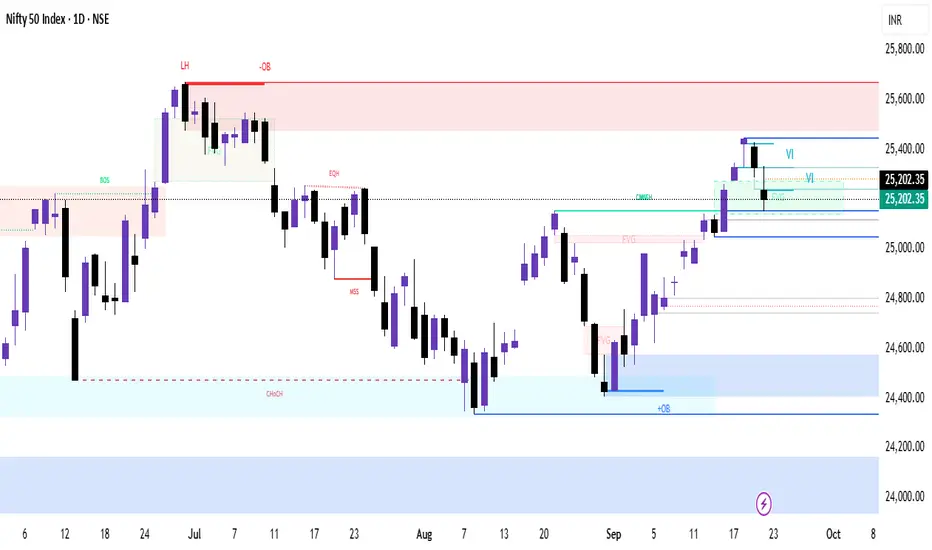
Nifty Technical Analysis – 23 September 2025🕒 1-Day Chart
Support Levels:
25,200: Immediate support; bulls need to defend this level.
25,050: Critical support; a break below this could lead to further downside.
Resistance Levels:
25,300: Immediate resistance; a breakout above this could lead to a rally.
25,450–25,500: Key resistance zone; bulls need to reclaim this for a bullish trend.
Technical Indicators:
RSI is below 60, indicating weakening momentum.
MACD shows a bearish crossover, suggesting potential downside.
Market Sentiment:
The index formed a bearish candle with a long upper shadow, indicating selling pressure at higher levels.
The index is trading below the 10-day EMA, suggesting a short-term downtrend.
🕓 4-Hour Chart
Support Levels:
25,150: Immediate support; a break below this could lead to further downside.
25,000: Strong support; bulls need to defend this level.
Resistance Levels:
25,300: Immediate resistance; a breakout above this could lead to a rally.
25,450: Key resistance; bulls need to reclaim this for a bullish trend.
Technical Indicators:
RSI is below 60, indicating weakening momentum.
MACD shows a bearish crossover, suggesting potential downside.
Market Sentiment:
The index is trading below the 10-period EMA, suggesting a short-term downtrend.
🕐 1-Hour Chart
Support Levels:
25,150: Immediate support; a break below this could lead to further downside.
25,000: Strong support; bulls need to defend this level.
Resistance Levels:
25,250: Immediate resistance; a breakout above this could lead to a rally.
25,400: Key resistance; bulls need to reclaim this for a bullish trend.
Technical Indicators:
RSI is below 60, indicating weakening momentum.
MACD shows a bearish crossover, suggesting potential downside.
Market Sentiment:
The index is trading below the 10-period EMA, suggesting a short-term downtrend.
🕒 15-Minute Chart
Support Levels:
25,150: Immediate support; a break below this could lead to further downside.
25,000: Strong support; bulls need to defend this level.
Resistance Levels:
25,250: Immediate resistance; a breakout above this could lead to a rally.
25,400: Key resistance; bulls need to reclaim this for a bullish trend.
Technical Indicators:
RSI is below 60, indicating weakening momentum.
MACD shows a bearish crossover, suggesting potential downside.
Market Sentiment:
The index is trading below the 10-period EMA, suggesting a short-term downtrend.
#BANKNIFTY - 8TH NOVEMBER!!NSE:BANKNIFTY
#NIFTYBANK ⚡
Observe, understand, then implement 👍🏻
Chart contains support and resistance levels (understand how it works 👇🏻)
Support and resistance are key concepts in technical analysis used to identify potential price levels where assets may reverse or stall.
Support:
-Definition: A support level is a price point where buying interest is strong enough to overcome selling pressure, preventing the price from falling further.
- Indicators: Support levels can be identified through historical price data, trend lines, or moving averages.
- Behavior: When a price approaches support, it may bounce back up. If broken, it can become a new resistance level.
Resistance:
- Definition: A resistance level is a price point where selling interest is strong enough to overcome buying pressure, preventing the price from rising further.
- Indicators: Similar to support, resistance levels can be identified through past price action, trend lines, or moving averages.
- Behavior: When the price approaches resistance, it may retreat. If broken, it can turn into a new support level.
Importance:
- Trade Decisions: Traders use these levels to make buy or sell decisions, set stop-loss orders, and identify potential profit targets.
- Market Psychology: Support and resistance levels reflect market sentiment and the balance between supply and demand.
Understanding these concepts can enhance trading strategies and improve decision-making.
P.S note : im not SEBI REGISTRAR 🙏🏻
Any doubt 👉🏻 @thetradeforecas@thetradeforecastY
#NIFTYBANK ⚡
Observe, understand, then implement 👍🏻
Chart contains support and resistance levels (understand how it works 👇🏻)
Support and resistance are key concepts in technical analysis used to identify potential price levels where assets may reverse or stall.
Support:
-Definition: A support level is a price point where buying interest is strong enough to overcome selling pressure, preventing the price from falling further.
- Indicators: Support levels can be identified through historical price data, trend lines, or moving averages.
- Behavior: When a price approaches support, it may bounce back up. If broken, it can become a new resistance level.
Resistance:
- Definition: A resistance level is a price point where selling interest is strong enough to overcome buying pressure, preventing the price from rising further.
- Indicators: Similar to support, resistance levels can be identified through past price action, trend lines, or moving averages.
- Behavior: When the price approaches resistance, it may retreat. If broken, it can turn into a new support level.
Importance:
- Trade Decisions: Traders use these levels to make buy or sell decisions, set stop-loss orders, and identify potential profit targets.
- Market Psychology: Support and resistance levels reflect market sentiment and the balance between supply and demand.
Understanding these concepts can enhance trading strategies and improve decision-making.
P.S note : im not SEBI REGISTRAR 🙏🏻
Any doubt 👉🏻 @thetradeforecast
