Infosys good for swing. 1:3 RR with strict SL. Infosys good for swing. 1:3 RR with strict SL. Target 1580
Search in ideas for "INFOSYS"

INFOSYS- FALLING WEDGE PATTERN BREAKOUTInfosys ltd long consolidation falling wedge pattern breakout
short term investment plan
expecting target - 2548
pattern - falling wedge
breakout status - yes
last trading price - 1491 rs
I'm planning 2 target for this script.....
one is previous all time high, which means 1863 rs
second target is based on fib-extension level 1.0 range, which means 2548 rs....


INFOSYS- INVERTED HEAD & SHOULDER FINAL LEG FORMATION IN WEEKLYINFOSYS- Look like inverted head & shoulder final leg formation in weekly chart
& already bounce from support levels.
Near by resistance is 200 ema, when it break stock will shoot up to target 1 - 1645
And when the h&s neckline break long term bull run can be expected target 2 - 1900

Infosys trendline patternInfosys seems to be following the trendline pattern, ideally it should be bullish from here

Infosys BullishInfosys Seems Bullish
Entry - 1375 - 1425
SL - 1277
Target - 1588 / 1839 / 2088
Time Frame: 6-12 months

INFOSYS 1D TIME FRAMEINFOSYS Looking good for upside..
When it break level 1330 and sustain.. it will go upside...
BUY@ 1330
Target
1st 1360
2nd 1388
HOLD FOR A MONTH FOR TARGET
POSITIONAL TRADE..
GOOD FOR HIGHER PROFIT..

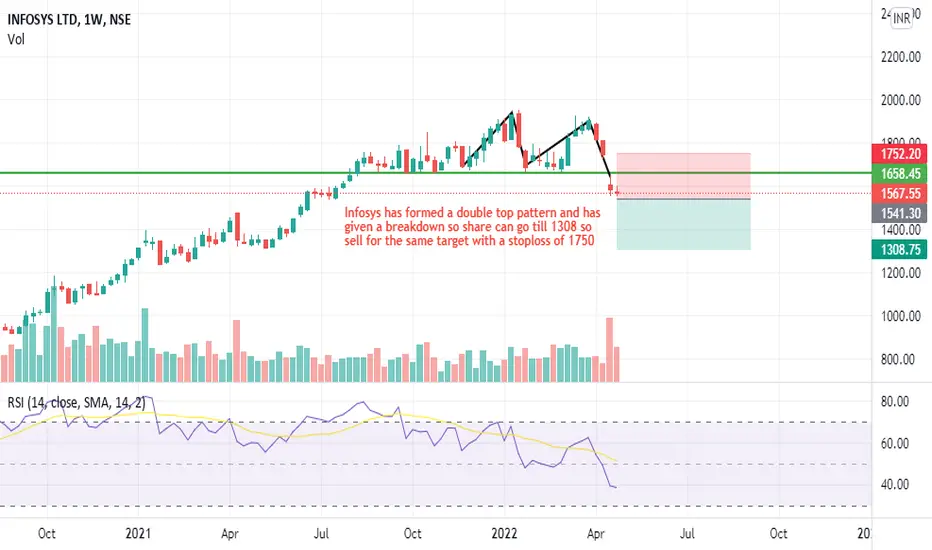
Infosys - Major BreakdownInfosys has given a major breakdown below 1750 and has formed a double top pattern before breakdown so can go shorting the same.
NOTE - PLEASE TRADE ON YOUR OWN RISK IN CONSULTATION OF YOUR FINANCIAL ADVISOR
Infosys Crash 11%, 35% down since ATHInfosys Crash 11%, 35% down since ATH
Trend : Bearish
Fundamentals : Weak Quarter results, Outlook Downgrade by Nomura and CITI Research
Strong Resistance : 1350-1450,
Support : 1150-1100
Trading Zone : 1350-1150..
Daily chart formed Hammer, invalid below 1180
Accumulation Zone for long term Holding, SIP Level - 900-1300

INFOSYS IN CORRECTIONINFOSYS IN CORRECTION
Zig Zag pattern in continuation
5-3-5
5-3 completed, next leg under progress.
It's an analysis , not a trading advice. Trade with due diligence.

INFOSYS 15minINFOSYS Looking good for upside..
When it break level 1428 and sustain.. it will go upside...
BUY INFY @1428
Target
1st 1434
2nd 1442
Enjoy trading traders.. Keep add this STOCK in your watch list..
Investor are welcome..

Infosys Institutional Zone Infosys is currently on a crazy support, this is not just any support, it is an institutional support where price has run up 17% and 19% in the past in just
1-2 months.
1. Falling volume- as price approached this area, selling pressure weakened out and candles became smaller with larger wicks. Which is a bullish sign
Entry- After it Breaks Away
Stop loss- Below the consolidation
Target- 1617
Keep It Simple

#Infosys Supply/ Demand Zone#Infosys
Updated Supply/ Demand Zone
CMP:1420 @14 March 2023
Disclaimer: This is not an investment recommendation, advice, research report, or stock tip of any nature. I am doing this only to understand how to read charts and technicals. Strictly for educational purposes only.

Infosys - Long TermInfosys looking good for long term above 1663 with SL of 1370
SL is based on fibonacci Number
Its showing good strength for Long Term Holding
Coclusion :
Entry - Above 1663
Target -Open
SL - 1370
Pls follow if you like my analysis and do check other charts published

Infosys Positional Short Trade Setup!Infosys Face Strong Hurdle Near ~ 50% Fibonacci Retracement Level, Sell Positional~ 1515, Stop ~ 1550, Target ~ 1425, Expected Target Jan Expiry.


Infosys taken support !!Infosys took the support of Trendline and Support line.
Soon will going to see an upwards movement in INFY.
The target price will be near to 2nd Resistance = 1750.


INFOSYS rising wedge breakdown target 3800!Looks weak from here if it breaks this rising wedge I'd short it with sl of the trendline. Although must wait for it to break with good volumes or can trap sellers!!

Infosys Breaking Out from Consolidation Infosys Breaking from consolidation after long time, One can go long for a swing keeping a stop loss of 1499/-
Stock Also forming higher high on 1h time frame with Cup and Handle breakout with decent volume.

Infosys BullishInfosys Seems inverted H & S in weekly
concentrate for short term, swing etc
if price sustain above 1550 in daily
