INFOSYS Parallel Channel pattern formed in 1hr chartINFOSYS Parallel Channel pattern formed in 1hr chart
Search in ideas for "INFOSYS"

Infosys heading towards 1600Infosys has formed Inverse Head and Shoulder Pattern on lower timeframe, however its in Wave 5 which should give target of 1400, 1600 on higher timeframe with SL: 1050

Infosys - impulse Wave - LongInfosys Daily time frame chart has formed impulse wave.
If the script breakout the trendline and move upward there may be chance of upward movement or if the correction go pass.
Entry above the script breakout at close in the daily time frame.
Entry - 1145
SL - 1090
Target - 1220.
Disclaimer: Kindly do your own analysis before executing the trade


Infosys Ltd. WEEKLY CHART VIEWInfosys Ltd.
The stock price maintaining bullish momentum above 5 MA: 945 ahead of 990- 1000 zone resistance breakout.
Breakout with sustainable trading above 1000 may increase more positive sense on the upside.
On the lower side 950- 940 should consider as immediate supports.

INFOSYS Intraday viewInfosys has made a perfect set up for buying in coming days
Looks good above 945, Can touch 955 and 960 ++++ on Monday Trading sessions
If you call closely watch, @ 942 has been acting as a good S&R from 20th July.
Possibly the stock should bounce from these levels and we should be able to achieve the targets in intraday itself
All these levels are strictly for educational purpose only, I share my knowledge & learning
If you like it then please do not forget to like & subscribe to my profile, I shall be putting a lot of analysis for you all.
Note:- if you have any doubts please comment on the same, i shall reply back to you soon.


Infosys (Will it break its high or reverse)Infosys has been consolidating nearby its all time high and has been forming a triangle. A breach of it on either side can give a good trade. A breach towards the upside will be looked at with close eyes on whether the stock will be able to break through its all time high of 986.45 or not and a break to the downside will be looked upon as a possible gap fill. Either way the trades can surely be trailed and a momentum can lead to a good big move as well

Infosys Ltd. Infosys Ltd.
Technically price trading with in small pennant formation since past three trading weeks.
As of now 974 - 986.40 are important resistances in front of the price, where 940 - 942 are immediate support.
Breakout of this mentioned support resistance zone may unfold fresh momentum.


Infosys Ltd. - WEEKLY CHART!Infosys Ltd. Insider bar pattern clearly visible with low volume.
Technically 975 -990 are immediate resistances.
Sustainable breakout above 1000 may lead the underlying positive momentum more on the higher side. on the lower side 920 -938 are immediate supports.
FOR COMPLETE STOCK ANALYSIS, INTRADAY LEVELS AND FOLLOW-UP. CONTACT ME!!

Infosys Ltd. - WEEKLY CHART!!Infosys Ltd. The stock price produced sustainable breakout above 925 with low volume.
More higher side above 1000 with support by increased volume may help the price to extend positive momentum more on the higher side.
942 - 925- 918 -900 likely to act as support for now.
FOR COMPLETE STOCK ANALYSIS, INTRADAY LEVELS AND FOLLOW-UP. CONTACT ME!!


Infosys- shortInfosys formed a rising wedge on daily charts with the last day closing on the edge of the Bollinger Bands (with 3 std deviations).
If it does not break 770 with volume, it will fall back towards lower trend line of 725 levels. However, if it does break 770 with volume, it will rise to 810 levels.
The strong gain made by Rupee on Friday along with the daily charts formation makes for a bearish outlook on the stock.
The above is for educational purposes only.

Infosys Ltd. - B above 752 SL 715 TGT 776/800/805Infosys Ltd.
The stock has a strong bullish sentiment as the price gave a breakout of the channel and closed near the weekly high.
Technical indicators are strong and volume levels are high.
RSI is above 60-level.
TT2 240m and Daily Trend are BULLISH.
Above 752, we might see further upmove. As of now 776 -800 -805 can be considered as resistance. On the lower side, 715 can be considered as support.
KEEP AN EYE!!
***this is my personal view. Please take advice from your financial advisor before investing.

Infosys Ltd. - WEEKLYInfosys Ltd.
The stock price is trading within the lower side of the rising channel.
Technically 675 - 730 are to be considered as immediate support and resistance respectively for the price presently.
Above 730 resistances are 750 - 775. On the lower side major supports are 653 -645.
KEEP AN EYE!!
#tradingedge_academy #SMTA_institute
***this is my personal view. Please take advice from your financial advisor before investing.


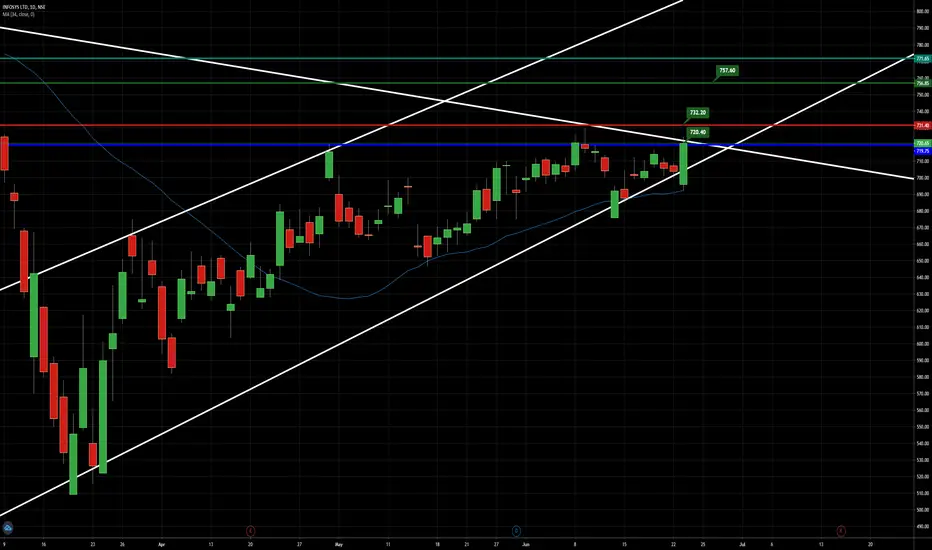
Infosys Ltd. - WEEKLY VIEWInfosys Ltd.
There is no proper direction in the price momentum which continues consolidating within a rising channel.
Technically, the price has breached 5MA:680 and has closed near the weekly high.
701 needs to be considered an immediate resistance. Above that 720 - 733(50MA) need to be considered as the next possible hurdles.
680 - 653 -646 may act as support for the price.
KEEP AN EYE!

Infosys in Bullish channel#Infosys in Bullish channel. Breakout of Triangle will decide the further move.

