Infosys will dive you in the sea of Profit !!! check out Hi Guys!!!
IT is doing good so do the infosys... Infosys is giving round pattern breakout. I recommend to buy at the level of 1617 to 1640 for the positional target of 1800. The hold time would be around 6-8 months. The SL will 1585.
Thanks
Search in ideas for "INFOSYS"

infy box breakout infosys box breakout only above 1462 above closing
will lead to 1528-1544
short term trade
dc: only for educational purpose

Infosys Ltd Breakout Fail Infosys Chart Analysis with Targets
Infosysy Given Breakout above 1560 Level , But Price not sustained & Breakout Fail . on Weekly Time Frame .
Down Side First Target is 1470
First Support Zone - 1346-1375

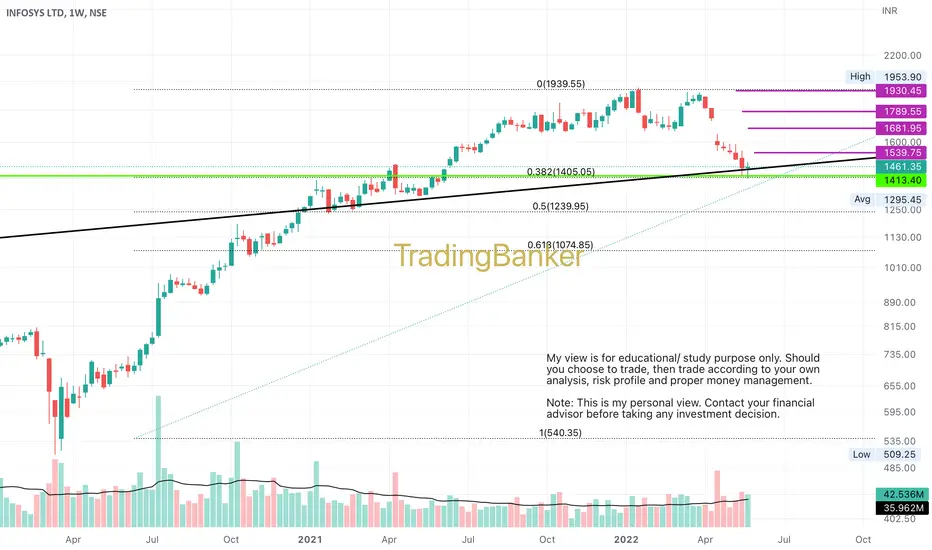
Infosys: a probable long tradeInfy #infy the reason I had shared that I wish to take entry in #infosys around 1415 is this. Fibb level plus long term trendline (from monthly tf since the year 2000) support. I hope a stronger USD gives a boost to the financials this quarter.
INFOSYS: IntradayPrice action analysis for Intraday Trading.
Price is consolidating in a parallel channel for quite a few days. From the lower side either there can be support or a fresh breakdown could give a good move.

INFOSYS: Impulsive rise, ready for 5th waveStock is rising in an impulsive fashion , as wave 12345 with wave 4 as triangle. One should go long on cmp, with SL of 1547 for the minimum target of 1592 & above 1592 look for 1625/1655.
NOTE: wave 4 in an impulse suggests that trend is going to exhaust soon after a new high. One should be very careful and book profits early.

INFOSYS - LOWER PARALLEL LINE CHANNELAs you see in the weekly chart the price following the parallel line channel, whenever the the price touches the upper end of the channel it gets pulled towards the lower end and vice versa.
Now, the price is at the lower end of the channel, giving opportunity for investors to get in the stock for long term.

Infosys Sideways trend capture #Ep1 #LetsMakeMoneyTogetherA good and bullish candle . i.e, prefer a pinbar or an engulfer on 1330 lvls . will establish a buy for the IT giant INFY .... As trend is suggesting .... buy low and sell high in this sideways mkt of infy . For positional purpose : Hold on 1380 lvls to see if it breaks it, educational note : it might note break it in one go but might consolidate there with a pattern .... things will be updated here as per :)
Also if it directly goes and breaks 1380 lvls which is highly unlikely scenario, but if happens go long instantly it might make better money than the sideways trend :)

INFOSYS: BUY/ SELL Algo demonstrationHOW TO FOLLOW ALGO SIGNAL:
Deciding buy/sell
1.Strictly use only on 1 hour time frame.
2.Wait for a ‘X’ sign before mind make up. A red ‘X’ means look for selling opportunity , a green ‘X’ means look for buying opportunity.
Taking a position:
3.Wait for an arrow before entering into any position. A red arrow on upside of a bar pointing downward means open short position. A green arrow below the bar pointing upward means open buy position.
4.NOTE: Only after the the signalling of X , look for arrow. Do not buy/sell if you see any arrow before the signal of X.
5.STOP LOSS should be the most recent swing high/low or most recent STRONG CANDLE’S high/low.
While maintaining the position :
6.The small triangles after the each bar completion tells you to hold the position. The red triangles appearing upside on the bar tells you to hold the short position, whereas the green triangles appearing below the bars tells you to hold the long position.
Exiting the position:
7.After you create a buy position , if you see a green arrow above any bar pointing downward, then you should either book partially/leave the position for sometime. You will get another signal to re-enter.
8.Similarly, after you create a sell position , if you see a red arrow below any bar pointing upward, then you should either book partially/leave the position for sometime. You will get another signal to re-enter.
9.While being in position if you see any X signal which is opposite of your trade , then leave your position immediately.
10.When you see a big red circle dot then you must exit all your short positions. Contrary , when you see a big green circle dot , you must exit all your long positions. And then wait for a X-signal.
No Trading Zone:
11.When you get frequent X-signals in green-red-green-red & that too very close, then its means that stock is going to form a range. One should wait for the range break & move away to another stock. (THIS IS WHERE YOU WILL REQUIRE A PRACTICE TO IDENTIFY THE RANGE)

Infosys ltd short on the wayNSE:INFY
if u find reversal befor that blue line one can book their long and can short as well.

INFOSYS: EXPANDED FLAT CORRECTION (Bearish sequence)Sell with the SL of 1210 for the target of 1115/1080/1050

INFOSYS: ALGO BUY SIGNALHOW TO FOLLOW ALGO SIGNAL:
Deciding buy/sell
1.Strictly use only on 1 hour time frame.
2.Wait for a ‘X’ sign before mind make up. A red ‘X’ means look for selling opportunity , a green ‘X’ means look for buying opportunity.
Taking a position:
3.Wait for an arrow before entering into any position. A red arrow on upside of a bar pointing downward means open short position. A green arrow below the bar pointing upward means open buy position.
4.NOTE: Only after the the signalling of X , look for arrow. Do not buy/sell if you see any arrow before the signal of X.
5.STOP LOSS should be the most recent swing high/low or most recent STRONG CANDLE’S high/low.
While maintaining the position :
6.The small triangles after the each bar completion tells you to hold the position. The red triangles appearing upside on the bar tells you to hold the short position, whereas the green triangles appearing below the bars tells you to hold the long position.
Exiting the position:
7.After you create a buy position , if you see a green arrow above any bar pointing downward, then you should either book partially/leave the position for sometime. You will get another signal to re-enter.
8.Similarly, after you create a sell position , if you see a red arrow below any bar pointing upward, then you should either book partially/leave the position for sometime. You will get another signal to re-enter.
9.While being in position if you see any X signal which is opposite of your trade , then leave your position immediately.
10.When you see a big red circle dot then you must exit all your short positions. Contrary , when you see a big green circle dot , you must exit all your long positions. And then wait for a X-signal.
No Trading Zone:
11.When you get frequent X-signals in green-red-green-red & that too very close, then its means that stock is going to form a range. One should wait for the range break & move away to another stock. (THIS IS WHERE YOU WILL REQUIRE A PRACTICE TO IDENTIFY THE RANGE)

Infosys | BUYBy posting one of the biggest monthly gain - which resulted in stock making new lifetime high - the bulls have made their intent very clear. Nevertheless, the stock has been consolidating since the beginning of the month. Since the major trend is bullish and ₹950 levels is a good support, the stock is highly likely to bounce strongly.

INFOSYS - WAIT FOR BREAKOUTThis week has been a profit booking week. Overall trend - positive and bullish. This is more like retracement and consolidation move, wait for breakout and see the price again to a new 52 week high. Constantly taking support of 50 day ema so keep an eye on it as dynamic support and resistance.

Infosys - Wedge pattern breakoutNote: This is for educational purpose only.
There seems to be a bullish wedge pattern breakout with spike in volume. RSI above 60 is additional point to support this breakout.

Infosys swing trade Refer chart for levels
Buy if it sustains 646-653 for the targets of
(678-685) / (694-700) / (713-720)

Infosys - Supply and Demand zoneDear Trades,
We are expecting a huge negative impact on infosys because of allegations against CEO second tie in the history, So the stock will react to this news negatively. I here by plotted the Demand Zone levels for the same, we will buy this area to cover the loss for short term uptrend once it should reach the defined area. Overall market is bearish on Infosys. Sell on rally is the current scenario.


Infosys short target expected
So you're looking for a short trade in Infosys. Short trades can be exciting, but it's important to do thorough research and analysis before making any decisions. Keep an eye on the stock's price movement and look for potential entry and exit points. Remember to set stop-loss orders to manage your risk. Best of luck with your trade! 🤞📉

Infosys - Support Zone Identified in 30 minute TimeframeHello traders, I have noticed a support zone in a 30-minute timeframe for Infosys. All details are evident on the chart. Looking forward to your comments.

INFOSYS .Head and shoulder breakdown.Obviously appreciation of dollar dxy is not helping IT stocks
as there is immence pressure due to economic out look in US.
Our IT stocks are just the reflecting the sentiment prevailing in US.
Though our banking stocks exhibiting lot more resilence our IT stocks are not.
There is clear head and shoulder breakdown has taken place in infosys.
Yesterday in Nasdaq it has witnessed selling.
Probable target shown in the chart.
This is my study not any trading recommendation.
Don't forget to like this post.
Follow me to get updates.

Infosys lTD to take long entryNow turn for IT sector booming. Long after the BO of Inverse head and should pattern after the BO of Neckline. For the very huge target with minimum risk. Very good risk-to-reward trade setup. This is for your educational purpose only.

infosys current trend update on daily chart infosysy trend update posted back.
now updated chart to watch its movement upward or retrace?? .
(a gapup seen today )
decide on ur own .
