Nifty Futures 28th June 2023Observe where the day opens tomorrow. Price action should be watched, and a decision taken accordingly.
Will try and give some live market updates.
Keep following to understand the significance of these lines drawn and how and why these lines are very important.
Please go through the previous charts and check the price action and how these lines responded vis a vis the days open
Search in ideas for "NIFTY FUTURE"

NIFTY FUTURES 27TH JUNE 2023Let's see how the day opens tomorrow. Price action should be watched, and a decision taken accordingly.
Will try and give some live market updates.
Keep following to understand the significance of these lines drawn and how and why these lines are very important.
Please go through the previous charts and check the price action and how these lines responded vis a vis the days open

Nifty Futures 26th June 2023It would be very interesting to observe what happens when
1. Price opens within the range marked of Red, Blue and Green Lines.
2. Price opens below / above the range but within the range of the previous day
3. When there is a Gap up and Gap down opening.
If You are studying the charts in lower Time frames and observing price action, Let me know in comments your observations on the points 1,2 and 3 mentioned above.
Keep Following for LIVE UPDATES

Nifty Futures 23rd June 2023It would be very interesting to observe what happens when
1. Price opens within the range marked of Red, Blue and Green Lines.
2. Price opens below / above the range but within the range of the previous day
3. When there is a Gap up and Gap down opening.
If You are studying the charts in lower Time frames and observing price action, Let me know in comments your observations on the points 1,2 and 3 mentioned above.
Keep Following for LIVE UPDATES

Nifty Futures 22nd June 2023 EXPIRYIt would be very interesting to observe what happens when
1. Price opens within the range marked of Red, Blue and Green Lines.
2. Price opens below / above the range but within the range of the previous day
3. When there is a Gap up and Gap down opening.
If You are studying the charts in lower Time frames and observing price action, Let me know in comments your observations on the points 1,2 and 3 mentioned above.
Keep Following for LIVE UPDATES

Nifty Futures 22nd June 2023Let's see how the day opens tomorrow. Price action should be watched, and a decision taken accordingly.
Will try and give some live market updates.
Keep following to understand the significance of these lines drawn and how and why these lines are very important.
Please go through the previous charts and check the price action and how these lines responded vis a vis the days open
Nifty Futures 20th June 2023Lets see how the day opens on Monday. Price action should be watched and a decision taken accordingly.
Will try and give some live market updates.
Keep following to understand the significance of these lines drawn and how and why these lines are very important.
Please go through the previous charts and check the price action and how these lines responded vis a vis the days opening.

Nifty futures current regression channelNifty fut is moving a rising regression channel post the gap up from 26-May-2023

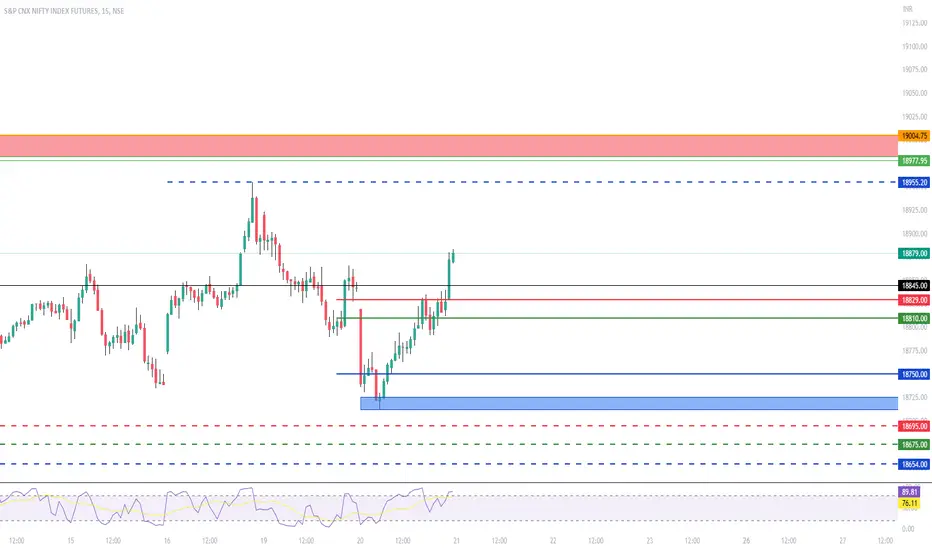
Nifty Futures 19th June 2023Nifty has given an excellent close on the previous trading day. We do see a strong support and volumes at the 18860 to 18880 levels.
Lets see how the day opens on Monday another strong support is the blue rectangle. Price action should be watched at these supports and a decision taken accordingly.
Will try and give some live market updates.
Keep following to understand the significance of these lines drawn and how and why these lines are very important.
Please go through the previous charts and check the price action and how these lines responded vis a vis the days opening.

NIFTY FUTURES 16th JUNE 2023It would be very interesting to observe what happens when
1. Price opens within the range marked of Red, Blue and Green Lines.
2. Price opens below / above the range but within the range of the previous day
3. When there is a Gap up and Gap down opening.
If You are studying the charts in lower Time frames and observing price action, Let me know in comments your observations on the points 1,2 and 3 mentioned above.
Keep Following for LIVE UPDATES

Nifty Futures 14th June 2023I have posted enough Charts here for one to see how the price responds at the lines marked.
We can go down to lower Time frames of 5 min and 3 min to study the price action .
It would be very interesting to observe what happens when
1. Price opens within the range marked of Red, Blue and Green Lines.
2. Price opens below / above the range but within the range of the previous day
3. When there is a Gap up and Gap down opening.
Constant visualization and practice makes one familiar with what type of price action can come and what type of the day it can be.
The dotted lines can be tagged by price as these are untouched area where price can probably reach depending upon upward or downward movement.
Further studying the OI and unwinding on either side can help in deciphering a directional move. Along with the charts the study becomes more interesting.
14 hours ago
Comment:
If You are studying the charts in lower Time frames and observing price action, Let me know in comments your observations on the points 1,2 and 3 mentioned above.

Nifty Futures Levels 14th June 2023I have posted enough Charts here for one to see how the price responds at the lines marked.
We can go down to lower Time frames of 5 min and 3 min to study the price action .
It would be very interesting to observe what happens when
1. Price opens within the range marked of Red, Blue and Green Lines.
2. Price opens below / above the range but within the range of the previous day
3. When there is a Gap up and Gap down opening.
Constant visualization and practice makes one familiar with what type of price action can come and what type of the day it can be.
The dotted lines can be tagged by price as these are untouched area where price can probably reach depending upon upward or downward movement.
Further studying the OI and unwinding on either side can help in deciphering a directional move. Along with the charts the study becomes more interesting.
14 hours ago
Comment:
If You are studying the charts in lower Time frames and observing price action, Let me know in comments your observations on the points 1,2 and 3 mentioned above.

Nifty Futures Levels 13th June 2023I have posted enough Charts here for one to see how the price responds at the lines marked.
We can go down to lower Time frames of 5 min and 3 min to study the price action .
It would be very interesting to observe what happens when
1. Price opens within the range marked of Red, Blue and Green Lines.
2. Price opens below / above the range but within the range of the previous day
3. When there is a Gap up and Gap down opening.
Constant visualization and practice makes one familiar with what type of price action can come and what type of the day it can be.
The dotted lines can be tagged by price as these are untouched area where price can probably reach depending upon upward or downward movement.
Further studying the OI and unwinding on either side can help in deciphering a directional move. Along with the charts the study becomes more interesting.

Nifty Futures 11th June 2023I have posted enough Charts here for one to see how the price responds at the lines marked.
We can go down to lower Time frames of 5 min and 3 min to study the price action .
It would be very interesting to observe what happens when
1. Price opens within the range marked of Red, Blue and Green Lines.
2. Price opens below / above the range but within the range of the previous day
3. When there is a Gap up and Gap down opening.
Constant visualization and practice makes one familiar with what type of price action can come and what type of the day it can be.
The dotted lines can be tagged by price as these are untouched area where price can probably reach depending upon upward or downward movement.
Further studying the OI and unwinding on either side can help in deciphering a directional move. Along with the charts the study becomes more interesting.

Nifty Futures Levels 8th June 2023Special markings in Red, blue and Green solid lines are very important areas and opening of the trade in the morning gives us a reasonable idea along with other factors as to how the day should proceed.
If you have been following the levels from the previous charts by now you would have seen the importance of how correctly marked areas worked .
we can visualize from the chart where a trade with defined risk can be taken.
The dotted lines in red blue and green can be tagged incase of a break on either side. The dotted lines ate the untouched VAH, VAL or poc which can be tagged.
If you carefully watch the previous charts you will understand how the dotted lines get tagged during the course of the day
Keep following for live market updates.
Follow the chart in 5 min and 3 min time frame also

Nifty Futures Levels 6th June 2023Special markings in Red, blue and Green solid lines are very important areas and opening of the trade in the morning gives us a reasonable idea along with other factors as to how the day should proceed.
If you have been following the levels from the previous charts by now you would have seen the importance of how correctly marked areas worked .
we can visualize from the chart where a trade with defined risk can be taken.
The dotted lines in red blue and green can be tagged incase of a break on either side. The dotted lines ate the untouched VAH, VAL or poc which can be tagged.
If you carefully watch the previous charts you will understand how the dotted lines get tagged during the course of the day
Keep following for live market updates.
Follow the chart in 5 min and 3 min time frame also

Nifty Futures Levels 5th June 2023Special markings in Red, blue and Green solid lines are very important areas and opening of the trade in the morning gives us a reasonable idea along with other factors as to how the day should proceed.
If you have been following the levels from the previous charts by now you would have seen the importance of how correctly marked areas worked .
we can visualize from the chart where a trade with defined risk can be taken.
The dotted lines in red blue and green can be tagged incase of a break on either side. The dotted lines ate the untouched VAH, VAL or poc which can be tagged.
If you carefully watch the previous charts you will understand how the dotted lines get tagged during the course of the day
Keep following for live market updates.

Nifty Futures 2nd June 2023Special markings in Red, blue and Green solid lines are very important areas and opening of the trade in the morning gives us a reasonable idea along with other factors as to how the day should proceed.
If you have been following the levels from the previous charts by now you would have seen the importance of how correctly marked areas worked .
we can visualize from the chart where a trade with defined risk can be taken.
The dotted lines in red blue and green can be tagged incase of a break on either side. The dotted lines ate the untouched VAH, VAL or poc which can be tagged.
If you carefully watch the previous charts you will understand how the dotted lines get tagged during the course of the day
Keep following for live market updates.

Nifty Futures Levels 31st May 2023Will explain in detail to all those following what are these lines in different colors and how price reacts. Also how prices get tagged on the dotted lines. But first it is important to observe the behavior of price on the Charts being published by me.
Special markings in Red, blue and Green solid lines are very important areas and opening of the trade in the morning gives us a reasonable idea along with other factors as to how the day should proceed.
If you have been following the levels from the previous charts by now you would have seen the importance of how correctly marked areas worked .
we can visualize from the chart where a trade with defined risk can be taken.
The dotted lines in red blue and green can be tagged incase of a break on either side. The dotted lines ate the untouched VAH, VAL or poc which can be tagged.
If you carefully watch the previous charts you will understand how the dotted lines get tagged during the course of the day
Keep following for live market updates.

Nifty Futures Levels 28th May 2023Special markings in Red, blue and Green solid lines are very important areas and opening of the trade in the morning gives us a reasonable idea along with other factors as to how the day should proceed.
If you have been following the levels from the previous charts by now you would have seen the importance of how correctly marked areas worked .
we can visualize from the chart where a trade with defined risk can be taken.
The dotted lines in red blue and green can be tagged incase of a break on either side. The dotted lines ate the untouched VAH, VAL or poc which can be tagged.
If you carefully watch the previous charts you will understand how the dotted lines get tagged during the course of the day
Keep following for live market updates.

Nifty Futures 25.04.23Special markings in Red, blue and Green solid lines are very important areas and opening of the trade in the morning gives us a reasonable idea along with other factors as to how the day should proceed.
If you have been following the levels from the previous charts by now you would have seen the importance of how correctly marked areas worked .
we can visualize from the chart where a trade with defined risk can be taken.
The dotted lines in red blue and green can be tagged incase of a break on either side. A gap up should be bullish and its important to follow price action and wait for a proper entry. ANY GAP DOWN BELOW THE SUPPORT AT 18266 /green area should be bearish and again price action will be important. The dotted lines ate the untouched VAH, VAL or poc which can be tagged.
If you carefully watch the previous charts you will understand how the dotted lines get tagged during the course of the day
keep following for live market updates.

Nifty Futures Levels 24th May 2023Special markings in Red, blue and Green solid lines are very important areas and opening of the trade in the morning gives us a reasonable idea along with other factors as to how the day should proceed.
If you have been following the levels from the previous charts by now you would have seen the importance of how correctly marked areas worked .
we can visualize from the chart where a trade with defined risk can be taken.
The dotted lines in red blue and green can be tagged incase of a break on either side. A gap up should be bullish and its important to follow price action and wait for a proper entry. ANY GAP DOWN BELOW THE SUPPORT AT 18288 should be bearish and again price action will be important. The dotted lines ate the untouched VAH, VAL or poc which can be tagged.
keep following for live market updates.

Nifty Futures 23rd May 2023Any opening in-between the areas marked will be a no trade zone for buyers. However a breakout on either sides of the support and resistance zones will be interesting...as it will be coming out of consolidation area. The opening will lay the course of action for the day.
Special markings in Red, blue and Green are very important areas and opening of the trade in the morning gives us a reasonable idea along with other factors as to how the day should proceed.
If you have been following the levels from the previous charts by now you would have seen the importance of how correctly marked areas worked .
we can visualize from the chart where a trade with defined risk can be taken.
keep following for live market updates.
