Search in ideas for "Nse:itc"


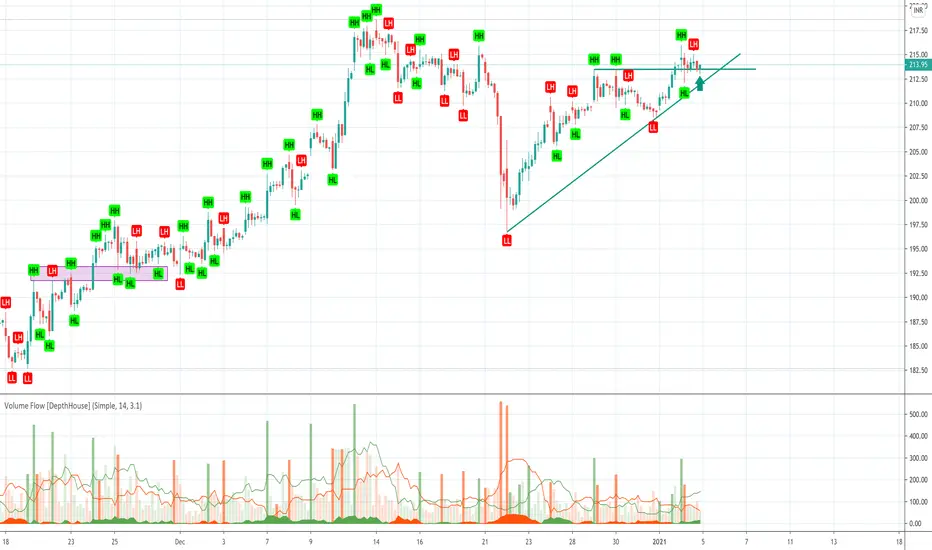
NSE:ITCITC has just shown a highly probable bullish flag breakout. A good entry level for 1.68 target

ITC 1-W CHART ANALYSISNSE:ITC
210 to 350 level in one year
5 multi-year breakout.
ALWAYS WAIT FOR RIGHT ENTRY.
it's only knowledge purpose only.

NSE ITC - Long Squeeze to carry it to 400+ if NIFTY holdsITC continues to stay under LTH, building tremendous energy. Bounced back off 370 odd when market sold off
Weekly chart breaking through consolidation
Target - 420-440, Stop Loss at 370
Calls - IV at 17% means you only need 3% move in 52 days (till April exp) to break even. Buy ITM Calls 380, Sell 420
Risk - Nifty collapses below 17300 - all bets are off then

NSE:ITC (if it goes up after the market open then go for a long)if it goes up after the market open then go for a long
Stock of the year at important junctionNSE:ITC after having a splendid run throughout the year is now at a very important junction. It is a fairly visible H&S (Head & Shoulder) in making but breakdown looks like snowball's chance in hell. Hence that means NSE:ITC can be a good reversal candidate but only after strong close above 456 level. That should lead NSE:ITC towards 500 and then further for new highs. Breakout above 456 may look for a inverted H&S or double bottom breakout. Things are difficult for equity market but the course of this war shall be decided in upcoming days when we will know the participating countries and fronts. One can add NSE:ITC at current levels if they have missed the rally throughout as it is holding on its levels, 432-430 shall act as stop loss. A closing below these levels shall trigger the breakdown of the above-mentioned H&S. We have 2 inside bars in last 4 candles which also indicate accumulation at current levels. It will be very exciting to see which way these positions move. If a breakdown takes place then NSE:ITC will move towards 415-420 levels otherwise this trending stock should remain the contender for more upside this year and further.

ITC AFTER TODAYS FALLITC IN 1 WEEK TF
LOOKS LIKE ITC HAS TAKEN A TEMPORARY RETRACEMENT FOR NEXT UP MOVE.
ITS FORMING A MULTIYEAR SOLID TRIANGULAR PATTERN .
MY TARGETT WOULD BE AROUND 26-0 BY THE END OF MONTH. HOPEFULLY. NSE:ITC
NSE:ITC NYSE:IT NSE:ITC NSE:ITC NYSE:IT

ITC Ltd - Breakout OpportunityDate : 18-Jul-2024
LTP : Rs. 470.25
Targets: (1) Rs. 481 --> (2) Rs. 499 --> (3) Rs. 532
SL : Rs. 433 on daily close basis
Technical View:
• NSE:ITC was going through primary downtrend since Jul-2023.
• After touching the high of 481.45 on 4-Jan-2024, it has retraced 17% to 399.4 level and it has retraced 20% since Jul-2023.
• On 15-Jul-2024, NSE:ITC has broke out from its primary down trend with higher volume.
• NSE:ITC is trading above 20 DMA, 50 DMA and 21 DEMA.
• RSI is trading at 78.79 and MACD is trading at 9.64. Indicating bullish momentum.
• Looking strong to start an uptrend.
Disclaimer : I am not a SEBI registered analyst/consultant and not recommending anyone to take any BUY or SELL position in stock market. Investing in stock market is risky and one should do a self analysis and validation before investing in stock market. My ideas are published for learning purpose only and are available to everyone at no cost/charge.

FMCG sector weekly chart analysis with stock explanationRecently if we observe closely, FMCG Sector is outperforming & helping index to move higher and higher, where it contribute nearly 8% of Nifty 50.
In which ITC is having the highest weightage in the FMCG sector (nearly 30%) followed by HUL (24%), Nestle (7%) and Tata consumer (6%) respectively.
Adding to this VBL is outperforming like anything, compare to other stocks in this sector, VBL Chart was really great. which contribute 2.5% to the FMCG sector.
Britannia, Dabur, P&G & Colpal are the other important stocks in this sector.
Keep an eye on these stocks for the coming days.
As FMCG sector look very bullish & broke its 52 Weeks high and also 18 Oct 2021 weekly high in these recent weekly Chart. Which helped in forming double top pattern.
In coming days if the price closes above 42000 level comfortably , then we can expect further bullish movement which has a potential to reach 50000 range in upcoming days.
39000-40000 range must act as important support Level, if price is unable to sustain in the present level.
This is just overall view of FMCG sector. Not a recommendation to trade in any stocks, Do your own analysis before taking any trade.
NSE:CNXFMCG
NSE:ITC
NSE:HINDUNILVR
NSE:VBL
NSE:NESTLEIND
BSE:TATACONSUM
NSE:BRITANNIA
NSE:DABUR
NSE:PGHH
NSE:COLPAL
NSE:MARICO

The Breakout Retest Play: 5 Stocks to Consider1. Infosys NSE:INFY
● The stock has formed a Rounding Bottom pattern, and after the breakout, it rose significantly, reaching an all-time high near 1,990.
● Currently, the stock is trading slightly above the breakout level following a minor pullback.
➖ Best buy level: 1790 - 1830
2. ITC NSE:ITC
● The stock encountered resistance between the 470 and 480 levels multiple times.
● After breaking through this range, the price surged to an all-time high of 528.
● The price then faced rejection at this peak and has since retreated to the breakout level, where it is now rising again.
➖ Best buy level: 470 - 480
3. Lupin NSE:LUPIN
● The stock achieved a breakout after nearly nine years in August 2024.
● Following an initial upward movement, the stock price pulled back for a retest and is now trending upward once more.
➖ Best buy level: 2000 - 2050
4. Birlasoft NSE:BSOFT
● After breaking out of the Rounding Bottom pattern, the stock price surged to an all-time high of 856 before declining.
●The stock is currently trading at the breakout level, which appears to be a strong support.
➖ Best buy level: 550-560
5. Emami NSE:EMAMILTD
● After a prolonged consolidation, the stock developed an Inverted Head & Shoulder pattern.
● Following the breakout, the price surged to an all-time high of 860 but faced strong rejection from that level.
● The stock is now approaching a retest of the previous breakout level.
➖ Best buy level: 595 - 600

ITC Important levels for the year 2023NSE:ITC NSE:NIFTY Major stock
DISCLAIMER: Do not consider this analysis as an Investment or Financial advise.This analysis is made for educational purpose.
ITC Aalways had been a favourite stock for investors and in this Idea i trided to analyse its probably bullish movement, although i have marked important Bearish level too.
Currently ITC is being trading in an important levels which might lead to the continuation of its existing Up trend.
ITC might be in a process of making a probable ascending triangle breakout in the coming days will be necessary to support this pattern and this Idea.
Important conditions have already been mentioned in the chart itself.
We might se profit booking in the higher levels so be cautious.
If till the year end we see ITC being trade in the higher levels then we might see either consolidation or reversal in the next year.But this is just an observation and in any sense it should not be considered as Investment recommendation or advice.
I took due care while analysing the chart but all my analysis is based on probable calculation and can be proved wrong at any point of time.
The purpose of this Analysis is to provide you an edge to your existing experience, knowledge and trading strategy, so club these levels with your own set of skills regarding market and you will definitely find these levels of immense use.
All these analysis took lots of time and effort so if you like this idea then do support it and I will be updating throughout the year so don't forget to subscribe.

ITC - 1D TFNSE:ITC has a uptrend in 1M TF. Looking down at the 1D TF, the chart has broken a triangle pattern and has moved down, touched a demand zone and is currently trading at a support turned resistance zone. Let us see what the market has for us..!!
Disclaimer:- This analysis is only for educational purpose. Please always do your own analysis or consult with your financial advisor before taking any kind of trades NSE:ITC

ITC breakout, can go long in futuresAfter long time of consolidation and very good Q3 results NSE:ITC has given technical breakout. Can go long with target of 288 and then 300 with sltp of 275.5 NSE:ITC

Nifty 50's Top Constituents Stand Tall Amidst Uncertainty◉ Abstract
The recent decline in the Nifty 50 index can be attributed to several interconnected factors affecting market sentiment. Geopolitical tensions, particularly the conflict in the Middle East, have increased uncertainty and volatility among investors. Additionally, significant foreign institutional investor (FII) outflows, surpassing ₹1,00,000 crore in October 2024, reflect concerns over high valuations in Indian markets compared to more attractive options abroad. Weak earnings reports from Indian companies have further fueled investor anxiety, prompting reassessments of growth sustainability.
Overall market sentiment has turned cautious due to uncertainties surrounding upcoming events like the US elections and ongoing geopolitical issues, leading to a broader sell-off. Technical analysis indicates potential support levels between 22,750 and 23,000, while valuation metrics suggest that despite recent declines, many key Nifty stocks remain fairly valued, with caution advised for new investments during this volatile period.
Read full analysis . . .
◉ Introduction
The recent fall in the Nifty 50 index can be attributed to several key factors that have affected market sentiment and investor behaviour.
● Geopolitical Tensions:
The ongoing conflict in the Middle East, particularly the Iran-Israel war, has heightened global uncertainty. This geopolitical instability has led to fears among investors, contributing to market volatility and declines in stock prices
● Foreign Institutional Investor (FII) Outflows:
There has been significant selling by foreign institutional investors, with outflows reaching above ₹1,00,000 crore in October 2024. This trend is partly driven by concerns over peak valuations in Indian markets compared to cheaper valuations in other markets, such as China
● Weak Earnings Reports:
Recent quarterly earnings from Indian companies have shown weakness, raising concerns about the sustainability of growth. This has led to increased selling pressure as investors reassess their positions in light of disappointing financial performance
● Market Sentiment and Investor Jitters:
Uncertainty surrounding upcoming events, such as the US elections and ongoing geopolitical tensions, has made investors cautious. This sentiment is reflected in the broader market sell-off and a lack of confidence in taking long positions during this volatile period
◉ Technical Analysis
● Weekly Chart
➖ The weekly chart indicates a strong upward trend, with the index consistently achieving higher highs and lows.
➖ However, a significant selling pressure from the peak has led to a sharp decline.
We expect to find potential support in the range of 22,750 to 23,000.
● Daily Chart
➖ The index has broken through the neckline of the Head & Shoulders pattern.
➖ While there is immediate support around the 23,900 to 24,000 level, we believe the index may struggle to maintain this level and could drop further.
➖ Robust support is anticipated between 22,750 and 23,000.
◉ Valuation Analysis
➖ The Nifty PE Ratio has dropped to 22.5, slightly below its 1-year average of 22.6 and significantly lower than its 5-year average of 25.24. This suggests that the Nifty is currently fairly valued.
➖ However, the recent quarter's lacklustre EPS growth is a concern, exerting downward pressure on the major index.
As the major index struggles, it's worth taking a closer look at the key Nifty constituents that carry substantial weightage.
1. HDFC Bank NSE:HDFCBANK
Sector - Banking & Financial Services
Weightage - 11.34%
● Technical Overview
➖ For nearly three years, the stock has been range-bound, exhibiting stability.
➖ Despite the broader market's downturn, it has shown no reaction, suggesting that its sideways movement is likely to continue.
● Valuation
➖ The stock currently trades at a PE ratio of 19.2, moderately above its 1-year median PE of 17.5.
➖ Notably, the company's earnings performance has shown improvement, with a quarter-over-quarter increase in EPS:
June quarter: ₹21.65
September quarter: ₹23.36
2. Reliance Industries NSE:RELIANCE
Sector - Oil & Gas
Weightage - 8.64%
● Technical Overview
➖ Following a record peak near 3,200, the price retreated and is now approaching its key support level of 2,550.
● Valuation
➖ The current PE ratio of 26.5 indicates undervaluation relative to its 1-year median PE of 28.3.
➖ Earnings growth supports this positive valuation outlook:
Current EPS: ₹24.48
Previous quarter EPS: ₹22.37
3. ICICI Bank NSE:ICICIBANK
Sector - Banking & Financial Services
Weightage - 7.74%
● Technical Overview
➖ The stock has maintained a strong uptrend, demonstrating remarkable resilience amidst recent market downturns.
➖ However, from a technical standpoint, a short-term pullback towards the 1,100 level cannot be ruled out.
● Valuation
➖ The present PE ratio of 18.7 suggests a minor overvaluation when compared to its 1-year median PE of 17.9.
➖ EPS improved significantly from ₹16.62 in June to ₹18.38 in September, indicating a positive trend in the company's financial performance.
4. Infosys NSE:INFY
Sector - Information Technology
Weightage - 5.83%
● Technical Overview
➖ The stock has successfully broken out of its Rounding Bottom pattern and is now consolidating above the breakout level.
● Valuation
➖ The present PE ratio of 28.7 suggests a minor overvaluation when compared to its 1-year median PE of 26.4.
➖ Earnings growth, although subdued, remains stable:
June quarter: ₹15.34
September quarter: ₹15.67
5. ITC NSE:ITC
Sector - FMCG
Weightage - 4.16%
● Technical Overview
➖ The stock remains in a strong uptrend, consistently forming higher highs and lows.
➖ After reaching an all-time high of 528, the price has pulled back and is now testing its crucial support zone between 460-470.
● Valuation
➖ The present PE ratio of 29.4 suggests a minor overvaluation compared to its 1-year median PE of 27.
➖ Furthermore, the earnings per share (EPS) has declined from the previous quarter, falling from ₹4.08 in June to ₹3.99 in September.
6. Bharti Airtel NSE:BHARTIARTL
Sector - Telecom Services
Weightage - 3.95%
● Technical Overview
➖ The stock price has experienced a notable rise.
➖ After hitting an all-time high near the 1,780 level, it has corrected and is anticipated to find support along its trendline.
● Valuation
➖ The stock's current PE ratio of 83.5 significantly exceeds its 1-year median PE of 65.3, indicating substantial overvaluation.
➖ Ahead of the upcoming quarterly results, earnings execution is not expected to be robust, potentially leading to a sharp correction in the stock price.
◉ Conclusion
Analysis of six pivotal Nifty 50 stocks reveals that, excluding Bharti Airtel, they are fairly valued. With a combined weightage of over 40%, these stocks underpin index stability
Given this significant representation, we do not foresee a drastic decline in the index from either a technical or fundamental standpoint.
However, the ongoing war may impact global sentiment, influencing market mood. Therefore, we advise caution when considering new buy positions.

ITC retraced from 50% of Fib LevelAfter a big move NSE:ITC has retraced and is bouncing back from 50% of fib level.
1) 460 acting as a resistance level from Aug.
2) This resistance level has been broken with flag and pole pattern or simple after consolidation and with high volume candle
NSE:ITC must take support from 460 and next target can be 480 and 500.
Keep it in your watchlist and act accordingly.
Comment down your queries and suggestions please.

ITC - A viewpoint NSE:ITC
ITC Limited is a holding company engaged in the marketing of fast moving consumer goods (FMGC). The Company operates through four segments: FMCG; Hotels; Paperboards, Paper and Packaging; and Agri Business.
TTM EPS: 12.01
TTM PE: 21.40
Sector PE: 23.75
Book Value Per Share: 47.87
P/B: 5.37
Face Value: 1
Mkt Cap (Rs. Cr.): 316,769
Dividend Yield: 4.18
Some Positives:
Company with Low Debt
Increasing Revenue every quarter for the past 2 quarters
Increasing profits every quarter for the past 2 quarters
Near 52 Week High
Strong Momentum: Price above short, medium and long term moving averages
Some Negatives:
Inefficient use of capital to generate profits - RoCE declining in the last 2 years
Declining Net Cash Flow : Companies not able to generate net cash
My Opinion: When the stock is in any uptrend, it forms base in stages. One should wait for a new base to form. 265 is an important resistance.
Can ITC cross 310 and go even higher? Absolutely yes. When? You never know.
NOT A RECOMMENDATION. ONLY FOR EDUCATION PURPOSE. Thanks.

NIFTY FMCG Breakout and RetestNSE:CNXFMCG had formed a triangle and has given breakout now.
The Restest of an important level has been done so we can expect the index to go up.
Keep eyes on NSE:ITC , NSE:NESTLEIND , and NSE:JUBLFOOD .

NIFTY 50 STOCK YOU CAN SEE HERENSE:NIFTY
NSE:ADANIPORTS
NSE:AXISBANK
NSE:CIPLA
NSE:TATAMOTORS
NSE:TATASTEEL
NSE:TCS
NSE:HDFCBANK
NSE:HDFC
NSE:ASIANPAINT
NSE:BAJAJFINSV
NSE:BAJFINANCE
NSE:BRITANNIA
NSE:BHARTIARTL
BSE:COALINDIA
GAIL
NSE:INDUSINDBK
NSE:ICICIBANK
NSE:IOC
NSE:ITC
NSE:WIPRO
NSE:JSWSTEEL
NSE:DRREDDY
NSE:HCLTECH
NSE:INFRATEL
NSE:INFY
NSE:RELIANCE
NSE:KOTAKBANK
NSE:LT
NSE:TECHM
NSE:M_M
NSE:NTPC
NSE:ONGC
NSE:ULTRACEMCO
NSE:VEDL
NSE:ZEEL
MAXIMUM STOCK HERE ARE AT SUPPORT TILL 2 O CLOCK
EDUCATIONAL VIEW ONLY

ITC to DIVE TILL 350 below 384 closingNSE:ITC ITC has been sideways at the highs of life time and is showing negative signs of sharp down fall set up if it comes down and breaks the range support of 378/369,
below 369we can seen a sharp fall to 350 step by step with only 1 pause/support zone n middle at 363/361.
IF ITC BREAKS RANGE HIGHS/RESISTANCE OF 394 and gives closing and opens new candle above it, then and then only it can carry on the uptrend.

ITC: A Bearish Trend"
TECHNICAL ANALYSIS OF NSE:ITC
The LAST CLOSE PRICE of NSE: ITC is 206.05. The PARABOLIC SAR is showing the SELL SIGNAL with TREND as DOWN TREND . The FIBONACCI LEVELS analysis shows that the CLOSEST FIBONACCI LEVELS is 0.236 at the FIBONACCI STOCK PRICE LEVEL of 204.95. From here, the Key Support and Resistance levels are SUPPORT 1 at 250.07, SUPPORT 2 at 210.15 with RESISTANCE 1 and RESISTANCE 2 at 201 and 197.25 respectively. The Key 50% FIBONACCI LEVEL stands at 210.15 which is the crucial Fibonacci Level determining whether the scrip will maintain the trend or not.
The STOC RSI has the values K and D as 42.9 and 55.46 respectively. At this level it the status is WITHIN OVER BOUGHT AND OVER SOLD RANGE. When we look at the Moving Averages, MACD is the crucial indicator to look into. With MACD VALUE at 0.61 and 8.82 at 0.44 along with HISTOGRAM showing values of 0.17, the STATUS is clearly SELL CROSSOVER NEARING IN.
The best indicator to determine the Trend Reversal is FISHER TRANSFORM and currently the values of FISHER and TRIGGER stand at 0.06 and 0.74 with UPTREND as DOWNTREND. A very important factor while making the investment is to see if there has been already too much of Buying or Selling, and that are we entering too late into the transaction or not. Thus, with WILLIAM's R% value at -0.7222 the STATUS is WITHIN OVER BOUGHT AND OVER SOLD RANGE.
No one wants to buy costly things, and thus always look for the bargain or appropriate price levels to buy things. Same applies to Stocks, however the only exception would be some Hot Stocks that one wants to have any price. Looking at this perspective, the P/E RATIO of the stock stands at 18.11 which signifies its Price Level to be AVERAGE.
>>> RECOMMENDATION is : SELL."
Disclaimer:
The analysis is only for illustration purposes only. Please consult your financial advisor, agent, broker before acting on any information. We may or may not have positions in the stock and our actions may be contrary to the one mentioned here. This analysis may or may not be updated. We would not be responsible for the profit/loss resulting from this analysis.

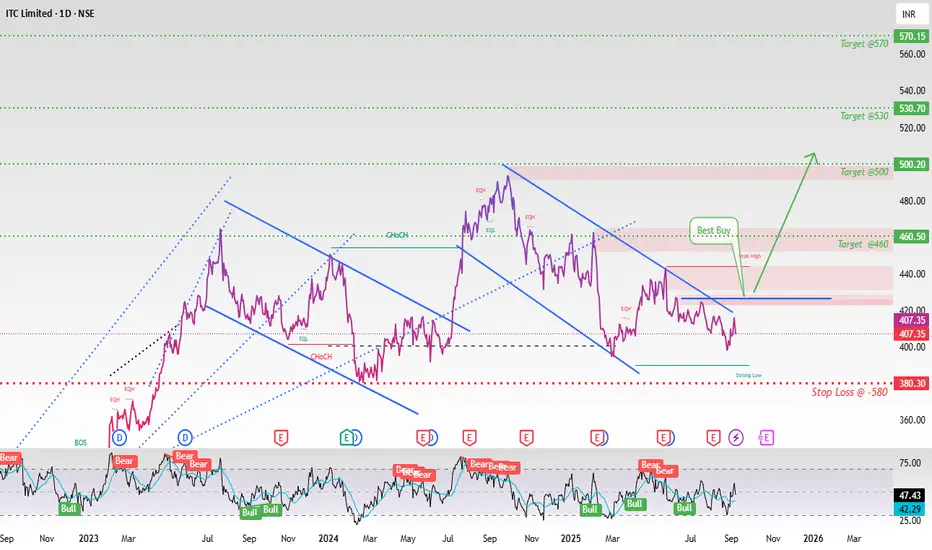
ITC Ltd – Trade IdeaNSE:ITC
ITC Ltd – Trade Idea
Recommendation : BUY
Entry Level : Above ₹425+
Stop Loss : Below support zone of **₹480**
Target Levels : ₹460 / ₹500 / ₹530 / ₹570
---
**Technical Rationale* *
* ITC is forming a **Flag & Pole pattern**, a bullish continuation setup indicating potential for further upside once the consolidation ends.
* Sustaining above ₹425 will likely confirm the breakout, opening room for higher targets.
* Support is well-placed near ₹480; holding this level keeps the bullish momentum intact.
---
**Fundamental Snapshot**
* **P/E Ratio**: \~14.92 – attractive compared to FMCG peers, suggesting reasonable valuation.
* Diversified business model across Cigarettes, FMCG, Hotels, Paper & Agri.
* Strong balance sheet with robust cash flows and healthy dividend payout.
---
**Outlook**
The confluence of **bullish technical structure (flag & pole)** and **comfortable valuations** makes ITC a favorable candidate for **swing to positional trades**.
Risk is well-defined with support near ₹480, while upside potential remains strong toward ₹570 levels.
---
Thanks & Happy Trading
Disclaimer:
This idea is only for educational purposes,
Please Trade at your own RISK''