Search in ideas for "Nse:itc"

#ITC Possible DB and pattern repeatITC came out of the downword channel.
Friday closing would be imp. Keep watching. Can replicate the pattern exhibited in Cyan rectangle. If that happens then forming Double Bottom on this weekly chart.
Please work out levels as per your RR.
NSE:ITC

ITC has reversed from a fibonacci levelITC reversed very well from a fib level.
Can go long again. The chart looks strong on the charts.
NSE:ITC
Please like and follow.

ITC daily analysis NSE:ITC #ITC Daily analysis go for long, accumulate in dips, Target 180, 190, 200. Level by level it will achieve, Quarterly results 06.11.2020.

ITC trendline broke with very good volumes. NSE:ITC
I am starting a new telegram channel. To join my telegram channel, leave a comment with "interested."

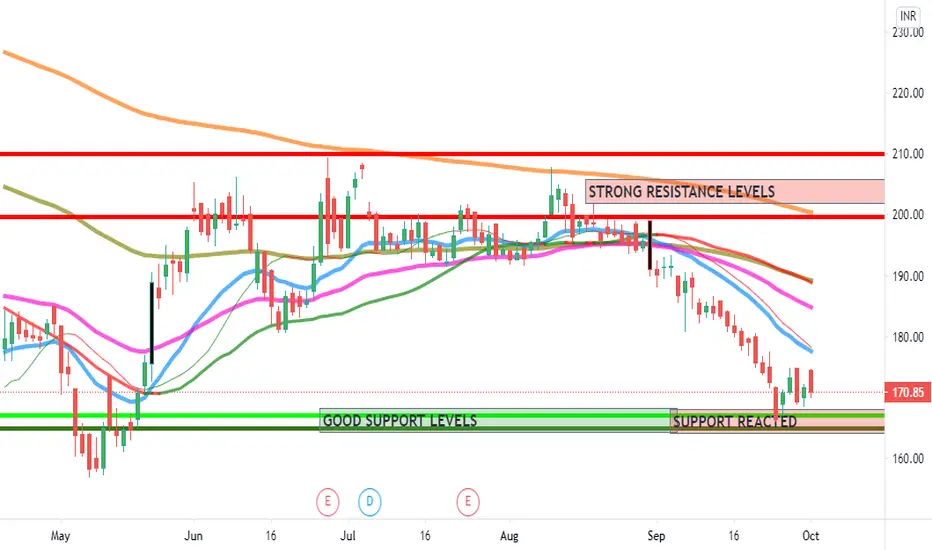
ITC VERY STRONG RESISTSANCE at 174.70Honestly, if there was an ever an example to use to teach someone resistance, it's this. Reverses from the trend line every chance it gets.
Imagine the psychology of a trader if it breaks the barrier.
Buy above 175 with an open target. It will move! NSE:ITC

ITC daily analysis ITC daily analysis , 20 DMA 178, 50DMA 188, 100 DMA 190, 200 DMA 195. NSE:ITC is also trading Belo 20 DMA, 50 DMA, 100 DMA, and 200 DMA on daily time frame.
ITC GO FOR LONG WITH STRICT STOPLOSSNSE:ITC #ITC GO FOR LONG WITH STRICT STOPLOSS 180 LEVELS ,IF RESISTANCE IS BROKEN GOOD NEW HIGHS CAN BE MADE.


ITC NSE:ITC
CHART BY HarmonicTrading™
#ITC CMP 207.55 DT 04/7/20
THE MAJOR PATTERN COULD BE SEE AS AN ASCENDING WEDGE FORMATION.
FRESH LONGS SHOULD BE TAKEN ABOVE 210 FOR 215.
THE 215 WILL BE VERY IMPORTANT POINT AS IT COULD ACT AS A RESISTANCE OR A BREAKOUT POINT OF THE WEDGE. SO NEED TO LOOK AT THE PRICE ACTION OVER HEAR. BUT AS OF NOW ABOVE 216 WE CAN SEE 222 / 228.
ANOTHER IMPORTANT POC IS 250 WHERE A DAILY TIME FRAME HARMONIC PATTERN CO-EXIST WITH THE PREVIOUS SUPPLY ZONE. SO IT WOULD BE TIME TO BOOK PROFITS THERE AND FRESH SHORTS CAN ALSO BE INITIATED.


Itc has broken out of range and also formed cup and handle kind NSE:ITC has broken out of zone forming cup and handle kind of pattern. ADX also is giving signals for a start of new trend. It has a great potential to move upside but its a slow moving stock so option trading might not be a good option. Cmp is around 300 and is expected to move above 320/345/353 if these levels are crossed it will trade above 52 week highs.

ITC – Topped out?ITC NSE:ITC is facing very strong resistance near 290 levels.
It has been struggling around these levels since past few days.
Now that the results are also out, looks like profit booking has started in this stock.
I can see a Double top formation with a negative divergence as well as a Bearish Engulfing candle that it formed today.
Good opportunity to short with a stop loss a few points above recent highs and first target around 266 levels.
Disclaimer: Views expressed here are my own, and should not be interpreted as an Investment Advice. Please consult your Financial Advisor for investments.


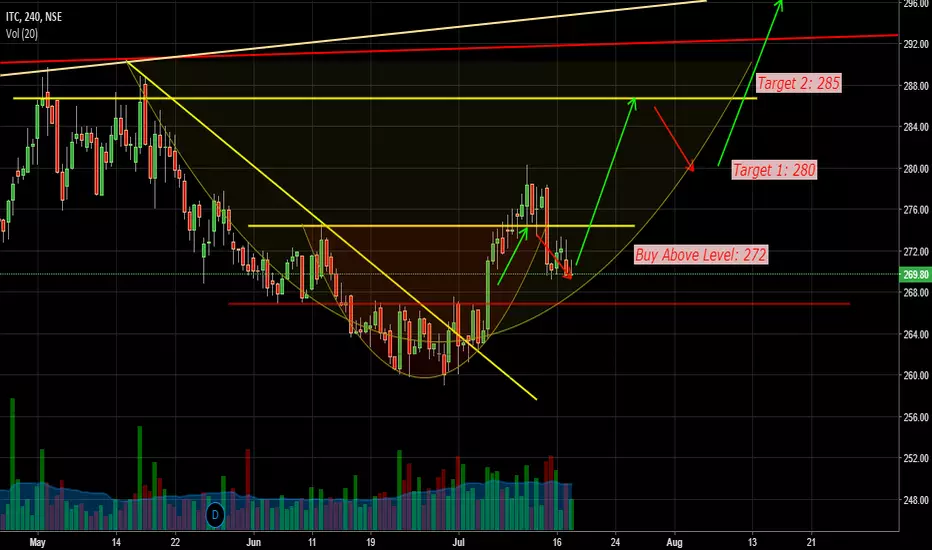
ITC CMP 269.85. Targets 280, 285. Strict SL 267In the previous post on ITC , we hit both targets of 275 and 280. Price has fallen since.
Price 270 is very critical Level. Positive Breakout is possible that can take the price all the way up to 290.
Conservative Targets are: 280 and 285
Have a strict SL of 267 on closing basis.
start buying above 272, There seems to be strong resistance around 275 levels.
ITC will start going downwards soonTECHNICAL INDICATORS -
DOUBLE TOP PATTERN :
Recently NSE:ITC has formed a double top pattern indicating strong bearish potential for the stock
Double top is formed when 2 consecutive peaks are formed with a dip or low between them
HANGING MAN CANDLESTICK :
The stock has also formed a hanging man candlestick which denotes reversal of upward trend to downward trend
Hanging man is formed when a candlestick has long lower shadow and small upper body at the top
STRONG SUPPORT-RESISTANCE ZONE :
The stock has also taken reversal from a very strong support-resistance zone twice in the last 1 month indicating very stong momentum for the stock to go downwards
PROFIT TARGET :
411
STOP LOSS :
435

exit ITC incase hold from retailerDisclaimer:- Stocks , Patterns are for study purpose only . Please do your own analysis before investing.
NSE:ITC
exit /stop loss:- 440/430

ITC - Looking Weak & Rising Wedge Breakdown PossibleNSE:ITC is looking weak on daily and weekly charts. ADX just crossed 25 ( threshold that I consider ) for directional movement. The downside momentum can continue for targets mentioned on the chart as T1, T2 and T3. The conviction comes from simple price action setup ( weekly doji close and the current week candle closed below doji close ) and open interest data
Positional weekly target also listed if we close below T3 decisively.
Let's see how the story develops. Best wishes!
Disclaimer -
- The opinions expressed here are my own. This is for my own records as well as what I see on charts.
- If you are referring to this, please keep in mind that it is only for educational and research purposes.
- Past performance is no guarantee of future results.
- You must accept responsibility for any decision you make. DO NOT TAKE THIS AS AN INVESTMENT RECOMMENDATION.
- It's your hard-earned cash. Trade / Invest wisely, keeping in mind your trading style, goals and objectives, time horizon, and risk tolerance.
- Before investing, conduct your own research and consult with a financial advisor.
TIA!

Contra Bet on ITC. Will it work?NSE:ITC
I have a detailed analysis on this stock and also know that many investors are frustrated holding this script. It is also clear that demerger is not happening anytime soon so we do not have a comfort for value unlocking from this parameter. But in a contra bet, script has a strong Fundamentals. According to the chart patterns, stock is trading at the lower range of bollinger band. This provides an opportunity to Buy at lower edge (Not trying to fish the bottom). Medium term trend suggests a direct hit of Rs.275 in 3 months. Fundamentals suggest risk reward ratios are favourable at current levels.
The idea shared is only for educational purpose.

ITC resistance/breakout from trendlineNSE:ITC is most likely to face resistance from trendline around 255 -256
If it is broken then it might go on to make new life time highs continuously.
Note : The information provided is not a trading advise. Just for educational purposes.
Do your due diligence, before entering the trade.

Breakout Opportunity with ITC LTDDate: 2-Feb-2022
LTP: 230.
Target: 240 -> 250 -> 265
NSE:ITC has created a breakout from its primary down trend with high volume yesterday (2-Feb) and given gap up opening today (3-Feb). May be sign of trend reversal to up trend.
