Search in ideas for "Nse:itc"
Positional Call on ITC!!Price Action stamps the weak downside. A decent disinterest is shown by the sellers to pull the price down. Above 281 will eat all the existing sellers and so entry above 281 will give a better move to 290. NSE:ITC
ITC LONGNSE:ITC
Only for education and information purpose. Should not be taken as a trading call
As we can see double pattern formation around the support zone so can go with the investment at the D point.
CHART BY HARMONIC LEARNING AND EARNING


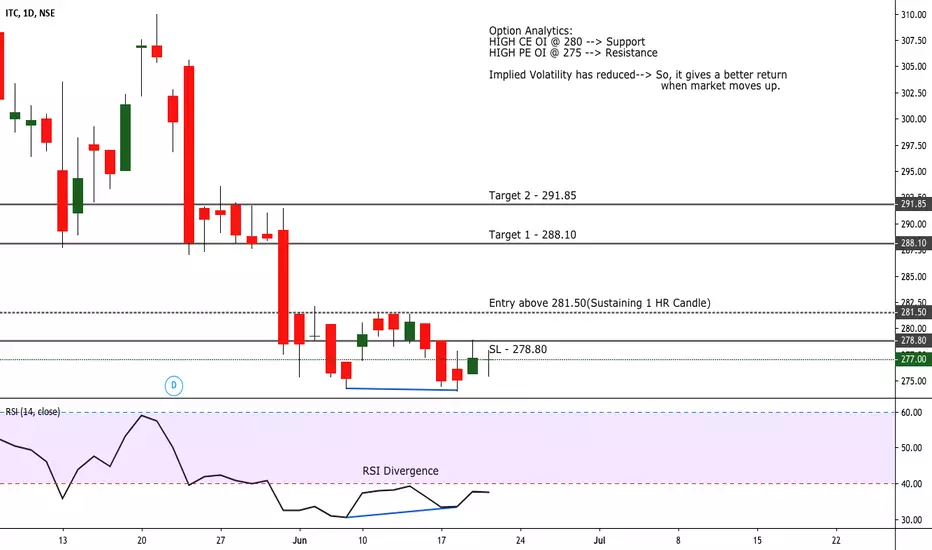
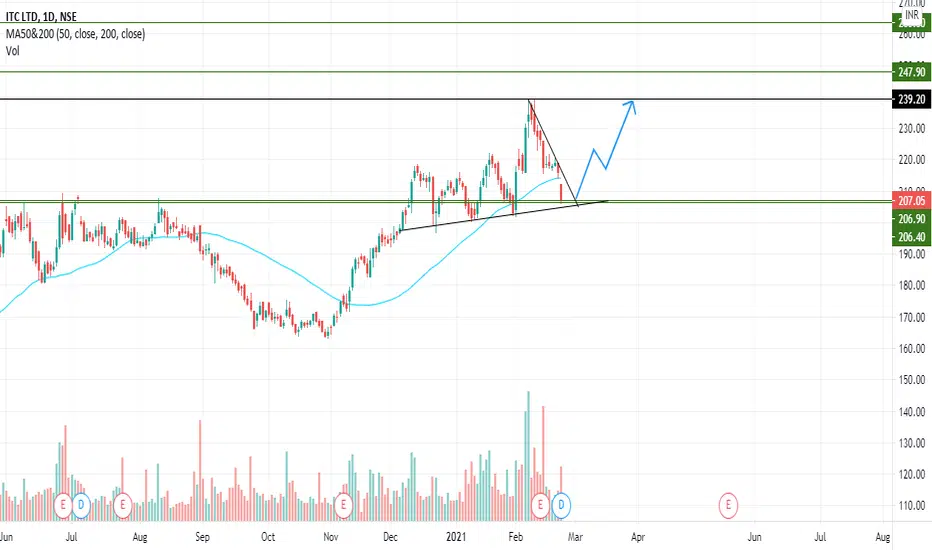
ITC - Trend Reversal?NSE:ITC has broken its down trend and it seems like the trend has reversed from its support
Go long above 271.50
T1 - 280.90
T2 - 294.50
SL - 252.80

ITC Demand ZoneNSE:ITC
Buy Range - Rs262 to Rs265
StopLoss - Rs254
Target 1 - Rs274
Target 2 - Rs281

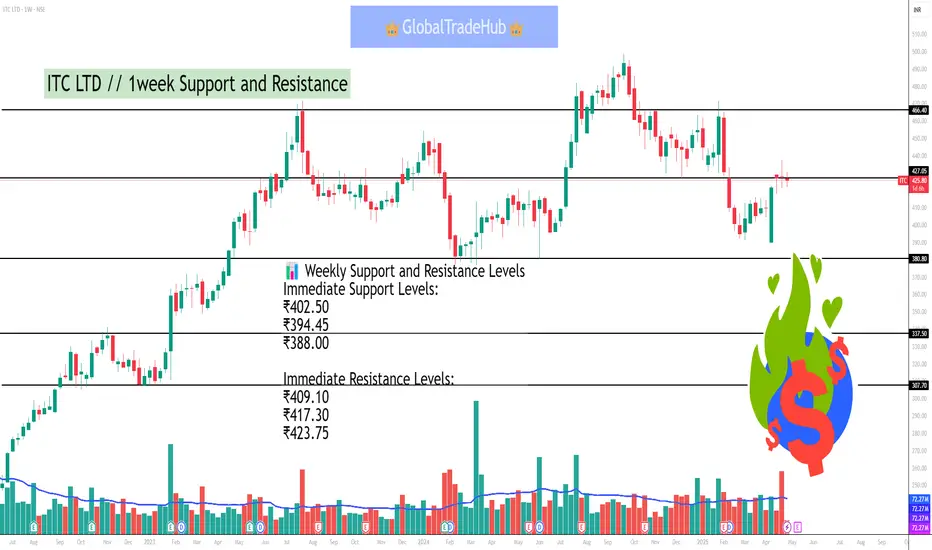
ITC LTD // 1week Support and ResistanceAs of May 1, 2025, at 10:20 AM IST, ITC Ltd (NSE: ITC) is trading at ₹403.05. Based on recent technical analysis, here are the key support and resistance levels for the stock on a weekly (1W) chart:
📊 Weekly Support and Resistance Levels
Immediate Support Levels:
₹402.50
₹394.45
₹388.00
Immediate Resistance Levels:
₹409.10
₹417.30
₹423.75
These levels suggest that if the stock price declines below ₹402.50, it may find support around ₹394.45 and ₹388.00. Conversely, if the price rises above ₹409.10, it could encounter resistance near ₹417.30 and ₹423.75.
🔍 Technical Indicators
ADX (Average Directional Index): 29.19 – indicates a trending market.
RSI (Relative Strength Index): 47.4 – suggests neutral momentum.
MACD (Moving Average Convergence Divergence): -4.66 – indicates a negative trend.
CCI (Commodity Channel Index): 2.74 – suggests neutral momentum.
These indicators suggest a neutral to slightly bearish outlook for ITC in the short term.
📈 Summary
ITC is currently trading near its immediate support levels. A break below ₹402.50 could lead to a decline towards ₹394.45 and ₹388.00. On the upside, resistance is observed at ₹409.10, ₹417.30, and ₹423.75. Traders should monitor these levels closely, as a decisive move beyond these support or resistance levels could signal the next directional move.
INDIAN TOBACCO COMPANY, ITC LTD (ACCUMULATE)Sector: Fast Moving Consumer Goods (FMCG)/ Industry: Cigarettes/Tobacco
Market Cap: 561,159.09/- Cr. / Category: Large Cap
Current Price: 449.8/- Target Price: 483, 499,525/- Stop loss: 425
Ticker: NSE: ITC Recommendation: BUY (Buy @ Current Market Price)
Date: 03/12/2023
Highlights
We issue a Buy recommendation on ITC ltd. Based on a 3 -weeks target price of 483,499,525/-, offering a 11.3% upside potential from its closing price of 449/- on 01/12/2023. Our recommendation is primarily driven by Elliott wave theory:
Elliott Wave Theory Outlook –ITC ltd, Buy @ Current Market Price
December 03, 2023 By Dinesh Naidu
Hello traders. In this technical research report we’re going to take a quick look at the Elliott wave chart of ITC ltd. As our members know, the stock is showing impulsive bullish sequences that are calling for further strength. Our team recommended members to avoid selling, while keep favoring the long side. Recently we are in an Impulsive structure in a lower time frame. In the further text we are going to explain the Elliott Wave Forecast and trading strategy.
The stock has already given us wave ((2)) pull back that has unfolded as a Zigzag pattern in a 4 hours’ time frame. The price might reach extreme zone at 499-525, We don’t recommend selling the stock and prefer the long side from the 61.8 & 100% Fib levels. As the secondary trend might turn bullish in a higher time frame, we expect to see at least 3 waves bounce from our buying zone. Once price bounce reaches 161.8% Fib against the (wave 3) high, we will make long position risk free (put SL at Breakeven) and take partial profits. Invalidation for the long trades is at 425 level.
Disclaimer: I am not a SEBI Registered Research Analyst. The information provided here is for education purpose only. I will not be responsible for any of your Profit/Loss with this recommendation. Consult your financial advisor before taking any decisions.
Futures, options, stocks, ETFs and over the counter foreign exchange products may involve substantial risk and may not be suitable for all investors. Leverage can work against you as well as for you. You should therefore carefully consider your investment experience as well as financial condition before deciding if trading is suitable for you or not.

ITC - Count Seven & Go To Heaven (Wave Analysis)Disclaimer
-----------------------------
All investments involve risk, and the past performance of a security, industry, sector, market, financial product, trading strategy, or individual’s trading does not guarantee future results or returns. Investors are fully responsible for any investment decisions they make. Such decisions should be based solely on an evaluation of their financial circumstances, investment objectives, risk tolerance, and liquidity needs.
----------------------------------------------------------------------------------------------------------
----------------------------------------------------------------------------------------------------------
Once Seven Waves are done on the upside- structure completes & Next larger degree wave could start soon for ITC which most probably points to the downside direction but as a trader, we have to put proper risk management to get a maximum advantage (check trading strategy mentioned below)
Importance of Number Seven
------------------------------------------
Number 7 came from - Seven headed flying horse - "Uchchaihshravas" was obtained during churning of milk ocean (Samudra Manthan - as suggested Hindi)
Horses signify
Seven days in a week
Seven sages called Saptarishi
Seven colours of the rainbow
Seven Chakras of Yoga
---------------------------------------------------------------------------------------------------------
Last TradingView Status Update
--------------------------------------------------------
11:36 Hrs / 9th July 2020 - ITC Stock Update - Please check last idea-"Bearish Gartley" Suggested Buy above 195 for 200 & 205-207. We can repeat the same strategy again. Strictly Buy Above 195 for 200 & 205 upsides or Sell Below 194. Thanks
---------------------------------------------------------------------------------------------------------
TradingView Profile Page for Previous “ITC” stock ideas
-----------------------------------------------------------------------
in.tradingview.com
----------------------------------------------------------------------------------------------------------
Trading Strategy
----------------------
Plan A
------------------------
Strictly holding above 195 – look for Target 1- 200 & Target 2 – 205/207 which is valid & open only if the stock crosses above 200 & holds – that means it should not slip or fall below 200 level
Plan B
-----------------------
Strictly Selling below 194 for Target 1 – 190/191 & Target 2 – 185 open or valid if stock slips below 190
Plan C
----------------------
No trade zone or strictly avoid any trading between 194-195 zone & Execute Plan A or Plan B according to the price movement
Plan D ( Long Term Analysis)
---------------------------------------------
Scenario – Reaches close to 209 & fails to cross on the upside then sell or if crosses above 209.50 then sell later – Target 1 – 180 / Target 2 (Strictly Below 180) for 157-158 / Target 3 – (Strictly Below 157-158) – 135 which is final target downside
---------------------------------------------------------------------------------------------------------------------
Thanks for watching the idea. Take Good Care of Yourself & dear ones. Good Night

ITC at Daily support. Amazing Long OpportunityOur previous trade idea didn't go well since Nifty was in channel correction mode and the correction is expected to stop around 14450-14550. I am sharing the same script but a different definite idea for which I am very certain will succeed and recover our loss in the last trade.
Disclaimer:
Although my previous idea was clearly specified for March Futures, some of you are still holding as recommended. Please note that I had asked you strictly to not go for February Series Options and Futures, and yet some of you have DMed me about what options to choose. All the options buyers who went against what I asked on the strategy aren't even getting a cent on the dollar now, and that is why options buying is just so bad. Not only you need to be right, but also you need the movement in your direction and worst of all? You have to fight against time.
However, since a lot of you have margin limitations and would like to get into the trade with a lesser margin, I am writing this idea especially for you.
Hedge your Future Position
Buy ITC March 185 PE: Margin req is 3,200
Buy ITC March Futures after buying the hedge, your margin req for futures will reduce by 13k to 41k.
Total Margin: 44,414
Stop Loss: 202.5 on Spot (1.5 Rs Stop Loss only) We are buying at support.
Targets: 218, 224, 238, 245, 264
Only enter this trade around 204.3 on Spot Price. Please please I emphasize do not cut your PE position when we go up, you will have a margin call and your future position might also be squared off by your broker. You are getting a margin benefit of 13k for a mere 3.2k premium. Keep that as a hedge if the position goes against you.
The first two targets are possible from the past behaviour of the stock. However, please do not sit on the position and take the SL immediately if you happen two otherwise you will lose really big if you do not follow the SL with discipline. Respect your hard-earned money.
As much as I am not responsible for your loss or profit, please be responsible to follow the trades as directed strictly. I was disheartened to see how some of you didn't exit on time citing the trade is for March Futures. You are correct, but now we are entering the same trade at lower levels and while we reach 215 levels with good profits or cut another SL for a small amount, you will either breakeven just for not following the Stop Loss strictly or might have to square off around 202 at a heavy loss.
Bears are out...NSE:ITC has not given us a excellent upside move till now. At the current moment, it is crafting a falling wedge pattern ( T1 & T2 ) that has a huge potentially to kick in the bulls once a successful breakout occurs.
Like, Follow & Share for new updates.

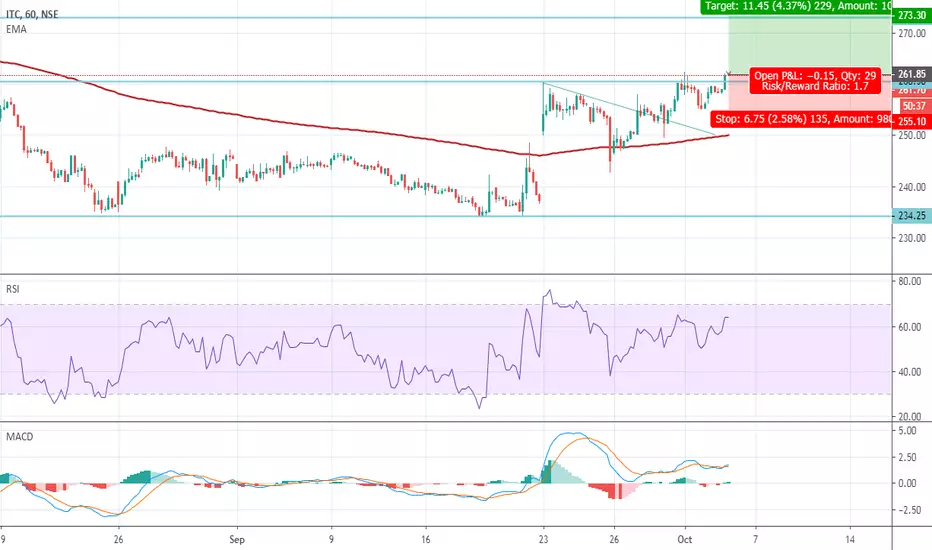
Diverging with strong supportNSE:ITC Price very near to a strong support trendline. Formation of a divergence channel. Price movement backed by RSI and MACD signal(reversal). First resistance at 243.

Bearish Shark - 3% correction expectingNSE:ITC
A Big red Shooting star candle confirmation given, might fall in coming days.

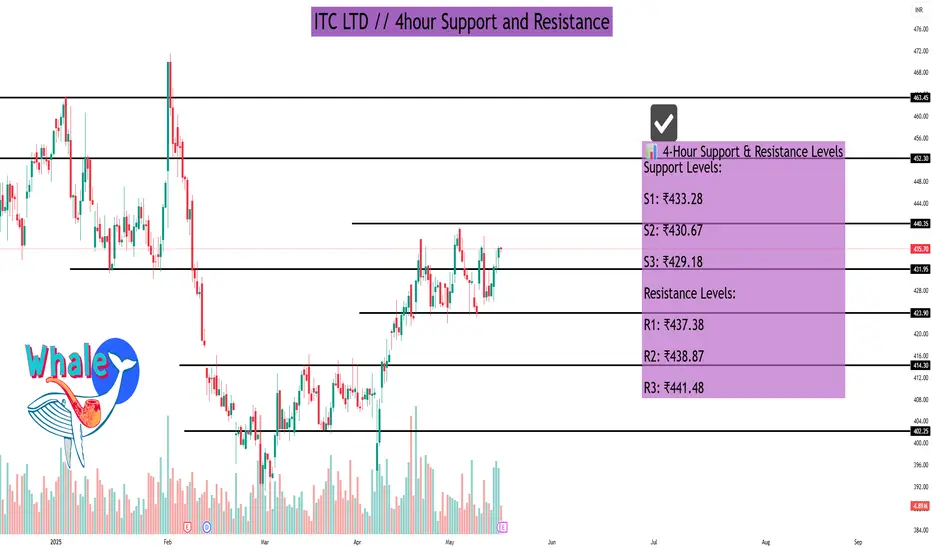
ITC LTD As of May 16, 2025, ITC Ltd. (NSE: ITC) is trading around ₹435.70. Analyzing the 4-hour timeframe, the following support and resistance levels have been identified based on various technical indicators:
📊 4-Hour Support & Resistance Levels
Support Levels:
S1: ₹433.28
S2: ₹430.67
S3: ₹429.18
Resistance Levels:
R1: ₹437.38
R2: ₹438.87
R3: ₹441.48
These levels are derived from pivot point calculations and can serve as potential areas where the price might experience support or resistance.
🔍 Technical Indicators Overview
Relative Strength Index (RSI): 58.98 – Indicates neutral momentum.
Moving Average Convergence Divergence (MACD): 3.86 – Suggests mild bullish momentum.
Average Directional Index (ADX): 17.89 – Points to a weak trend strength.
Stochastic Oscillator: 51.37 – Reflects neutral conditions.
Supertrend Indicator: ₹413.32 – Below current price, indicating a bullish signal.
Parabolic SAR: ₹437.35 – Slightly above current price, suggesting potential resistance.
📈 Fibonacci Retracement Levels
Considering the downtrend from ₹491.00 (Jan 3, 2025) to ₹390.15 (Apr 7, 2025), the key Fibonacci retracement levels are:
23.6%: ₹413.95
38.2%: ₹428.67
50%: ₹440.57
61.8%: ₹452.48
76.4%: ₹467.20
These levels can act as potential support or resistance zones as the price retraces its previous move.
🧠 Trading Insights
The current price is approaching the R1 resistance level at ₹437.38.
If the price breaks above this level with strong volume, it may test higher resistance levels.
Conversely, if it fails to break through, it might retrace to the support levels mentioned above.
Traders should monitor these levels closely and consider using stop-loss orders to manage risk.
ITC | 27 MAR 2022 | BULLISHITC expected to give 35-40% in few months
Investors can enter as per their setup.
Explanation on chart
All the best..!

ITC Ltd Technical Analysis .Hello friends after a long time , I am Again Back with a New Idea, So Today we are going to Talk about ITC Ltd . As you Know its a FMCG Company . So on 1 Day Chart it is making a "Triangle Pattern" . If i Talk About Targets , So Targets will be :- 221.10 Rs , 229 Rs and 240 Rs . So Now Lets Talk About Support and Resistances . So from Its Pivot Points .So its Major Support Is 201 Rs . Volume has dried , Rsi is in Bearish mode and Price is also going Down , Earning Reports will come on 19 May . So From my Opinion it can go "Up" because its on the lower side of the Triangle and so for it can go "Up" and it can go down because FII and FPI are taking out their money from our market due to Covid 19 and please remember that we don't give you any kind of buying and selling guide we just only give you our analysis . PIease Like because we are having a shortages of Likes .
If you have any Doubt Related to This Idea , This Stock or any other Stock . You can comment me Below . And If You Have any Advice For Me Just write it Down . And also write your opinion on this stock . Stay Safe . Thats all For Today . Bye Bye For Now . 👍
Comment Below on which Other Stock You all want to see our Analysis .
Make Sure To Like and Follow us on Our Channel . Like Aim - 6 Please Accomplish this Goal .


Bearish harmonic bat pattern followed by a Doji candleI feel ITC is good for short, like if you agree!
Please do comment and share!
