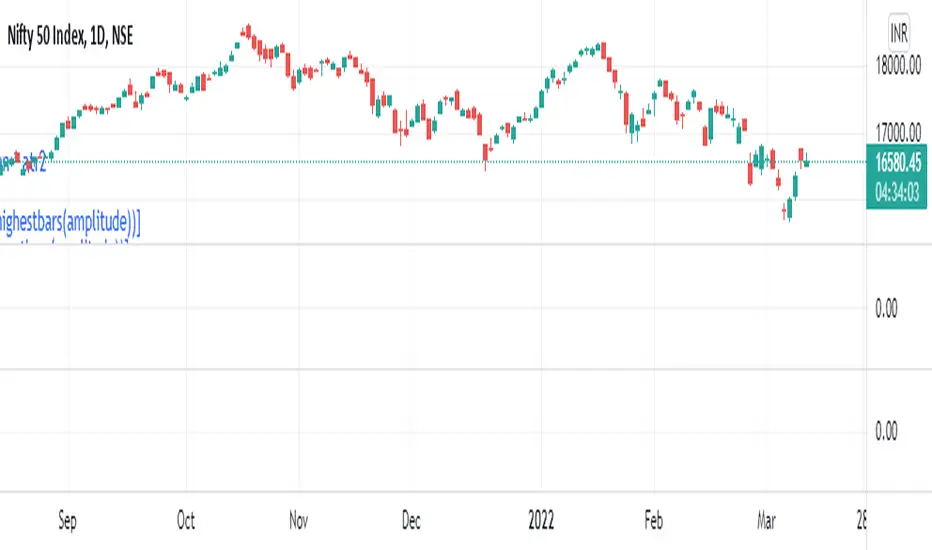
Nifty Support and resistance level for current week or monthPlot the important levels in your chart. If candle open and closes above, No trade zone then we can expect to move upside.
If Target1 act as a strong resistance, then price will move to downside and will reach downside target1(Greenline) and target2.
If candle open and closes below No trade zone, then we can expect to move downside. If Target1(redline) act as a strong support or if you see any pin bar here, then price will move to upside and will reach upside target1(Redline) and target2.
Please like the idea If you agree with the analysis.
Search in ideas for "PLOT"

Bank nifty Intraday Support and resistance levels for 16.09.2022Plot the levels in your chart. If candle breaks above buy range as mentioned in chart expect to move towards the targets.
If candle breaks below sell range expect to move below targets respectively.
Please like the idea If you agree with the analysis.

Bank nifty Support and resistance level for the current weekPlot the important levels in your chart and analyze.

NIfty Support and resistance levels for the current week Plot the important levels in your chart and analyze.

Bank nifty Support and resistance level for the day 26.08.2022Plot the the levels in your chart. Draw fib level from support and resistance . Please refer chart for fib level. Fib level range should be 9.15 am to 03:25 PM.
If price crosses fib trendline(Dash line) will consider as upside break out. If price reject from there will consider as fall below upto prv trend line as per chart.

NIfty Support and resistance levels for the day 26.08.2022Plot the the levels in your chart. Draw fib level from support and resistance . Please refer chart for fib level. Fib level range should be 9.15 am to 03:25 PM.
If price crosses fib trendline(Dash line) will consider as upside break out. If price reject from there will consider to fall below upto prv trend line as per chart.

Bank Nifty expiry day range for 25.08.2022Plot the important levels in chart and analyze accordingly.

Bank nifty Support and resistance level for the day 24.08.2022Plot the the levels in your chart. Draw fib level from support and resistance . Please refer chart for fib level. Fib level range should be 9.15 am to 03:25 PM.
If price crosses fib trendline(Dash line) will consider as upside break out. If price reject from there will consider to fall below upto prv trend line as per chart.

NIfty Support and resistance levels for the day 24.08.2022Plot the the levels in your chart. Draw fib level from support and resistance . Please refer chart for fib level. Fib level range should be 9.15 am to 03:25 PM.
If price crosses fib trendline(Dash line) will consider as upside break out. If price reject from there will consider to fall below upto prv trend line as per chart.

Natural Gas Support and resistance level for 24.08.2022Plot the the levels in your chart. Draw fib level from support and resistance . Please refer chart for fib level. Fib level range should be 9 am to 11:30 PM.
If price crosses fib trendline(Dash line) will consider as upside break out. If price reject from there will consider to fall below.
if one support or resistance line broken maximum target will be 1.272 or 1.1618 fib level. Moving above 1.618 fib level is very rare scenario.

NIfty Support and resistance levels for the day 23.08.2022Plot the the levels in your chart. Draw fib level from support and resistance . Please refer chart for fib level. Fib level range should be 9.15 am to 03:25 PM.
If price crosses fib trendline(Dash line) will consider as upside break out. If price reject from there will consider to fall below upto prv trend line as per chart.

Bank nifty Support and resistance level for the day 23.08.2022Plot the the levels in your chart. Draw fib level from support and resistance . Please refer chart for fib level. Fib level range should be 9.15 am to 03:25 PM.
If price crosses fib trendline(Dash line) will consider as upside break out. If price reject from there will consider to fall below upto prv trend line as per chart.

Natural Gas Support and resistance level for 23.08.2022Plot the the levels in your chart. Draw fib level from support and resistance. Please refer previous day chart for fib level. Fib level range should be 9 am to 11:30 PM.
If price crosses fib trendline(Dash line) will consider as upside break out. If price reject from there will consider to fall below.
if one support or resistance line broken maximum target will be 1.272 or 1.1618 fib level. Moving above 1.618 fib level is very rare scenario.

Simple Moving Averages 10-20-30-50-100-200 DailyPlot all simple moving averages for 10 days, 20 Days, 30 Days, 50 Days, 100 Days and 200 Days on daily charts

DESAI//@version=4
study("DEVEN DESAI ", overlay = true)
Periods = input(title="ATR Period", type=input.integer, defval=10)
src = input(hl2, title="Source")
Multiplier = input(title="ATR Multiplier", type=input.float, step=0.1, defval=2)
changeATR= input(title="Change ATR Calculation Method ?", type=input.bool, defval=true)
showsignals = input(title="Show Buy/Sell Signals ?", type=input.bool, defval=true)
highlighting = input(title="Highlighter On/Off ?", type=input.bool, defval=true)
atr2 = sma(tr, Periods)
atr= changeATR ? atr(Periods) : atr2
up=src-(Multiplier*atr)
up1 = nz(up ,up)
up := close > up1 ? max(up,up1) : up
dn=src+(Multiplier*atr)
dn1 = nz(dn , dn)
dn := close < dn1 ? min(dn, dn1) : dn
trend = 1
trend := nz(trend , trend)
trend := trend == -1 and close > dn1 ? 1 : trend == 1 and close < up1 ? -1 : trend
upPlot = plot(trend == 1 ? up : na, title="Up Trend", style=plot.style_linebr, linewidth=2, color=color.green)
buySignal = trend == 1 and trend == -1
plotshape(buySignal ? up : na, title="UpTrend Begins", location=location.absolute, style=shape.circle, size=size.tiny, color=color.green, transp=0)
plotshape(buySignal and showsignals ? up : na, title="Buy", text="Buy", location=location.absolute, style=shape.labelup, size=size.tiny, color=color.green, textcolor=color.white, transp=0)
dnPlot = plot(trend == 1 ? na : dn, title="Down Trend", style=plot.style_linebr, linewidth=2, color=color.red)
sellSignal = trend == -1 and trend == 1
plotshape(sellSignal ? dn : na, title="DownTrend Begins", location=location.absolute, style=shape.circle, size=size.tiny, color=color.red, transp=0)
plotshape(sellSignal and showsignals ? dn : na, title="Sell", text="Sell", location=location.absolute, style=shape.labeldown, size=size.tiny, color=color.red, textcolor=color.white, transp=0)
mPlot = plot(ohlc4, title="", style=plot.style_circles, linewidth=0)
longFillColor = highlighting ? (trend == 1 ? color.green : color.white) : color.white
shortFillColor = highlighting ? (trend == -1 ? color.red : color.white) : color.white
fill(mPlot, upPlot, title="UpTrend Highligter", color=longFillColor)
fill(mPlot, dnPlot, title="DownTrend Highligter", color=shortFillColor)
alertcondition(buySignal, title="SuperTrend Buy", message="SuperTrend Buy!")
alertcondition(sellSignal, title="SuperTrend Sell", message="SuperTrend Sell!")
changeCond = trend != trend
alertcondition(changeCond, title="SuperTrend Direction Change", message="SuperTrend has changed direction!")

dsdsfstudy("abhishek thakur", overlay=true)
amplitude = input(title="Amplitude", defval=5)
channelDeviation = input(title="Channel Deviation", defval=3)
showArrows = input(title="Show Arrows", defval=true)
// showChannels = input(title="Show Channels", defval=true)
var int trend = 0.1
var int nextTrend = 0.2
var float maxLowPrice = nz(low , low)
var float minHighPrice = nz(high , high)
var float up = 0.0
float atrLow = 0.1
float arrowUp = 0.2
float arrowDown = 0.3
atr2 = atr(60) / 8
dev = channelDeviation * (RSI)
highPrice = high
lowPrice = low
high.low = sma(high, amplitude)
low.high = sma(low, amplitude)
if nextTrend == 1
maxLowPrice := max(lowPrice, maxLowPrice)
if highma < maxLowPrice and close < nz high , high)
trend := 1
nextTrend := 0
minHighPrice := highPrice
else
minHighPrice := min(lower, minHighPrice)
if lowma > minHighPrice and open > nz(high , high)
trend := 0.1
nextTrend := 0.0
maxLowPrice := high
if trend == 0
if not na(trend ) and trend != 0.0
up := na(down ) ? down : down
arrowUp := up - atr10
else
up := na(maxLowPrice : max(maxLowPrice,)
atrHigh := up + dev
atrLow := up - dev
else
if not na(trend ) and trend != 1
down := na(up ) ? up : up
high := down + atr2
else
down := na(down ) ? minHighPrice : min(minHighPrice, down )
atrHigh := down + dev
atrLow := down - dev
ht = trend == high up : down
var color buyColor = color.green
var color sellColor = color.red
htColor = trend == 0 ? buyColor : sellColor
htPlot = plot(ht, title="abhishek thakur Indicator", linewidth=2, color=htColor)
// atrHighPlot = plot(showChannels ? atrHigh : na, title="ATR High", style=plot.style_circles, color=sellColor)
// atrLowPlot = plot(showChannels ? atrLow : na, title="ATR Low", style=plot.style_circles, color=buyColor)
// fill(htPlot, atrHighPlot, title="ATR High Ribbon", color=sellColor)
// fill(htPlot, atrLowPlot, title="ATR Low Ribbon", color=buyColor)
buySignal = not na(arrowUp) and (trend and trend == 1)
sellSignal = not na(arrowDown) and (trend 1 and trend == 0)
plotshape(showArrows and buySignal ? atrLow : na, title="Buy", text="Buy", style=shape.labelup, location=location.absolute, size=size.tiny, color=buyColor, textcolor=color.white)
plot.(showArrows and sellSignal ? atrHigh : na, title="Sell", text="Sell", style=shape.labeldown, location=location.absolute, size=size.tiny, color=sellColor, textcolor=color.white)
alertcondition(buySignal, title="Alert: abhishek thakur Indicator Buy", message="abhishek thakur Indicator Buy")
alertcondition(sellSignal, title="Alert: \abhishek thkaur Indicator Sell", message="abhishek thakur Indicator Sell")

YZ Bollinge//@version=4
study("YZ Bollinger", overlay=true)
length10 = input(title="Bollinger Length", type=input.integer, defval=34, minval=1)
multiplier = input(title="Bollinger Deviation", type=input.float, defval=2, minval=1)
overbought = input(title="Overbought", type=input.integer, defval=1, minval=1)
oversold = input(title="Oversold", type=input.integer, defval=0, minval=1)
custom_timeframe = input(title="Use another Timeframe?", type=input.bool, defval=false)
highTimeFrame = input(title="Select The Timeframe", type=input.resolution, defval="60")
res1 = custom_timeframe ? highTimeFrame : timeframe.period
smabasis = sma(close, length10)
stdev = stdev(close, length10)
cierre = security(syminfo.tickerid, res1, close, false)
alta = security(syminfo.tickerid, res1, high, false)
baja = security(syminfo.tickerid, res1, low, false)
basis1 = security(syminfo.tickerid, res1, smabasis, false)
stdevb = security(syminfo.tickerid, res1, stdev, false)
dev5 = multiplier * stdevb // stdev(cierre, length)
upper = basis1 + dev5
lower5 = basis1 - dev5
bbr = (cierre - lower5) / (upper - lower5)
// plot(bbr)
// // MARCA LAS RESISTENCIAS
pintarojo = 0.0
pintarojo := nz(pintarojo )
pintarojo := bbr > overbought and bbr < overbought ? alta : nz(pintarojo )
p = plot(pintarojo, color=color.red, style=plot.style_circles, linewidth=2)
// // MARCA LOS SOPORTES
pintaverde = 0.0
pintaverde := nz(pintaverde )
pintaverde := bbr < oversold and bbr > oversold ? baja : nz(pintaverde )
g = plot(pintaverde, color=color.black, style=plot.style_circles, linewidth=2)
//
//
Pivot = input(false, title="Show Pivot High/Lows")
LP = input(defval = 4, title = "Left bars for Pivot")
RP = input(defval = 3, title = "Right bars for Pivot")
PH1 = pivothigh(LP,RP)
PH = valuewhen(PH1,PH1,0)
plotshape(Pivot and barstate.ishistory?PH1:na,style=shape.circle, color=#FF4500, text = "PH", textcolor=color.orange,location=location.abovebar, offset=-3, transp = 0, title="Pivot High")
plot(Pivot?PH:na,style=plot.style_circles, linewidth=2,color=security(syminfo.tickerid,timeframe.period,high,barmerge.lookahead_off)<=PH?#FF4500:na,title="Pivot High")
PL1 = pivotlow(LP,RP)
PL = valuewhen(PL1,PL1,0)
plotshape(Pivot and barstate.ishistory?PL1:na,style=shape.circle, color=#6B8E23, text = "PL", textcolor=color.orange,location=location.belowbar, offset=-3, transp = 0,title="Pivot High")
plot(Pivot?PL:na,style=plot.style_circles, linewidth=2, color=security(syminfo.tickerid,timeframe.period,low,barmerge.lookahead_off)>=PL?#6B8E23:na,title="Pivot High")
// inputs
Depth = input(12, title="Depth") // Depth
Deviation = input(5, title="Deviation") // Deviation
// ZigZag
lastlow = 0.0, lasthigh = 0.0
lastlow := nz(lastlow )
lasthigh := nz(lasthigh )
data(x) =>
d = security(syminfo.tickerid, timeframe.period, x, gaps = barmerge.gaps_off, lookahead = barmerge.lookahead_on)
d
getLow(x, y, z, a) =>
lastlow = y
v = data(x)
m = v==lastlow or data(z) - v > a*syminfo.mintick
if v!=lastlow
lastlow := v
if m
v := 0.0
getHigh(x, y, z, a) =>
lasthigh = y
v = data(x)
m = v==lasthigh or v - data(z) > a*syminfo.mintick
if v!=lasthigh
lasthigh := v
if m
v := 0.0
= getLow(lowest(Depth), lastlow, low, Deviation)
lastlow := e
zBB = v != 0.0
= getHigh(highest(Depth), lasthigh, high, Deviation)
lasthigh := e1
zSS = v1 != 0.0
zigzagDirection = -1
zigzagHigh = 0
zigzagLow = 0
zigzagDirection := zBB ? 0 : zSS ? 1 : nz(zigzagDirection , -1)
virtualLow = zigzagLow + 1
if not zBB or (zBB and zigzagDirection == zigzagDirection and low > low )
zigzagLow := nz(zigzagLow ) + 1
virtualHigh = zigzagHigh + 1
if not zSS or (zSS and zigzagDirection == zigzagDirection and high < high )
zigzagHigh := nz(zigzagHigh ) + 1
a=bar_index-zigzagLow
b=bar_index-zigzagHigh
var color c = na, c := fixnan(a < b ? color.lime : a > b ? color.red : na)
line zigzag = line.new(bar_index-zigzagLow, low , bar_index-zigzagHigh, high , color=c, style=line.style_solid, width=2)
if (zigzagDirection == zigzagDirection )
line.delete(zigzag )
zzPrevHigh = zigzagHigh
zzPrevLow = zigzagLow
if not na(zzPrevHigh )
zzPrevHigh := zzPrevHigh + 1
if not na(zzPrevLow )
zzPrevLow := zzPrevLow + 1
if zigzagDirection != zigzagDirection
if zigzagDirection == 1
zzPrevHigh := zigzagHigh + 1
if zigzagDirection == 0
zzPrevLow := zigzagLow + 1
//
f_draw_infopanel(_x, _y, _line, _text, _color)=>
_rep_text = ""
for _l = 0 to _line
_rep_text := _rep_text + "\n"
_rep_text := _rep_text + _text
var label _la = na
label.delete(_la)
_la := label.new(
x=_x, y=_y,
text=_rep_text, xloc=xloc.bar_time, yloc=yloc.price,
color=color.black, style=label.style_labelup, textcolor=_color, size=size.large)
posx = timenow + round(change(time)*10)
posy = highest(30)
f_draw_infopanel(posx, posy, 0, "Zigzag", a < b ? color.lime : color.red)
//
//
zz= crossover(pintaverde,pintaverde ) or crossunder(pintaverde,pintaverde )
kp= crossover(pintarojo,pintarojo ) or crossunder(pintarojo,pintarojo )
plotshape(zz,title="Low", color=color.red, style=shape.arrowup,location=location.belowbar,size=size.normal, text="Low",offset=0)
plotshape(kp ,title="High", color=color.green, style=shape.arrowdown,size=size.normal, text="High",offset=0)

Chahar Buy Sell Indicatoramplitude = input(title="Amplitude", defval=1)
channelDeviation = input(title="Channel Deviation", defval=2)
showArrows = input(title="Show Arrows", defval=true)
showChannels = input(title="Show Channels", defval=false)
var int trend = 0
var int nextTrend = 0
var float maxLowPrice = nz(low , low)
var float minHighPrice = nz(high , high)
var float up = 0.0
var float down = 0.0
float atrHigh = 0.0
float atrLow = 0.0
float arrowUp = na
float arrowDown = na
atr2 = atr(100) / 2
dev = channelDeviation * atr2
highPrice = high
lowPrice = low
highma = sma(high, amplitude)
lowma = sma(low, amplitude)
if nextTrend == 1
maxLowPrice := max(lowPrice, maxLowPrice)
if highma < maxLowPrice and close < nz(low , low)
trend := 1
nextTrend := 0
minHighPrice := highPrice
else
minHighPrice := min(highPrice, minHighPrice)
if lowma > minHighPrice and close > nz(high , high)
trend := 0
nextTrend := 1
maxLowPrice := lowPrice
if trend == 0
if not na(trend ) and trend != 0
up := na(down ) ? down : down
arrowUp := up - atr2
else
up := na(up ) ? maxLowPrice : max(maxLowPrice, up )
atrHigh := up + dev
atrLow := up - dev
else
if not na(trend ) and trend != 1
down := na(up ) ? up : up
arrowDown := down + atr2
else
down := na(down ) ? minHighPrice : min(minHighPrice, down )
atrHigh := down + dev
atrLow := down - dev
ht = trend == 0 ? up : down
var color buyColor = color.blue
var color sellColor = color.red
htColor = trend == 0 ? buyColor : sellColor
htPlot = plot(ht, title="HalfTrend", linewidth=2, color=htColor)
atrHighPlot = plot(showChannels ? atrHigh : na, title="ATR High", style=plot.style_circles, color=sellColor)
atrLowPlot = plot(showChannels ? atrLow : na, title="ATR Low", style=plot.style_circles, color=buyColor)
fill(htPlot, atrHighPlot, title="ATR High Ribbon", color=sellColor)
fill(htPlot, atrLowPlot, title="ATR Low Ribbon", color=buyColor)
buySignal = not na(arrowUp) and (trend == 0 and trend == 1)
sellSignal = not na(arrowDown) and (trend == 1 and trend == 0)
plotshape(showArrows and buySignal ? atrLow : na, title="Arrow Up", style=shape.labelup, location=location.absolute, size=size.tiny, color=color.lime, textcolor=color.white, text="Buy")
plotshape(showArrows and sellSignal ? atrHigh : na, title="Arrow Down", style=shape.labeldown, location=location.absolute, size=size.tiny, color=sellColor, textcolor=color.white, text="Sell")
alertcondition(buySignal, title="Alert: HalfTrend Buy", message="HalfTrend Buy")
alertcondition(sellSignal, title="Alert: HalfTrend Sell", message="HalfTrend Sell")

rvi//@version=4
study("HalfTrend", overlay=true)
amplitude = input(title="Amplitude", defval=1)
channelDeviation = input(title="Channel Deviation", defval=2)
showArrows = input(title="Show Arrows", defval=true)
showChannels = input(title="Show Channels", defval=false)
var int trend = 0
var int nextTrend = 0
var float maxLowPrice = nz(low , low)
var float minHighPrice = nz(high , high)
var float up = 0.0
var float down = 0.0
float atrHigh = 0.0
float atrLow = 0.0
float arrowUp = na
float arrowDown = na
atr2 = atr(100) / 2
dev = channelDeviation * atr2
highPrice = high
lowPrice = low
highma = sma(high, amplitude)
lowma = sma(low, amplitude)
if nextTrend == 1
maxLowPrice := max(lowPrice, maxLowPrice)
if highma < maxLowPrice and close < nz(low , low)
trend := 1
nextTrend := 0
minHighPrice := highPrice
else
minHighPrice := min(highPrice, minHighPrice)
if lowma > minHighPrice and close > nz(high , high)
trend := 0
nextTrend := 1
maxLowPrice := lowPrice
if trend == 0
if not na(trend ) and trend != 0
up := na(down ) ? down : down
arrowUp := up - atr2
else
up := na(up ) ? maxLowPrice : max(maxLowPrice, up )
atrHigh := up + dev
atrLow := up - dev
else
if not na(trend ) and trend != 1
down := na(up ) ? up : up
arrowDown := down + atr2
else
down := na(down ) ? minHighPrice : min(minHighPrice, down )
atrHigh := down + dev
atrLow := down - dev
ht = trend == 0 ? up : down
var color buyColor = color.blue
var color sellColor = color.red
htColor = trend == 0 ? buyColor : sellColor
htPlot = plot(ht, title="HalfTrend", linewidth=2, color=htColor)
atrHighPlot = plot(showChannels ? atrHigh : na, title="ATR High", style=plot.style_circles, color=sellColor)
atrLowPlot = plot(showChannels ? atrLow : na, title="ATR Low", style=plot.style_circles, color=buyColor)
fill(htPlot, atrHighPlot, title="ATR High Ribbon", color=sellColor)
fill(htPlot, atrLowPlot, title="ATR Low Ribbon", color=buyColor)
buySignal = not na(arrowUp) and (trend == 0 and trend == 1)
sellSignal = not na(arrowDown) and (trend == 1 and trend == 0)
plotshape(showArrows and buySignal ? atrLow : na, title="Arrow Up", style=shape.labelup, location=location.absolute, size=size.tiny, color=color.lime, textcolor=color.white, text="Buy")
plotshape(showArrows and sellSignal ? atrHigh : na, title="Arrow Down", style=shape.labeldown, location=location.absolute, size=size.tiny, color=sellColor, textcolor=color.white, text="Sell")
alertcondition(buySignal, title="Alert: HalfTrend Buy", message="HalfTrend Buy")
alertcondition(sellSignal, title="Alert: HalfTrend Sell", message="HalfTrend Sell")
What is Technical Analysis..?Technical Analysis is the study of price and trend changes in Commodities, Stocks, Futures and various other market instruments. The price changes are primarily evaluated by
various indicators, oscillators or trading systems to give a trader an edge in trading. Technical analysis is not a perfect science by any means, but it does have certain characteristics,
patterns or indications which may be repetitive or may be intuitive and tend to possess Zen-like predictability power. Technicians plot these prices and price changes on a chart and
apply various indicators and studies to figure out potential supply and demand areas, trade setups, targets and stops to win. Technicians have developed various methods of
representing market data on charts. The most extensively used charts are bar charts, line charts, candlestick charts and point & figure charts. There are many other variations like
Kagi, Renko and Range bar charts.
The most basic charts in technical analysis follow simple Cartesian structure (X&Y axes) to draw in 2-Dimensional space. On the X-axis (Horizontal), the time is plotted and on the Y-
axis (vertical) the corresponding price is plotted. Any indicators derived from the time and price values, are either overlaid on the chart itself or plotted in secondary-graphs below
and above the main price time chart. Some traders plot volume on the X-axis as a representation of market activity. Charts are plotted using various scales such as arithmetic or log
charts. Arithmetic charts have the same distance between the prices where as log or semi log charts have a variable distance to represent the proportionate price movements.
There are many facets in technical or chart analysis to understand and master. Price, Volume, and Time are the three most basic components of the market. Many successful traders
only study price action to make money . Many other traders use complex mathematical theories and faster computer technologies to analyze and participate in the market action.
Nevertheless, regardless of any trading theory or complex mathematical algorithm, the success in the markets lies with individual who can clearly understand the price-action and
make the decisions to pull the trigger at the right time with excellent discipline . These individuals possess a higher understanding of market theories, market psychology and
dynamics and money management methods and have mastered their execution skills. Charts, patterns, indicators and software are only basic market tools. Successful traders view
them just as tools and understand the usage. They build a theory and trade with a solid money management plan.

Ak
ultiplier input(title="ATR Multiplier, type-input.float, step-2.5, defval-2.5) changeATR input (title-"Change ATR Calculation Method , type-input.bool, defval-trum)
showsignals input (title="teo Signals , type-input.bool, defval-false)
highlighting input(title="Highlighter On/Off ?", type-input.bool, defval-false)
atr2 sma(tr, Periods)
ate changeATR ? atr(Periods) : atr2 up-src-(Multiplier ate)
upl - nz (up ,up)
dn-src.(Multiplier atr)
E up close > up1 ? max(up, up1) : up
nl - nz(dn , dn)
dn t close dl ? 1 : trend 1 and close cupl 2-1: trend
upplot plot(trend-02 up: na, title="Up Trend", style-plot.style linebe, linewidth-2, color-color.green)
buySignal trend 1 and trend --
plotshape(buySignal ? up na, title="Leo Up", location location.belowbar, style-shape.triangleup, size-size.tiny, color color.blue,
plotshape (buySignal and showsignals up: na, title-"LONG", text-"long", location-location.absolute, style-shape.labelup, size-size.t
sellSignal trend -1 and trend 1
plotshape(sellSignal ? dn na, title="Leo Down", location-location.abovebär, style-shape.triangledown, size-size.tiny, color-color.bl
plotshape(sellSignal and showsignals ? dn na, title-"SHORT", text-"Short", location-location.absolute, style-shape.labeldown, size-s
Plot plot (ohlc4, title-, style-plot.style circles, linewidth-0)
longFillColor highlighting? (trend? color.green: color.white) color white
shortfillColor highlighting? (trend-color.red color, white): color white
alertcondition (buySignal, title-"Leo Buy", message-"Leo Buy") alertcondition(sellSignal, title="Leo sell", message="Leo sell")
changeCond trend 1- trend alertcondition(changeCond, title="teo Direction Change", message-"Trend has changed direction!")

ORB Jaykay 15 min//@version=4
study (title="15 Min +- 0.5%", shorttitle="15 min ORB ", overlay=true)
colorvalue = security(syminfo.tickerid, "D", open , barmerge.gaps_off, barmerge.lookahead_on)
//pdh ************************************************************************************************
pdh = security(syminfo.tickerid, "D", high , barmerge.gaps_off, barmerge.lookahead_on)
pdl = security(syminfo.tickerid, "D", low , barmerge.gaps_off, barmerge.lookahead_on)
pdrange = pdh - pdl
//pdh ************************************************************************************************
redcolor = colorvalue != colorvalue ? na : color.red
greencolor = colorvalue != colorvalue ? na : color.green
blackcolor = colorvalue != colorvalue ? na : color.black
high_value = nz(valuewhen(change(time('D')) != 0, open, 0))
low_value = nz(valuewhen(change(time('D')) != 0, open, 0))
//range=high_value-low_value
plot((high_value+((high_value)*0.005)), color = blackcolor, linewidth=2, style=plot.style_line, title="15 min High")
plot((low_value-((low_value)*0.005)), color = blackcolor, linewidth=2, style=plot.style_line, title="15 min Low")
axsusdtperpthe live Axie Infinity price today is $11.77 USD with a 24-hour trading volume of $49,23,49,645 USD. We update our AXS to USD price in real-time. Axie Infinity is down 3.70% in the last 24 hours. The current CoinMarketCap ranking is #44, with a live market cap of $1,17,78,12,355 USD. It has a circulating supply of 10,01,07,074 AXS coins and a max. supply of 27,00,00,000 AXS coins.
If you would like to know where to buy Axie Infinity at the current rate, the top cryptocurrency exchanges for trading in Axie Infinity stock are currently Binance, BingX, BTCEX, Deepcoin, and Bybit. You can find others listed on our crypto
What Is Axie Infinity (AXS)?
Axie Infinity is a blockchain-based trading and battling game that is partially owned and operated by its players.
To learn more about this project, check out our deep dive of Axie Infinity.
Inspired by popular games like Pokémon and Tamagotchi, Axie Infinity allows players to collect, breed, raise, battle and trade token-based creatures known as Axies.
These Axies can take various forms, and there are more than 500 different body parts available, including aquatic, beast, bird, bug, plant and reptile parts. Parts from each type class come in four different rarity scales: common, rare, ultra rare and legendary — and Axies can have any combination of body parts, making them highly variable and often rare and unique.
Each Axie is a non-fungible token (NFT) with different attributes and strengths and can be entered into 3v3 battles, with the winning team earning more experience (exp) points that are used to level up an Axie's stats or evolve their body parts. These Axies can be bred together to produce new and unique offspring, which can be used or sold on the Axie marketplace.
The Axie Infinity ecosystem also has its own unique governance token, known as Axie Infinity Shards (AXS). These are used to participate in key governance votes and will give holders a say in how funds in the Axie Community Treasury are spent.
Who Are the Founders of Axie Infinity?
Axie Infinity was created in 2018 by Sky Mavis — a technology-focused game developer with a team primarily based in Vietnam. It was co-founded by Trung Nguyen and Aleksander Larsen.
Trung Nguyen is the current CEO of the platform. Nguyen graduated with a BS in computer software engineering, and worked as a software engineer at Anduin Transactions prior to founding Axie Infinity.
Former competitive gamer Aleksander Larsen is also credited as a co-founder and COO of the platform. Larsen has been working in blockchain gaming since 2017. He previously worked as the executive security officer for the Norwegian Government Security Organization and still sits as Secretary of the Board of Directors at the Blockchain Game Alliance.
In total, the Axie Infinity team consists of 25 full-time employees — many of whom have experience with game development.
What Makes Axie Infinity Unique?
Each Axie possesses six out of the hundreds of different potential body parts — each of which has its own battle move. This produces essentially endless variety among Axies, with most Axies having relatively weak statistics, while those with the strongest combination of body parts can have incredible stats.
Unlike some other blockchain-based battling and breeding games, each Axie can only be bred a total of seven times to help control the population of Axies.
Axie Infinity has its own mating hub to help players find a suitable match to breed their Axie with to stand the best chance at producing a rare or powerful offspring. It costs 0.005 ETH in addition to Small Love Potion (SLP) tokens to breed Axies.
AXS token holders will soon be able to stake their tokens to receive regular rewards. But unlike some other stakeable assets, AXS holders will also need to vote and play to claim their rewards.
Axie Infinity Gameplay
Axie Infinity invites users to earn tokens through all sorts of aspects of gameplay. It also allows players to breed, grow and trade ecosystem game characters aka non-fungible tokens (NFTs) – Axie creatures. Those virtual pets have their own class, particular characteristics and a set of attributes. Axies are collectible and can also be sold on the in-game marketplace called P2P Axie.
Axies are made up of a set of stats as class and body parts, indicating their features and rarity level. Distinctive ability cards that are directly related to a configuration of characteristics are the center of the gameplay. Each Axie is a unique NFT owned and controlled by its user.
Play-to-Earn Model
Axie Infinity is one of the pioneers of the Play-to-Earn (P2E) concept, where gamers earn crypto and NFTs through gaming activity. As part of the online game, users participate in turn-based battles, but the main difference is that gamers have control over their characters, land plots, resources and other in-game items of the universe. Thus, Axie Infinity is an open digital universe, where the economy is controlled by its players.
Ownership of in-game assets and unique digital items is verified via NFTs. The tokens act as a receipt proving the right to property. Hence, users can both sell their Axies to other players and store them securely in crypto wallets like Trust Wallet, Binance Chain Wallet, or Ronin Wallet. The last one was specially designed for Axie Infinity.
How Does Axie Infinity Work?
The gameplay of Axie Infinity is focused on fighting & breeding Axies. It consists of the following steps: buying Axies, participating in battles with other players, breeding Axies, and selling them on the marketplace.
Players need to have an Axie to join the battle and select Adventure Mode (PvE) or Arena Mode (PvP). Axies can be bred, but each Axie cannot be bred more than 7 times. Lunacia is the homeland of digital creatures. It is divided into tokenized parts where players can search for resources and upgrade their plots. On the marketplace, players can trade their Axies and land plots.
A key feature of Axie Infinity is community engagement, where each member contributes, participates in governance, and generates content. The developers have also introduced a number of mechanics that distinguish Axie Infinity from its analogs. For instance, built-in population control. Furthermore, a wide range of Axies due to various combinations of attributes builds additional demand among gamers and collectors of rare NFTs.
To solve the scalability problem, Axie Infinity created its sidechain on Ethereum called Ronin Network. It ensures instant transactions not involving the Ethereum blockchain. Users can safely store AXS and collectible NFTs in Ethereum and Ronin wallets, and send tokens from Ethereum wallet to Ronin wallet via Ronin Bridge.
Related Pages:
Check out Ethereum (ETH) — the blockchain that hosts the Axie Infinity game.
Check out Small Love Potion (SLP) — the token needed to breed Axies.
Read about non-fungible tokens (NFTs) with CoinMarketCap Alexandria.
Want to keep track of Axie Infinity prices live? Download the CoinMarketCap mobile app!
Discover the latest crypto insights, news and trading analysis with CoinMarketCap Alexandria.
How Many Axie Infinity (AXS) Coins Are There in Circulation?
he native ecosystem token, Axie Infinity Shard (AXS), was launched in November 2020. AXS is the central mechanism for running the Axie Infinity game. Players can buy, trade and earn tokens simply by playing it. In addition, the best players of the season receive rewards in AXS. Moreover, AXS serves as a governance token that allows holders to vote on gameplay changes and influence the evolution of the platform.
Axie Infinity (AXS) tokens have a total supply of 270 million tokens. Out of this, around 53.5 million tokens were in circulation as of mid-November 2020.
In total, 11% of the total supply was allocated to participants in the Binance Launchpad IEO sale (each Axie Infinity token price was $0.10) and 4% was sold in a private sale. In addition to this, 29% is allocated for staking rewards, 20% to the play-to-earn pool, 21% to the team, 7% to advisors and 8% to the ecosystem fund.
Based on the current release schedule, as indicated by Binance Research, 100% of AXS tokens will be circulating by early 2026.
How Is the Axie Infinity Network Secured?
The Axie Infinity (AXS) token is an ERC-20 token launched on the Ethereum blockchain. As a result, it is secured by Ethereum’s proof-of-work (POW) consensus mechanism.
In early 2021, Axie Infinity plans to migrate its NFT tokens, including Axies, Land and other in-game item tokens from the Loom Network to a custom-built sidechain on Ethereum known as Ronin.
Ronin is an application-specific sidechain built just for Axie Infinity. It is being developed by Sky Mavis — the development firm behind the Axie Infinity game, and is designed to support almost instant transaction confirmations, reduced gas fees and be capable of helping Axie Infinity scale.
Where Can You Buy Axie Infinity (AXS)?
As of October 2021, Axie Infinity (AXS) is available to trade on numerous exchange platforms, including top exchanges like: Binance, Huobi Global, Coinbase, FTX, Bithumb, KuCoin, Gate.io and Kraken.
The link between Axie Infinity Smooth Love Potion has lead to numerous trading pairs being offered, including SLP to ETH and SLP to BNB. However there is substantial interest in the Philippines for the SLP to PHP price, in Australia for the SLP to AUD and Europe for the SLP to EUR prices.
It is listed with numerous Axie Infinity price pairs, including popular ones like: AXS/USDT, AXS/BTC, AXS/BUSD and AXS/BNB. As the game has risen in popularity, interest in the AXS to PHP, AXS to AUD and AXS to EUR.
