Bullish# Define inputs
input lookback = 1;
input minVolumeMultiplier = 1.5;
# Calculate engulfing condition
def engulfingBullish = close > open and open < close and close > open;
def volumeMultiplier = volume / Average(volume, lookback);
# Plotting the bubble if engulfing condition is met with high volume
plot engulfingWithHighVolume = engulfingBullish and volumeMultiplier >= minVolumeMultiplier;
# Mark the candle with a bubble
AddChartBubble(engulfingWithHighVolume, high, "Bullish Engulfing", color.green, yes);
Search in ideas for "PLOT"

Bullish# Define inputs
input lookback = 1;
input minVolumeMultiplier = 1.5;
# Calculate engulfing condition
def engulfingBullish = close > open and open < close and close > open;
def volumeMultiplier = volume / Average(volume, lookback);
# Plotting the bubble if engulfing condition is met with high volume
plot engulfingWithHighVolume = engulfingBullish and volumeMultiplier >= minVolumeMultiplier;
# Mark the candle with a bubble
AddChartBubble(engulfingWithHighVolume, high, "Bullish Engulfing", color.green, yes);

dow jonesThe Dow Jones Live as I post this..... with the BLACK markings as PLOTTING 1...... The RED markings as ALTERNATE PLOT 2
There is NOTHING THAT IS PERMANENT IN THE MARKET. EVERYTHING CHANGES IN A """" FLASH"""


Crudeoil Support and resistance level for current swingCrudeoil trade in range bound. If range breaks will move to targets as plotted in chart. Important support and resistance levels are marked. plot the levels in your chart and analyze.

MINDTREE ShortStock could slide down to the plotted levels at the break of amber plot
Disclaimer:
The content of the idea and the interpretation of data are solely my personal views which being said I do not warrant its completeness or accuracy.
This idea published is purely intended for educational and informative purposes, I urge traders to make their own trading decisions based on their specific trading objectives and financial position

CANBK Short Stock could slide down to the plotted levels at the break of amber plot
Disclaimer:
The content of the idea and the interpretation of data are solely my personal views which being said I do not warrant its completeness or accuracy.
This idea published is purely intended for educational and informative purposes, I urge traders to make their own trading decisions based on their specific trading objectives and financial position

BANK NIFTY 10JAN LEVELSFriday, 7Jan, BN opened exactly at 37600 level, as published on Thursday and if it opened here the call was Buy. The 1st resistance level was 37861, apology for not plotting a green line above to indicate if it broke the 37861 go long for higher target.
Summary 7Jan
1. 38000 resistance level broken and 38100 level tested.
2. 37500 strong SUPPORT LEVEL. This was a price reversal area in todays 2nd trading session. You know the challenge is to predict the price reversal in a live market when price is falling atleast in my case. You sometimes go with a bias to buy but price continues to fall :). I am sure many of you are more seasoned and smart to take the right judgement. But My rule is to wait for a confirmation on a 15minute candle in confluence with strong support level/ zone. There are some trade confirmations like Nifty also showing reversal. And from here it gained almost 250 points after 2 small pull backs.
Monday 10Jan level
1. Interesting one- FII bought + 496 cr while DII sell -115 . FII put writing on Index options which is bulling indication
2. Monday trading day is a very narrow CPR day. Narrow CPR is considered a trending day. Once CPR is broken with a big candle the direction move can be seen.
On upside break above 37800. But if it breaks the trendline below then bearish downmove.
3. Price closing is at a bullish EMA cross - Bullish bias supported by bullish up trendline. Refer trendline plotted
4. Levels are marked. Red resistance and green to go long if red line resistance is broken
Note- anything can happen between weekend with news so best wait for Monday morning and see how the price opens and behave on chart. I worship the technicals unless something hits you as bad as Covid of 2020 or 9/11 twintower hit.
I always realised, FII and big players know the retail trader sentiments and surprise you and beat our moves. HAPPY WEEKEND!

Nifty Spot 14th SeptemberNifty Spot 14th Sep
I have plotted key levels which could prove sup and res for tomorrow.
I'm bullish for tomorrow.
These levels are based purely on Trendlines and spot levels.
No Indicators, OIs or Systems used.
Plot these levels and trade safe

#banknifty analysis for 25th May'2021 #banknifty analysis for 25th May'2021
All overlay & oscillators are overheated and RSI is making lower high, the index needs to cool down and we have monthly expiry this week. Play the green & red zone of the chart, positional short only below 33,900 below the closing.
RSI is plotted in the form of a histogram, you just need to change the "plot(rsi, "RSI", color=#8E1599, style=plot.style_histogram)" in your default RSI code.
Decision Line:- 34,900
Resistance:- 35,270 / 35,576 / 35,967
Support Zone :- 34,757 / 34,573 / 34,245 / 34,015
One of the best forms of PA action is not to predict but to act on the price, chart tells you where, when & how to act on price. Wait for the decision points on the chart to act else don't trade.
E.g. One of the important DP is the weekly low, if the weekly low is broken, then only you will short else you won't.
John Maynard Keynes said, “the markets can remain irrational longer than you can remain solvent.” So be cautious and flexible as market conditions evolve.
Always trade what you see, never trade what you feel. Make this a habit, you won't be requiring any seminar, webinar, or mentor, you will be self-sufficient.
Regards,
SG

TATAMOTORS IN 15 MIINS CHART.Tata motors is trading at a crucial level. Looking at the chart, the price of stock is trading near 200 MA. There were very few data available on 15 min but after looking at bigger picture we were able to plot two good points for shorting TATA motors.
1) On bigger time frame , 45 min or 1 hour chart , stock is trading below 200 MA, indicating bearish trend.
2) Price action pattern of Rising wedge is plotted, that implies continuation of bearish trend.
3) Crossover of EMAs
If TATAMOTORS open flat wait for the price to break the support and continue down.
If TATAMOTORS open with gap down, wait for retest of support.
If TATAMOTORS open gap up, Look for my Bullish setup on that I will be posting right next after this

Minda Ind- An oppourtinity to investFirst of all Sorry for not plotting fancy and colorful things. I am posting this chart in a hurry.
I won't be posting any chart for next 10 days. We will start again soon....
Few things that are important in chart that this consolidation is pretty long and might take this stock at higher levels once it breks.
1st view:-
Chart has been moving in a channel for a long long time and now it is sustaining at higher levels.
Daily view:-
Look closely and you will find that price is now sticking to higher levels and slowly and steadily volume is also picking up the pace.
Finally a trend continuation view is already plotted on chart as a FLAG PATTERN.
Keep an eye folks. Cheers and Happy Trading.

Short Nifty with Elliott wave theory
elliott wave theory Plotting on Nifty Day Chart
1. Wave 1 Formation: from 10450(11 March,2020 Closing price) -9570(12 March Price) = 880
2 Wave 2 Formation: Repulsive Wave
3 Wave 3 Formation: 9992( 13 March Price) - 8323( 19 March Price) = 1669
4. Wave 4 Formation: Repulsive Wave
5. Wave 5 Formation: 8723 (20 March Price) - 7637 (23 March Price) = 1086
Wave 1 < Wave 5 < Wave 3
Tried to Plot Impulsive wave Form ABC: Last C Wave form @9300.
Now,

Can Decentraland Rise from The Multi Month Lows?Can Decentraland Rise from The Multi Month Lows?
Decentraland serves as a creative platform for artists, entrepreneurs, and entertainment seekers, offering a novel canvas for expression, commercial ventures, and amusement.
Moreover, The virtual expanse of Decentraland, known as the "Metaverse," consists of 90,601 unique plots of LAND. Each plot is an ERC-721 non-fungible token, signifying ownership of a 16m by 16m (256 square meters) which is a piece of virtual real estate, located at specific coordinates within the Metaverse.
From a price action analysis, decentraland crypto made a breakdown of a consolidation phase and has slumped near the multi month lows looking for a firm footing. It ranks 105th in the cryptoverse boasting a $624.8 Million market capitalization.
Moreover, the bulls seemed to be returning back in intraday as the price had jumped over 2.22% at the time of writing. The MACD lines have started converging indicating a possible continuation in the buying.

GUJGASLTD LongStock looks weak at the break of the orange plot , entry , sl & target plots on the chart

my//@version=4
study(title="Supply and Demand Zones",shorttitle="Supply / Demand",overlay=true)
//Daily zones
daily = input(title = "Daily",type = input.bool,defval=true)
dopen = security(syminfo.tickerid,'D',open,barmerge.gaps_off,barmerge.lookahead_on)
dayrange=(high-low)
dcol = color.red
r1 = security(syminfo.tickerid,'D',dayrange)
r2 = security(syminfo.tickerid, 'D', dayrange )
r3 = security(syminfo.tickerid, 'D', dayrange )
r4= security(syminfo.tickerid, 'D', dayrange )
r5= security(syminfo.tickerid, 'D', dayrange )
r6 = security(syminfo.tickerid, 'D', dayrange )
r7 = security(syminfo.tickerid, 'D', dayrange )
r8 = security(syminfo.tickerid, 'D', dayrange )
r9= security(syminfo.tickerid, 'D', dayrange )
r10= security(syminfo.tickerid, 'D', dayrange )
adr_10 = (r1+r2+r3+r4+r5+r6+r7+r8+r9+r10) /10
adr_9 = (r1+r2+r3+r4+r5+r6+r7+r8+r9) /9
adr_8 = (r1+r2+r3+r4+r5+r6+r7+r8) /8
adr_7 = (r1+r2+r3+r4+r5+r6+r7) /7
adr_6 = (r1+r2+r3+r4+r5+r6) /6
adr_5 = (r1+r2+r3+r4+r5) /5
adr_4 = (r1+r2+r3+r4) /4
adr_3 = (r1+r2+r3) /3
adr_2= (r1+r2)/2
adr_1 = r1
adrhigh10 = dopen+(adr_10/2)
adrhigh5 = dopen+(adr_5/2)
adrlow5 = dopen-(adr_5/2)
adrlow10 = dopen-(adr_10/2)
dayh5 = plot( daily? adrhigh5 : na, color = dcol)
dayh10 = plot( daily? adrhigh10 : na, color = dcol)
dayl5 = plot( daily? adrlow5 : na, color = dcol)
dayl10 = plot( daily? adrlow10 : na, color = dcol)
fill(dayh5,dayh10 , color=dcol)
fill(dayl5,dayl10,color=dcol)
//Weekly zones
weekly = input(title = "Weekly",type = input.bool,defval=true)
wopen = security(syminfo.tickerid,'W',open,barmerge.gaps_off,barmerge.lookahead_on)
weekrange=(high-low)
wcol = color.blue
wr1 = security(syminfo.tickerid,'W',weekrange)
wr2 = security(syminfo.tickerid, 'W', weekrange )
wr3 = security(syminfo.tickerid, 'W', weekrange )
wr4= security(syminfo.tickerid, 'W', weekrange )
wr5= security(syminfo.tickerid, 'W', weekrange )
wr6 = security(syminfo.tickerid, 'W', weekrange )
wr7 = security(syminfo.tickerid, 'W', weekrange )
wr8 = security(syminfo.tickerid, 'W', weekrange )
wr9= security(syminfo.tickerid, 'W', weekrange )
wr10= security(syminfo.tickerid, 'W', weekrange )
awr_10 = (wr1+wr2+wr3+wr4+wr5+wr6+wr7+wr8+wr9+wr10) /10
awr_9 = (wr1+wr2+wr3+wr4+wr5+wr6+wr7+wr8+wr9) /9
awr_8 = (wr1+wr2+wr3+wr4+wr5+wr6+wr7+wr8) /8
awr_7 = (wr1+wr2+wr3+wr4+wr5+wr6+wr7) /7
awr_6 = (wr1+wr2+wr3+wr4+wr5+wr6) /6
awr_5 = (wr1+wr2+wr3+wr4+wr5) /5
awr_4 = (wr1+wr2+wr3+wr4) /4
awr_3 = (wr1+wr2+wr3) /3
awr_2= (wr1+wr2)/2
awr_1 = wr1
awrhigh10 = wopen+(awr_10/2)
awrhigh5 = wopen+(awr_5/2)
awrlow5 = wopen-(awr_5/2)
awrlow10 = wopen-(awr_10/2)
weekh5 = plot( weekly? awrhigh5 : na, color = wcol)
weekh10 = plot( weekly? awrhigh10 : na, color = wcol)
weekl5 = plot( weekly? awrlow5 : na, color = wcol)
weekl10 = plot( weekly? awrlow10 : na, color = wcol)
fill(weekh5,weekh10,color=wcol)
fill(weekl5,weekl10,color=wcol)
//Monthly zones
monthly = input(title = "Monthly",type = input.bool,defval=true)
mopen = security(syminfo.tickerid,'M',open,barmerge.gaps_off,barmerge.lookahead_on)
monthrange=(high-low)
mcol = color.green
mr1 = security(syminfo.tickerid,'M',monthrange)
mr2 = security(syminfo.tickerid, 'M', monthrange )
mr3 = security(syminfo.tickerid, 'M', monthrange )
mr4= security(syminfo.tickerid, 'M', monthrange )
mr5= security(syminfo.tickerid, 'M', monthrange )
mr6 = security(syminfo.tickerid, 'M', monthrange )
mr7 = security(syminfo.tickerid, 'M', monthrange )
mr8 = security(syminfo.tickerid, 'M', monthrange )
mr9= security(syminfo.tickerid, 'M', monthrange )
mr10= security(syminfo.tickerid, 'M', monthrange )
amr_10 = (mr1+mr2+mr3+mr4+mr5+mr6+mr7+mr8+mr9+mr10) /10
amr_9 = (mr1+mr2+mr3+mr4+mr5+mr6+mr7+mr8+mr9) /9
amr_8 = (mr1+mr2+mr3+mr4+mr5+mr6+mr7+mr8) /8
amr_7 = (mr1+mr2+mr3+mr4+mr5+mr6+mr7) /7
amr_6 = (mr1+mr2+mr3+mr4+mr5+mr6) /6
amr_5 = (mr1+mr2+mr3+mr4+mr5) /5
amr_4 = (mr1+mr2+mr3+mr4) /4
amr_3 = (mr1+mr2+mr3) /3
amr_2= (mr1+mr2)/2
amr_1 = mr1
amrhigh10 = mopen+(amr_10/2)
amrhigh5 = mopen+(amr_5/2)
amrlom5 = mopen-(amr_5/2)
amrlom10 = mopen-(amr_10/2)
monthh5 = plot( monthly? amrhigh5 : na, color = mcol)
monthh10 = plot( monthly? amrhigh10 : na, color = mcol)
monthl5 = plot( monthly? amrlom5 : na, color = mcol)
monthl10 = plot( monthly? amrlom10 : na, color = mcol)
fill(monthh5,monthh10,color=mcol)
fill(monthl5,monthl10,color=mcol)

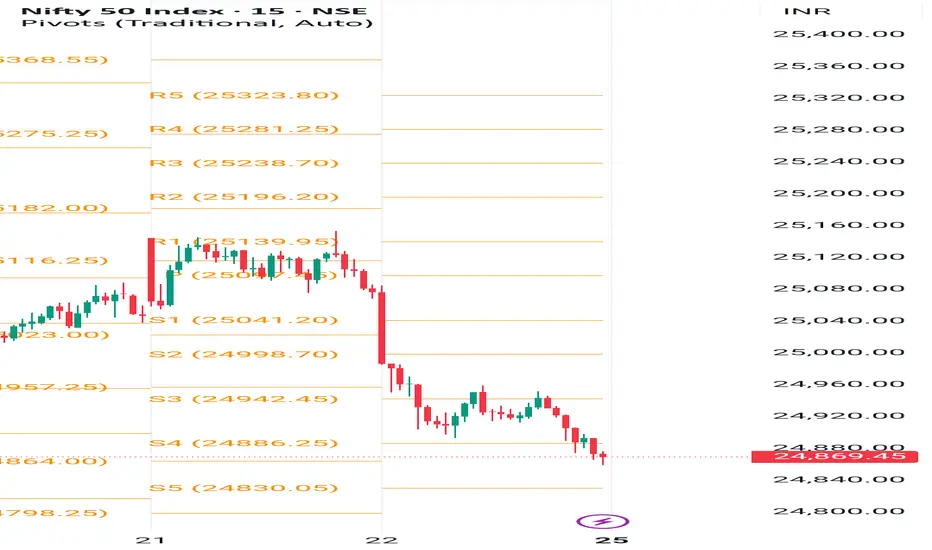
NIFTY 50 TODAYASs per my previous post now we are inside the ascending channel and looking like consolidation near lower trend line of the channel,but you should not be more bullish because nifty is forming EXPANDING TRIANGLE so be carefull at near TOP EDGE of the TRIANGLE which is ploted inside the gann fan in white colour.if channel is broken there is a RED inclined line which wil work as support if broken then nifty continue falling this is just for information not buy/sell call.

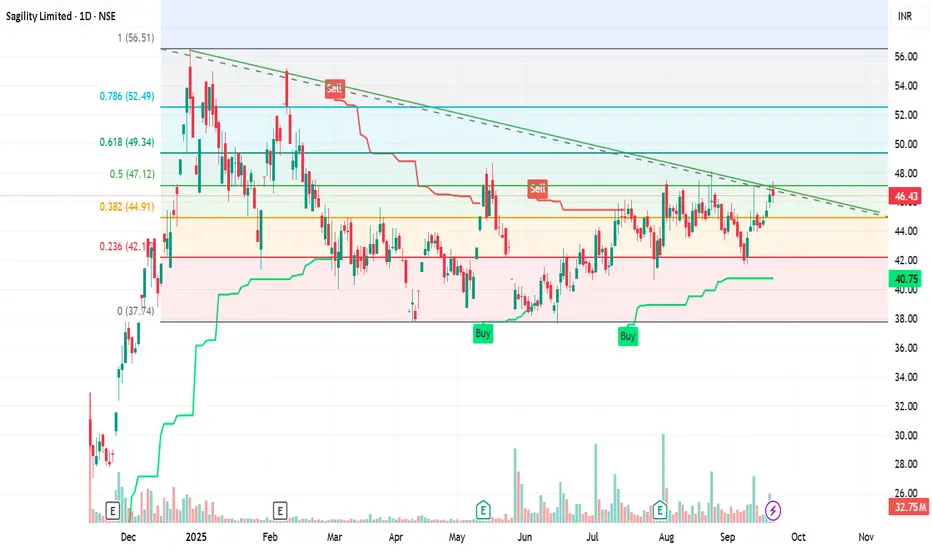
Sagility Breakout Technical AnalysisThe chart of Sagility Limited on the NSE reveals a technically rich setup with several key signals. Here's a breakdown of what it indicates:
📉 Trend Analysis
- Descending Trendline: The stock has been forming lower highs, suggesting a downtrend or bearish sentiment.
- Current Price: ₹45.60, down 1.40% on the day—still trading below key resistance levels.
🔍 Fibonacci Retracement
- Levels like 0.236, 0.382, 0.5, 0.618, and 0.786 are plotted.
- These help identify potential reversal zones. If price breaks above the 0.382 or 0.5 level, it could signal a bullish retracement.
🟩🟥 Support & Resistance Zones
- Green shaded areas: Strong support zones where buyers may step in.
- Red shaded areas: Resistance zones where selling pressure could emerge.
- Price is currently hovering near a support zone—watch for a bounce or breakdown.
📊 Volume & Momentum
- Volume bars show moderate activity, but no major spikes—suggesting consolidation.
- The green line (likely a moving average) is sloping downward, reinforcing the bearish bias unless price crosses above it.
🟢🔴 Buy/Sell Signals
- Recent “Sell” signal near the descending trendline confirms weakness.
- Previous “Buy” signals occurred near support zones—if price approaches those again, it may offer a short-term opportunity.
🧠 What to Watch For
- Breakout above the descending trendline: Could trigger bullish momentum.
- Breakdown below support: May lead to further downside.
- Volume confirmation: A spike in volume with price movement adds conviction
🧠 Strategic Takeaways
- Bullish bias only above ₹47.25 with confirmation.
- Bearish continuation if ₹42.625 breaks.
- Gann levels align well with Fibonacci zones—giving confluence
INDUS TOWER AT WEEKLY BREAKOUTIf you are loking for long you can take a chance after breakout sustained.
> here i ploted green line as support.
> Red line is as support.
now what to do you have to decide. this is just for information.

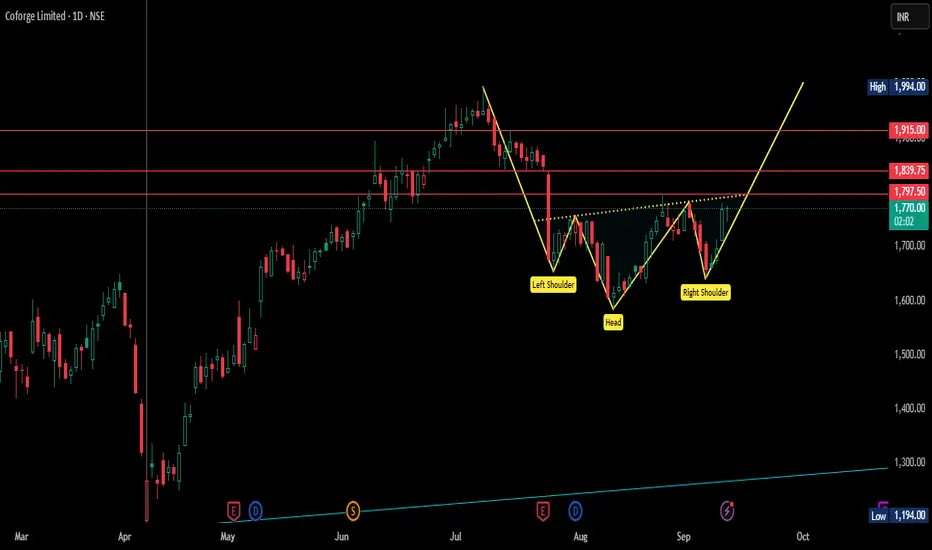
COFORGE FORMING INVERSE HEAD & SHOULDERHere i would like to show you all that COFORGE is forming inverse head and shoulder.
> there is ploted resistances as small targets in red colour.
> resistance lines are drawn simply which is it's previous high.
now it make you to decide whatn to do now.
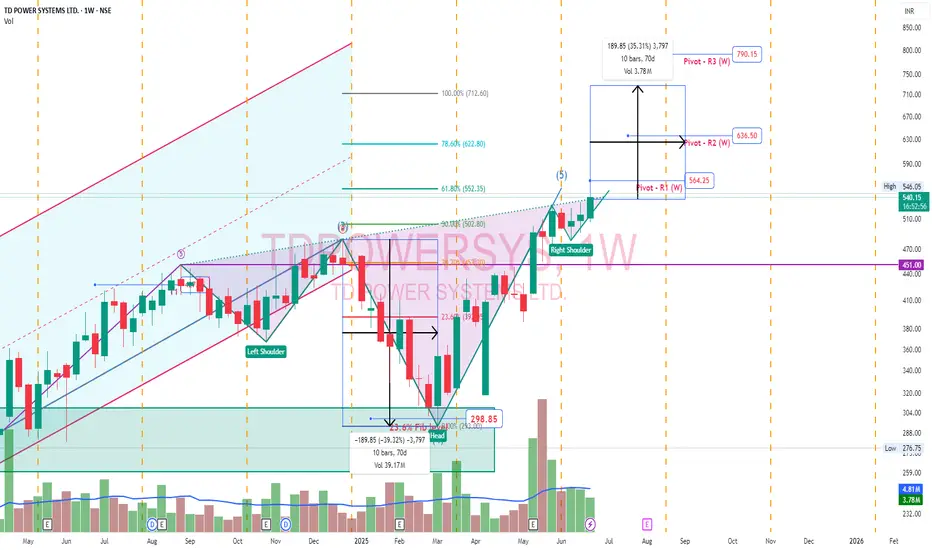
TdPowerSystem - Inverted Head & ShoulderTD Power Systems secured a ₹67 crore export order for traction motor components. This order is for delivery between 2026 and 2027
Inverted Head and Shoulder pattern. Pivot points plotted. Head would be ideal target. Right shoulder low would be long term stoploss.
AutoPerfect entry and exit automatically mark levels.
Each signal now comes with Stop Loss & Target plotted.
ATR-based SL/TP, configurable in settings (slATRmult, rrMultiple).
Alerts now include Entry, SL, and TP levels.
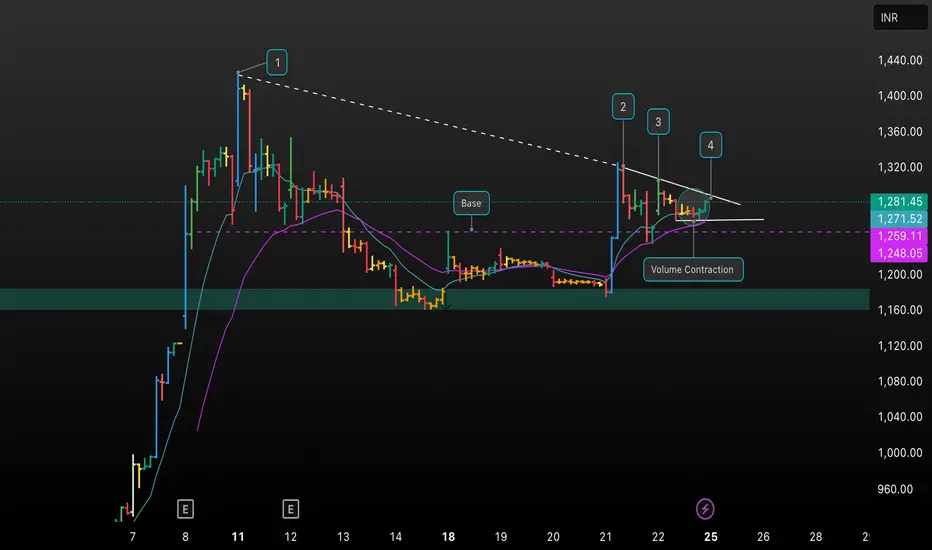
NSDL Volume Contraction Breakout Setup | Technical AnalysisThis chart showcases a detailed technical analysis of NSDL on the 45m timeframe, highlighting key price action zones, trendlines, and volume contraction patterns. I’ve marked the base formation, breakout attempts, and areas of interest using numbered points and indicator overlays. Notice the distinct volume contraction phase as price consolidates near resistance, potentially setting up a breakout. Key support/resistance levels and moving averages are also plotted.
Your feedback on this setup or alternative charting perspectives is welcome! Let’s discuss the probabilities and potential trade management for this breakout scenario.
This combination is clear, educational, and designed to invite discussion and engagement from traders and learners.