Bank nifty Trade Plan for 28 JAN 2022Bank nifty Trade Plan for 28 JAN 2022
Bank Nifty likely to open flat to small gap up.
Immediate resistance on the upside is 38300.
Any pull back to CPR and support getting confirmed we can possibly go long and if PDH is taken out we can see higher targets as plotted.
CPR getting compromised we can expect S1 & PDL.
Search in ideas for "PLOT"

Nifty todayThis is the Nifty50 chart at 5 minutes time frame... Here i ploted today levels for trading...
It is my point of view only....

BankNifty Intraday view for 08-11-2021Good evening all,
Last Week: Hope you had a safe Diwali. Like the range index was in. Nothin more about that. Only that, it has set up very well to move either ways.
Tomorrow: We have a range of 850 points that we need wait to be broken. Above 40160 and below 39300 we should have a good move. More optimistically above 40160 which also coincides with the daily chart plot.
So;
Long side view:
Buy above 40160
Target 1 zone 40350 - 40415
TSL above this
Target 2 - 40600
Target 3 zone 40830 - 40880
(Long SL - 40000)
---------------
Short side view:
Sell below 39300
Target 1 - 39135
TSL below this
Target 2 - 39000
Target 3 - 38850
(Short SL - 39500)
*** This is a view and not necessarily a trade recommendation ***
However, If you like my idea..., hit like, follow me, and do spread the word.

Auropharma BUY Auropharma ready to fire soon,
Based on technical analysis and trendline breakout, and demand supply zone. Target line plotted...

Bank Nifty Trade Plan for 02 Sep 2021Bank Nifty expected to open flat to small gap up.
Watch for possible reversal around 36715 zones.
Trade as shown in the levels plotted.

Nifty Trade Plan for 17 Aug 2021Nifty Trade Plan for 17 Aug 2021
Nifty expected to open Flat.
16528 looks to be a good support and if confirmed we can possibly take long positions and expect to test previous session
high around 16593 levels.
If 16593 taken on upside we can look for higher targets as plotted.
If 16480 compromised then we can expect possible shorting opportunities.

My indicator//@version=4
// l
//
strategy("Dr Om's ST Indicator v1.0", overlay = true, calc_on_every_tick=true)
atrPeriod1 = input(10, "ATR Length")
factor1 = input(3, "Factor")
rsi1input = input(50, "RSI")
wma1input = input(20, "WMA")
considerAtr = input(title="Consider ATR", type=input.bool, defval=false)
divideATRby = input(1.0, "ATR Buffer from ST (Divide ATR by)")
atrPeriod = input(14, "ATR period")
lotSize = input(100, "Lot size")
filterRsi1 = input(title="Consider RSI and WMA", type=input.bool, defval=false)
// Number of candles that need to be considered after the SuperTrend Candle has been formed.
enterCriteriaOffset = input(1, "Enter Criteria Offset from Supertrend Candle", options=)
rewardToRiskRatio = input(1.5, "Reward to Risk Ratio")
varip tradeNumber1 = 0
varip holdingLong1 = false
varip holdingShort1 = false
varip exitHoldingLong1 = false
varip exitHoldingShort1 = false
varip targetPrice = 0.0
varip priceFromSL = 0.0
targetPercentage = 2
// This is the buffer between the ST line and the candle. We can consider candles which are at a distance of atr/2 from the ST.
modifiedAtr = considerAtr ? (atr(atrPeriod) / divideATRby) : 0
// Supertrend line and direction of super trend
= supertrend(factor1, atrPeriod1)
// These are used to make additional checks on entry conditions. Depends on input toggle `filterRsi1`
wma1 = wma ( rsi (close, rsi1input), wma1input)
rsi1 = rsi (close, rsi1input)
// if direction1 is false, then trend is positive and vice versa
direction1 = dir == -1 ? false : true
isSuperTrendNegative() =>
dir == -1 ? false : true
getLongCondition(offset) =>
close >= superTrendLine1 and
low <= (superTrendLine1 + modifiedAtr) and
high >= high and
(filterRsi1 ? (rsi1 > wma1) : true) and
holdingLong1 == false
getShortCondition(offset) =>
close <= superTrendLine1 and
high >= (superTrendLine1 - modifiedAtr) and
low <= low and
(filterRsi1 ? (rsi1 < wma1) : true) and
holdingShort1 == false
// Super Trend Bullish candle (STBullCandle) is a candle where low is lower than supertrend and close is greater than super trend.
// Conditions for going Long -
// 1. High of current candle should be higher than high of STBullCandle.
// 2. We can consider 2 candles after the STBullCandle for this condition.
// 3. If filterRsi1 is enabled, then we make an additional check of RSI being greater than the weighted moving average .
// 4. Should not be holding an existing long position
// 5. Supertrend should be positive
consolidatedLongPosition = getLongCondition(1)
longCondition1 = getLongCondition(1)
longCondition2 = getLongCondition(2)
consolidatedLongPosition := getLongCondition(1) or ( enterCriteriaOffset == 2 ? getLongCondition(2) : false)
// Super Trend Bearish candle (STBearCandle) is a candle where high is higher than supertrend and close is lower than super trend.
// Conditions for going Short -
// 1. Low of current candle should be lower than low of STBullCandle.
// 2. We can consider 2 candles after the STBearCandle for this condition.
// 3. If filterRsi1 is enabled, then we make an additional check of RSI being lower than the weighted moving average .
// 4. Should not be holding an existing short position
// 5. Supertrend should be negative.
consolidatedShortPosition = getShortCondition(1)
shortCondition1 = getShortCondition(1)
shortCondition2 = getShortCondition(2)
consolidatedShortPosition := getShortCondition(1) or ( enterCriteriaOffset == 2 ? getShortCondition(2) : false)
bearishCandleHigh1 = array.new_float(1)
bullishCandleLow1 = array.new_float(1)
// GO LONG !
if consolidatedLongPosition and not isSuperTrendNegative()
tradeNumber1 := tradeNumber1 + 1
label.new(bar_index, low, text = tostring(tradeNumber1) + " " +tostring(atrPeriod1) + "." + tostring(factor1) + " Buy above " + tostring(longCondition2 ? high : high ), style = label.style_labelup, color = color.green, yloc = yloc.belowbar, textcolor = color.white)
array.set(bullishCandleLow1, 0, low)
holdingLong1 := true
exitHoldingLong1 := false
strategy.entry(id="Long", long=true, qty = lotSize)
priceFromSL := close - superTrendLine1
targetPrice := close + (priceFromSL * rewardToRiskRatio)
// GO SHORT !
if shortCondition1 and isSuperTrendNegative()
tradeNumber1 := tradeNumber1 + 1
label.new(bar_index, high, text = tostring(tradeNumber1) + " " +tostring(atrPeriod1) + "." + tostring(factor1) + " Sell below " + tostring(shortCondition2 ? low : low), style = label.style_labeldown, color = color.red, yloc = yloc.abovebar, textcolor = color.white)
array.set(bearishCandleHigh1, 0, high)
holdingShort1 := true
exitHoldingShort1 := false
strategy.entry(id="Short", long=false, qty = lotSize)
priceFromSL := superTrendLine1 - close
targetPrice := close - (priceFromSL * rewardToRiskRatio)
// If holding long, EXIT LONG Position Criteria -
// 1. SL would be if close is lesser than the ST candle low
// 2. Direction of ST becomes Negative
if (holdingLong1 == true and exitHoldingLong1 == false and direction1 == true) or (holdingLong1 == true and close >= targetPrice )
if (close < array.get(bullishCandleLow1, 0)) or (close < (superTrendLine1 - modifiedAtr)) or (holdingLong1 == true and close >= targetPrice )
label.new(bar_index, close, text = tostring(tradeNumber1) + " " +tostring(atrPeriod1) + "." + tostring(factor1) + " Exit long @ " + tostring(close), style = label.style_labeldown, color = color.blue, yloc = yloc.abovebar, textcolor = color.white)
holdingLong1 := false
exitHoldingLong1 := true
strategy.close(id="Long")
// If holding short, EXIT SHORT Position Criteria -
// 1. SL would be if close is higher than the ST candle high
// 2. Direction of ST becomes +ve
if (holdingShort1 == true and exitHoldingShort1 == false and direction1 == false) or (holdingShort1 == true and close <= targetPrice )
if close > array.get(bearishCandleHigh1, 0) or (close > (superTrendLine1 + modifiedAtr)) or (holdingShort1 == true and close <= targetPrice )
label.new(bar_index, high, text = tostring(tradeNumber1) + " " +tostring(atrPeriod1) + "." + tostring(factor1) + " Exit short @ " + tostring(close), style = label.style_labelup, color = color.purple, yloc = yloc.belowbar, textcolor = color.white)
holdingShort1 := false
exitHoldingShort1 := true
strategy.close(id="Short")
superTrendColor = isSuperTrendNegative() ? color.red : color.green
plot(superTrendLine1, color = superTrendColor, title = "SuperTrend")
plot(superTrendLine1 + (considerAtr ? (1 * modifiedAtr) : 0), color = considerAtr ? #FFFFFF4F : #00000000 , title = "SuperTrend Buffer Line")
plot(superTrendLine1 + (considerAtr ? (-1 * modifiedAtr) : 0), color = considerAtr ? #FFFFFF4F : #00000000 , title = "SuperTrend Buffer Line")

Ambuja Cements ...... buy ???In a prober down trend
strategy : Sell on Rise.
Channels defined.
Levels Plotted.
Like... Share ... Follow...

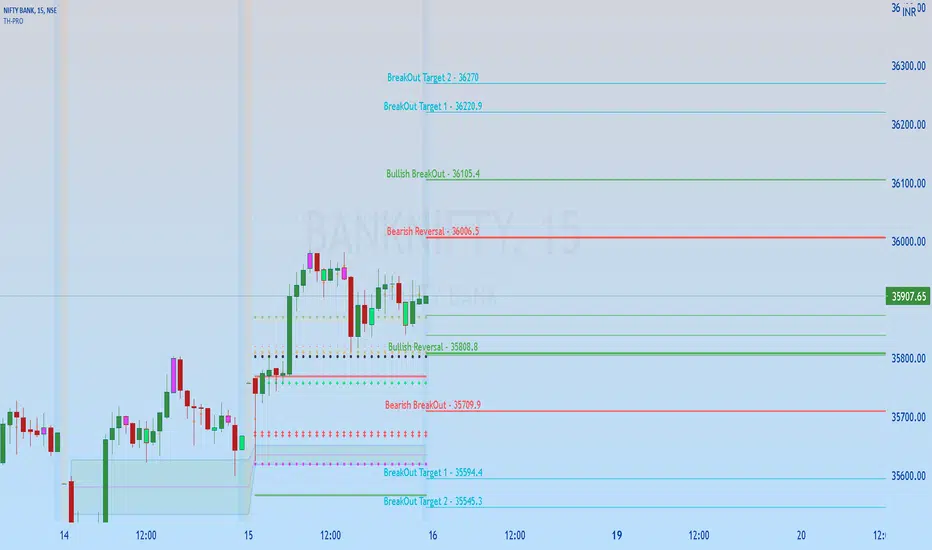
Bank Nifty Trade setup for 16 July 2021Bank Nifty likely to open flattish to small gap up opening .
First Key resistance is 36006 levels if that sustains on opening then we can expect to go long and sit for 36105 & it that is taken out we can expect higher levels as plotted.
If 35808 is compromised then we can expect lower supports to be tested.
BANK NIFTY GONNA BOOM SOON [STRATEGY FOR 2 JULY 2021]Hi Friends,
I hope you all are enhancing your knowledge about charts and simple price action and making profits.
Friends, I have ploted two trend lines and this is clearly visible that price is moving in this channel . Now what we should do today ,
Today we will find buying opportunities.
You can buy CE when price break trend line and 34920 level. It will give you a level of 34100 or 34200 it depends.
Second opportunity of buying is - if price comes to the strong support zone and taking its support and show you the upword momentom. Here you can also buy CE it will give you a level of 34750.
If someone looking for selling opportunity - he shoud consider NIFTY 50 chart as well , there NIFTY 50 is making double bottom at 15700. If NIFTY 50 breaks that level then it is a sell opportunity in BANK NIFTY. And you can buy PE at the privious day low level . You should find privious day low on your own.
I suggest to avoide sell for today.
Advice for you if you are in market or thinking to come in the market.
: You should prepare your own strategy soon, you have to know what things are working for you!
: Allow only two stoplosses a day if two stoploss hits then close your laptop and don't come again, because day is not yours.
: Hold the wining trade by trailing stoploss and cut the loosing trade as soon as possible.
: If stoploss hits then don't feel bad its a part. Sometime you win some time market.
: Some time not to take trade is also proffitable.
: If price action is not going according to you then you shoud leave the trade for that day.
: Never follow any one to take trade, neither me nor any one on this planet, because what i or they share is my or their point of view, hopefully it is good for me and them. You shoud find what is good for you.
:You can just take help like how others are thinking , what is their psychology, but trade only and only on your risk.
You guys give me your valuable time thank you very much.
JITENDRA KUMAR


Nifty Levels 24 June Expiry Short StrangleRed Lines are potential levels for weekly expiry.
Green Lines are potential levels for Monthly expiry.
Both levels are calculated plotted on the day of expiry for the next expiry.
Here green lines were calculated and plotted on 27-05-2021. And short strangle positions taken for 24-06-2021 Expiry at market close on 27-05-2021
NIFTY 24JUN2021 15900CE Sold at 74.8
NIFTY 24JUN2021 14800PE Sold at 102.55
The rightmost pair of red lines were calculated and plotted on 17-06-2021. Short strangle positions taken for 24-06-2021 Expiry at market close on 17-06-2021.
NIFTY 24JUN2021 15950CE Sold at 26.55
NIFTY 24JUN2021 15450PE Sold at 49.25
Firefighting and adjustments to be done accordingly when any of the levels are breached

HDFC respected the trend line 1) short term trend line breakdown
2) it is sideways in medium term
3) short term trend is negative
Respected the trend line we ploted even when the nifty is making all time high shows that it is not participating in the overall market rally

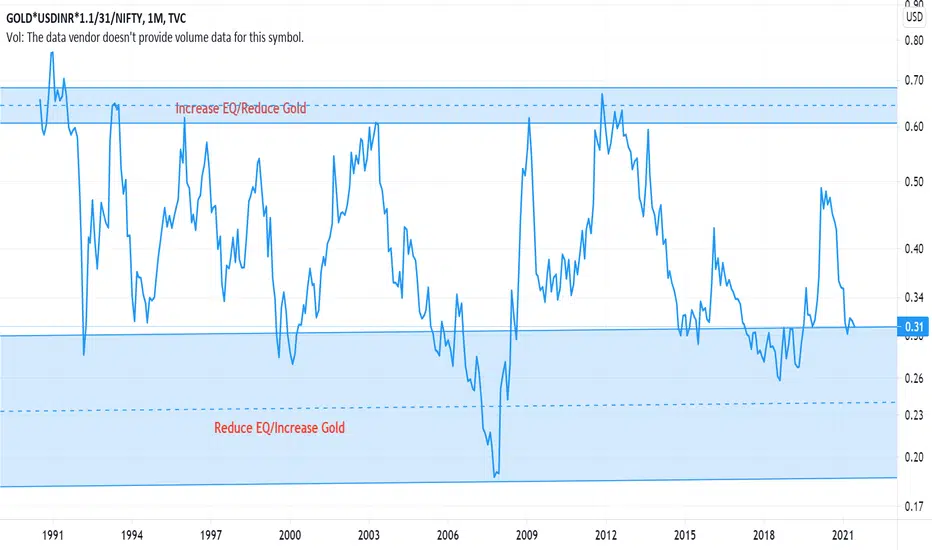
When to increase/decrease allocation to Gold <-> NiftyBased on the idea shared by Mr. Alok Jain of weekendinvesting
Hence, the credit belongs to Mr. Alok entirely. However, I've made minor changes in the ranges.
Please do shout out if you find out any errors in the plot.
P.S. - can't post the youtube video links as per TV house rules.

RSI MTF by RDSUTHAR//@version=4
study(title="RSI MTF by RDSUTHAR", shorttitle="RSI MTF by RDSUTHAR", overlay=false)
source = close
lengthRsi1 = input(14, minval=14)
lengthRsi2 = input(14, minval=14)
OverSold = input(45)
OverBought = input(55)
Res1 = input(title='Resolution 1', type=input.resolution, defval="240")
Res2 = input(title='Resolution 2', type=input.resolution, defval="180")
Res3 = input(title='Resolution 3', type=input.resolution, defval="120")
Res4 = input(title='Resolution 4', type=input.resolution, defval="60")
rsi1 = security(syminfo.tickerid, Res1, rsi(source, lengthRsi1))
rsi2 = security(syminfo.tickerid, Res2, rsi(source, lengthRsi2))
rsi3 = security(syminfo.tickerid, Res3, rsi(source, lengthRsi3))
rsi4 = security(syminfo.tickerid, Res4, rsi(source, lengthRsi4))
plot(rsi1, title="Rsi 1", color=color.aqua, linewidth=1)
plot(rsi2, title="Rsi 2", color=color.purple, linewidth=1)
plot(rsi3, title="Rsi 3", color=color.red, linewidth=1)
plot(rsi4, title="Rsi 4", color=color.black, linewidth=1)
hline(OverSold,color=color.red)
hline(OverBought,color=color.red)

Vishwa//@version=2
study(title = "Amarstock MMI", shorttitle="Amarstock MMI", overlay=true)
len=input(10)
o=ema(open,len)
c=ema(close,len)
h=ema(high,len)
l=ema(low,len)
haclose = (o+h+l+c)/4
haopen = na(haopen ) ? (o + c)/2 : (haopen + haclose ) / 2
hahigh = max (h, max(haopen,haclose))
halow = min (l, min(haopen,haclose))
len2=input(10)
o2=ema(haopen, len2)
c2=ema(haclose, len2)
h2=ema(hahigh, len2)
l2=ema(halow, len2)
col=o2>c2 ? red : lime
plotcandle(o2, h2, l2, c2, title="Amarstock MMI", color=col)

NIFTY & BANKNIFTY TRADE PLAN for Monday - 5th AprilHello All,
Please watch this video completely where I have clearly mentioned the possible Entry and exit levels for both NIFTY and BANK NIFTY for Monday as well as for the following days till next week expiry.
Further to get these accurate levels, you can subscribe o my Indicator and follow the levels it plots. For live guidance you can join my daily live session during market hours on my channel PIVOT EDGE.
If you like my analysis and also the Indicators that I have published, you can press like button and follow me on Trading view.
Happy trading.
Mohan

BANKNIFTY INTRA-DAY levelsbanknifty intra-day target ploted on chart stop loss and target in 5 mint time frame

State Bank Of India - SBINNo doubt its a result day so anything could happen, but early signs are bearish. I will wish it to give a closing above 340 level for further momentum. If results are not celebrated by markets then the history consequences is already plotted.
Chart By- ADARSH DEY


[Turtle] SunPharma StraddleSold 600PE at 24.5
Sold 600CE at 28.2
Net IC is 50. It looks fantastic range for this month. (Reason for thinking is already plotted.)

EMA10
EMA10 //@version=3
study("Ema 10mins",overlay=true)
emaToPlot = input(title="EMA Periods", defval=13)
emaChosen = ema(close, emaToPlot)
plot = security(tickerid, '10', emaChosen)
plot(plot,linewidth=2,color=yellow)
