levels of the nifty with further studies and projectionsthis chart by way of rectangles and boxes is quite self-explanatory and while one can always look to track what and more importantly when these actions happen I dare say shall be quite evident from the plots.
the only point though that needs to be kept in mind is that the volatility index or the vix needs to be tracked as we track the prices of stocks and the index.
levels of mention right now are 10964 on the upside as the first reference post which 11011 is the wall of worry that nifty needs to climb on which I have my educated doubts. Still quite a few sessions to go before we can say that the top of the nifty at 11700 is going to remain till some time in 2021 unless crazy and momentum is redefined by way of policy and global cheer with the distribution post recognition of the vaccine for the coronavirus.
downsides which logically is the path of least resistance now shall look forward to levels of 10666-636 and 10555-551 levels break of this which would open up 10232 -10333
time of log 20:40hrs
date 24/9/2020
Search in ideas for "PLOT"


BITCOIN next bull run $5,70,000/- #BITCOIN $BITCOINHi guys,
In this chart i plot FIB & on value of 0,1,55 & checking previous history & do same on current market situation, so when we plot on 1st bull market 1st run-up till bear market bottom we get on 55 level of FIB price of $300/- around,so when we plot on 2nd bull market 1st run-up till bear market bottom we get on 55 level of FIB price of $18,000/- around,Now if this senarios still repeat & market cap of #BITCOIN goes in $trillion market cap, then according to this when we plot on 1st run-up till bear market bottom we get on 55 level of FIB price of $5,70,000/- around, many people think this is crazy & also see that market cycles are got shorter with time, but #BITCOIN never achived in past a market cap of $8-10 trillion so this is possible... & also if you see marekt volumen it goes down since many year means a major move is remain...
BUT i will update new charts with time & more data to get more acuurate value in future.....
#BITCOIN , #BULLMARKET , #CRYPTO, #CRYPTOCURRENCY

APOLLO HOSPITALS BULLISHLooks good to go with Apollo Hospital aiming for 1500-1600 lvls since its moving above 200 SMA lvls succesfully after backtesting on multiple times as plotted.
Mentor/Guru: SP Selva
Disclaimer:
I am not a SEBI Registered Analyst. Its just a test trade. So, suggest not to blindly follow my charts. If followed, one should always be able to manage risk.
The idea of the above is purely my Guru Mr. Selva who has given his efforts and time for me and immense support to analyze this.

UPDATE ON ELLIOT FORECAST FOR 6 JUL 20PLEASE REFER MY PREVIOUS POST ON THE CHART ON NIFTY FORECAST FOR 6 JUL 2020
MADE SOME AMENDMENTS ON ELLIOT LABELING AND INCLUDED HTF ELLIOT PLOT.
VIEWS MOST WELCOME

BANK OF MAHARASHTRANicely setting up hopefully on the upside.
Heavy Consolidation around the resistance augers well for a big breakout.
Targets as plotted.
Enter on dips within the triangle
SL - 10.4

NIfty Long term viewAs shown in figure , nifty lies here in wave 'B' which is corrective phase of wave ' A', so it must be around 60~70% max.
the structure of wave B looks like an ending diagonal.
once its been over we can see a continuation of wave 'C', As any impulse can not be stand alone,so there is high probability of wave C.Here high chances that price spent some time, over there around end of wave B,price may also shoot out (to pretend like breakout) , here because it will be penultimate wave.
Above Set up will fail if price crosses and stay above the supply zone plotted.
maintain strict stop loss over there.

SOON DOW WILL COMPLETE ITS JIURNEY TO UPWARDS THEN SEE FALL!! LET US COMPARE MY LAST WEEK STATEMENTS FOR DOW WITH THIS WEEK MOVEMENT.
1. I HAVE ATTACHED LINK OF MY PREVOIUS POST , SENT ON 5TH OF MAY 2020. YOU CAN SEE I SHARED A UPWARDS JOURNEY OF DOW IN THIS WEEK. SAME HAPPENED . IN PREVOUS POST I TALKED ABOUT A RED CHANNEL LOWER BAND WHICH WAS FORMED LAST WEEK. AND FROM THERE YOU SEE UP MOVE. I MADE THE CONCEPT CLEARED OF FORMATION OF CHANNELS. THOSE WHO DID NOT READ CAN SE IN ATTACHMENT.
2. I SHARED THE FINAL JOURNEY OF THIS DIRECTION WHERE IT WILL COMPLETE. " D" PHASE OF DISTRIBUTION, ALONG WITH MANY WAVES GOING WITH THIS STRUCTURE.
3. A GREEN BOX IS MADE NEAR GREEN DOTTED LINE. WHERE THIS MOVE IS EXPECTED TO FNISH. A WHITE COLOR SOLID ZONE HAS ALREADY BEEN PLOTED IN LAST WEEK . I WAS SURE LAST WEEK BUT DID NOT TALK ABOUT THAT WHITE SOLID ZONE. SOTHAT LET THE MOVE REACH NEAR TO THAT LEVEL. ALTHOUGH I MARKED IN CHART.
4. YOU KNOW PRICE MOVEMENT ON CHARTS TELL EACH AND EVERY QUERY OF ANY PERSON. TRADERS MISSED IN THEIR ANALYSIS AS ARE NOT SO PERECT TO READ THIS UNIQUE LANGAUGE. SINCE MY FIRST POST I DID NOT MISS IN ANY CHART . BECAUSE I LOVE, ADORE THIS FANTASTIC LANGAUGE OF MARKET. IFANY DAY I MISS THAT WOULD BE MY FAULT TO SYNC ALL IMFORMATIONS PROPERLY. YOU BRING ANY SCRIP OF THIS WORLD MARKET ALL CAN BE READ PERFECTLY. BUT NEEDS LOT OF PERECTION. TO SYNC DIFFRENT IMFORMATIONS IN RHYTHM IS AN ART . AND ART CAN NOT BE LEARNT IT IS ADOPTED TO THE LEVEL OF MASTERING. I TALK ABOUT THE PSYCHOLOGY OF MARKET IN MY TWITTER ACCOUNT, SOTHAT ALL STRUGGLING TRADERS CAN BE BENIFITED.
5. I WANT EVERY TRADER TO PUT INTENSE HARD WORK TO ACHEIVE THIS PRECIOUS LANGUAGE. HOPE GOD WILL HELP ME TO IMPART THIS TO GENIUNE SEEKRS. REST MARKET WILL DECIDE.
YOGESH VATS

BANK NIFTY DEMAND AND SUPPORT ZONEHI ALL EXPERTS PLEASE ADVICE ME THIS IS CORRECT SUPPLY AND DEMAND ZONE I PLOTED CORRECT OR NOT CORRECT PLEASE COMMENT ME


MARICOHarmonic Pattern ABCD with Fibo levels and SR levels plotted.
Already has reacted at the PRZ.
If possible more short coming


CESCBreakout given on trendline with volume
Fibo levels plotted...
If breaks cmp level (which is also Fibo level) upside can be seen.

Banknifty, Catch a clear direction if you can...!TimeCycle: Phases plotted.
Currently, BankNifty trading made an excess.
SHORT or LONG , What is Risk and Reward ration, Protective stop , Quantities, etc. these all are your question and also the same for me.
Hit LIKE button and get real-time UPD ATE .

Escorts LongEscorts daily chart, there is important support of 540 so if it hold then a bullish rally will start and aslo pericing pattern ploted on chart that is berish reversal so
buy with the SL 541 target of 620

Updates for USDINRHi Guys,
Rupee looks strong on the weekly chart, but it seems like it might consolidate in 68.5-70 Range for 1-2 months then it might go for the big move.
It will depend on the price action in the areas I have plotted. Most probably it might go down(Because RSI Seems week for USD) because of the structure but still can't say exactly.
This is not financial advice, just my thoughts.
Thanks.

If You are Some Wave theory Trader, it should open your eyes No Theory Works perfectly but you have to add the probability , You must have an view and forecasting ability before the market could move , You must have practice to identify repeatable patterns , You can make money only by identifying the patterns and the behavior of patterns
When i see so many starts plotting wave theory or some sort of theory , I know exactly what they are missing , its fact but no one will believe , Market do not work with any kind of theory it works on its own pace , You must try and practice to understand its direction and trade in the direction of the trend
Consider this pattern i have viewed it as possible Expanding ending diagonal based on HTF , and i have put information on how i looked this and viewed it for entry and exit purpose , few things to know before you think you hit the Jackpot
01) Does your identified pattern is working based on smaller time frame ? if yes then stay with it , if no , then re-caliber it and change the view
02) When price action confirms the Move based on your views after weekly close , Look for pull back & reversal for adding more trade in the direction of the trend , Just dont jump on trade with all chips on it , there is always a pull back , and there will be always an opportunity , dont jump for bottom fishing or top selling unless you are very perfect and proven with your strategies
03) Suppose the structure starts to change it formation after due course Not a big deal , put the stop to cost + Brokerage , and ignore it , if you are wrong market will take you out , try another view to identify what could be possible
04) Most often they repeat the price action also , the repeating of price action is so accurate literally you can pull the previous price action once you master identifying it using bar pattern tool form this trading view ,i have made small efforts plotting very thin color bar pattern , and its already confirming the price is behaving as per previous price action
Good luck

Sanghi IndustriesDemand Zones plotted.
Disclaimer: I am a novice in the markets, so please don't construe your trade basis this chart. I post it to see if my views holds true.

JINDALSTEEL looks goodIf 260 is broken to the upside then can go to new highs. Immediate stop and target plotted.

Cursor had shifted due to erroneous plotting. Sorry about that.May go down to 72 in short term if it does not recoup and goes back above 82.25


Can Ideal AB = CD & Bullish HARAMI CROSS Combo Lift PVR ? Perfect AB II CD & AC II BD. also in length AB = CD (Approx)
Pattern description with drawing on the chart.
Due to -VE behavior of market, pattern may be extended to other forwarding pattern.
Scnario #1 (bear side): Ext D = 1281.9 (plotted on Chart)
Scnario #2 (bear side):Ext D = 1241.8 (plotted on Chart)
Though my view in favor of LONG.
WHY ? Look Candle Pattern :
BULLISH HARAMI CROSS (Reversal pattern):
Definition
This is a Major BULLISH REVERSAL pattern , which is even more significant than a regular Bullish Harami . (Mentioned in ICICIPRULI CHART) The outline again looks like a pregnant woman, as with the Bullish Harami Pattern. However, now the baby is a DOJI . Basically, the pattern is characterized by a black body followed by a DOJI that is completely inside the range of the prior black body.
* " DOJI " : Also known to us as "PIN"
Recognition Criteria:
1. The market is characterized by a prevailing downtrend .
2. A Blue body is observed on the first day.
3. The "DOJI" or "Bullish PIN" that is formed on the second day is completely engulfed by the body of the first day.
Pattern Requirements and Flexibility:
The Bullish Harami Cross consists of two candlesticks, in which the body of the first blue candlestick engulfs the body of the following DOJI. The body of the first candlestick may be short.
Trader’s Behavior:
A bearish mood prevails in the market, and a downtrend is in progress. The first day’s candlestick is a blue body, which further supports bearishness. However the next day, prices open higher than the close, or at the close of the preceding day. The short traders are alarmed which leads to the covering of many short positions, causing the price to rise further. Moreover, the day closes at the opening price, showing lack of decision among traders. The increasing level of indecision and uncertainty amplifies the likelihood of a trend change and cause a Reversal .
Buy/Stop Loss Levels:
In the Bullish Harami Cross pattern the first candlestick can be short. This causes the confirmation level to change with respect to the body length of the first candlestick:
1. If the first blue body is short, then the confirmation level will be defined as the body top of the first candlestick.
2. If the first blue body is not short, then the confirmation level will the last close or the midpoint of the blue body of the first candlestick, whichever is higher.
Prices should cross above these levels for confirmation.
The stop loss level is defined as the lower of the last two lows. Following the BUY, if prices go down instead of going up, and close or make two consecutive daily lows below the stop loss level, while no bearish pattern is detected, then the stop loss is triggered.
ALL Short / Medium Term LEVELS PLOTTED ON CHART.
Intraday Chart as Snapshot will be Updated later, watch time-line regularly for new updates.
If enriched your knowledge,
Click on LIKE , to motivate me
Comment appreciated.
Disclaimer: Only For STUDY. For Taking Trade Decision Consult Financial Advisor.

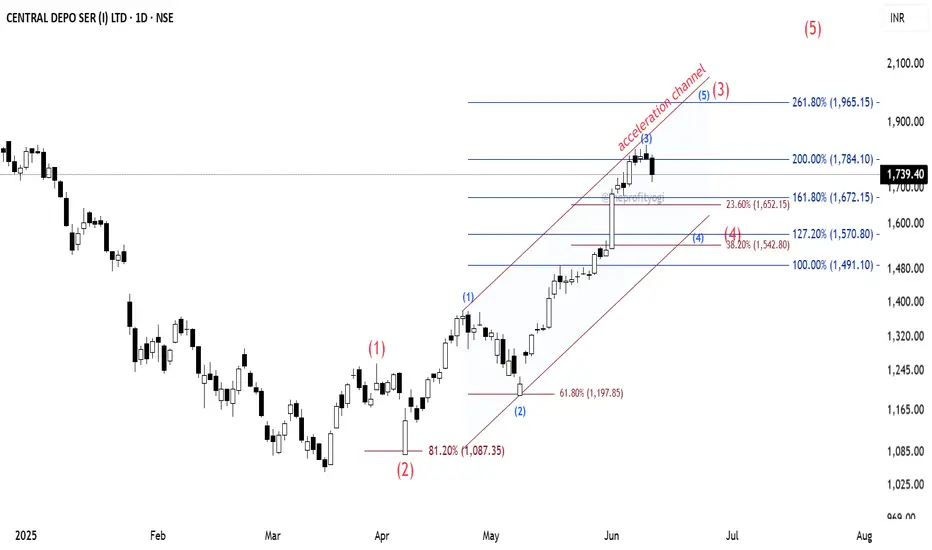
CDSL: Elliott Wave AnalysisThe CDSL daily chart indicates that the stock is in an impulse.
See the counting using Elliott Wave theory where the major wave (2) (shown in red) bounced from the 81.2% level to enter into wave (3).
The subordinate of wave (3) are shown in blue colour, where we can see the subordinate wave (2) of major wave (3) bounced from 61.8%.
To get the possible projection of the subordinate wave (3), I have applied Fibonacci extension to it, and we can see the price is at 200% extension currently. If the recent high is not broken up, we can presume that this is the top of wave (3).
Now, wave (4) will form. And for predicting wave (4) target that I have plotted the Acceleration Channel. This channel can be plotted by joining the line from the top of wave (1) to the top of wave (3) and then its parallel line from the bottom of wave (2).
This channel gives us a hint about where wave (4) may terminate.
Also, I have applied Fibonacci retracement from the bottom of wave (1) to the top of wave (3), and as we know that wave (4) may terminate between 23.6% and 38.2% levels.
So we can get some idea about where wave (4) may complete.
We can see there are clusters of Fib extension and retracement levels near these zones. So we may have a safe buying zone between those.
Important: Here, I have assumed that the subordinate wave (3) is completed.
If the price crosses above the recent top, then we have to replot and recount this study.
This analysis is based on Elliott Wave theory and Fibonacci.
This analysis is for educational purposes only.
This is not any buying recommendations.