Natco Pharma, the road ahead?Its been a journey of parallel channels for Natco Pharma share price and one believes that it will continue to tread within the broad confines of the longer term monthly channel
Price has now found the resistance area of the channel which started from the lows of the covid (in blue). However, with the earnings on lenalidomide still some 15-18 months away from reaching peak levels, atleast in volume terms, by that time the street should hear expected positive news on some of the points listed below:
- new successful para IV filings and launches from existing tentative or final approved list,
- fixing the usfda cloud over kothur formulations plant,
- traction on the much anticipated brownfield acquisition,
- their CAR T investment growing into something tangible in value terms,
- substantial increase in foreign subsidiary business
- domestic formulation sales getting boost due to possible semalglutide launch
- scaling up of crop health science business
therefore looking at the hanging man on WCB I believe that whether for profit booking or geo political or general broader market sentiment it can correct in the immediate shorter term, however, the bullish thesis remains for the fundamental reasons enumerated above.. The first target from here seems to be around 2500 which can be plotted either by box breakout (from 2017 highs) or a rounding bottom (from 2021 highs) or simply the width of the blue parallel channel if and when it breaks out...
The principle of polarity suggests that price may not close below the line plotted by taking the highs of 2017 and 2021 (the pink dotted line) this area should be our longer term stop loss and a time to revisit the bullish thesis.
Search in ideas for "PLOT"

Reliance Power - VCP pattern in formation buy at Breakout - 33 Reliance Power is forming Potential Volume Contraction Pattern (VCP) a pattern made popular by Mr. Mark Minervini.
Please refer pattern and the points plotted on the chart. Do Watch out this stock for VCP formation
The chart has been plotted with the supporting information to indicate how it is forming VCP pattern.
VCP pattern ideally should be traded on breakout i.e above 33, however considering it has forming a base, Aggressive investors can enter at 29, with strict stop loss of 27.10
About VCP pattern --
Imagine a stock's price going up and down like a rollercoaster. A VCP is when this rollercoaster starts to calm down, with smaller and smaller ups and downs. This creates a kind of "base" where the price hangs out for a while.
What's happening?
Calm before the storm: The stock is taking a breather after a big move.
Smart money is buying: While the price is calm, big investors might be secretly buying up shares.
The breakout: If the stock suddenly breaks out of this calm period and starts to go up strongly, it's a signal that the big investors are now selling their shares, pushing the price higher.
So, what do you do?
Wait for the breakout: Don't jump in too early.
Buy after the breakout: Once the price breaks out of the base, consider buying if you think the stock will keep going up.
Be careful: Like any investment, there's a risk the price might go down after the breakout.
Disclaimer : Educational Content. Please do your own research !!

Nifty Voltility amid general election result: Week June3 - June7After a sharp selling seen from 23100 YH3 (yearly camarilla 3rd layer resistance), NSE:NIFTY close the week @ 22530 with -426 pts down -1.86%, until it trade above 23100 not expecting new high in the current year.
With general election results to be announced on June 4th,it may be a highly voltile week .
With 4 days left to weekly expiry June 6👇::
Expected volatility Range in 1st week of June 2024 amid generl election result:
The calculation is done done based on daily average returns and deviation from it's mean
1st standard deviation Higher +1.55% 22883
1st standard deviation Lower -1.03% 22300
2nd standard deviation Higher +2.84% 23180
2nd standard deviation Lower -2.31% 22015
3rd standard deviation Higher +4.13% 23481
3rd standard deviation Lower -3.60% 21733
Line plotted are weekly pivots with monthly pivots of June 24,Will be looking for opportunity in live market based on price action forming near the plotted lines.

EURUSD Trend Signal to ShortTrading Parameters:
-1hr chart
-Analysis timeline Daily- 5am to 5am blocks
-Daily High and Low points base on Timeline Block
-Profit and Loss targets are based on 100% of block movement set at 82.5% Profit target and 32.5% Loss target movement.
-To open trades based on personal trade indicators which are: Box trade, Xtrade trade, Trend trade and Expan Trade.
In todays EURUSD Trade.
Based on my own research on my trading strategy. Chart pattern shows a Trend Trade. However the trend seems to have a major reversal in price movement from its strong Bullish Movement.
So open Trade will be Trend trade (reversal).
Trade points:
Open:1.08671
Profit:1.08337 (334/33.4points)
Loss:1.08469 (132/13.2points)
The strategy takes account of the previous days movement for the opening trade which is 405/40.5points. Based on the movement, Profit and loss at 82.5% and 32.5% respectively are as follows Profit: 334/34.4 points / Loss: 132/13.2 points.
For the strategy signals, 2 trend lines are plotted on the chart, with each trend line plotted at the highs and lows of the prior 2 days of the opening trade. Then 2 horizontal lines are placed within the 2 day blocks at the Lowest High point and the Highest Low point.
Based on what pattern the 2 trendlines and 2 horizontal lines portray altogether. will determine the type of trade that will be opened.
Thank you for your time on reading this Idea. This is just a rough explanation on my strategy. I will be sharing more on my trading statistics in the coming Ideas

BANKNIFTY Intraday Trade Setup For 7 May 2024BANKNIFTY Intraday Trade Setup For 7 May 2024
Bullish-Above 49260
Invalid-Below 49150
T- 49735
Bearish-Below 48650
Invalid-Above 48760
T- 48145 47650
BANKNIFTY has closed on a flat note today. In the weekend half bat was plotted near 49200 and it gave a pullback till PRZ via gap up and respected that. It traded between yesterday's range and formed an inside candle. Below 48650 high possibility of a good slide in intraday is high. The plotted trendline will be an alert for us for a bullish trigger on breakout. However 49260 will be plan of action level, confirmation.
Coming to Tuesday's trade setup, if index opens flat and a 15 Min candle closes above 49260 then we will long for the target of 49735.
For selling we need a 15 Min candle close below 48650. T- 48145 and 47650.
In case of a big gap up/down, wait till 10 o'clock and mark the high and low of the trading range (5MIN). Trade on this range breakout.
==========
I am Not SEBI Registered
This is my personal analysis for my personal trading. Kindly consult your financial advisor before taking any actions based on this.

Long Ircon for target 360 It seems like you're asking for a chart analysis for Ircon International Limited (IRCON) with a target price of 360. Unfortunately, as an AI, I don't have real-time access to current market data or the ability to generate charts. However, I can guide you on how to conduct a basic chart analysis using historical price data if you have access to a financial charting platform or software.
Here's a general outline of steps you can follow:
Gather Historical Price Data: Obtain historical price data for IRCON. You can typically find this data on financial websites or through trading platforms. You'll need daily price data for a significant period, preferably several months to a few years.
Plot Price Chart: Plot the historical price data on a price chart. You can use a candlestick chart or a line chart, whichever you prefer. Make sure to adjust the chart's timeframe to your analysis horizon (e.g., months or years).
Identify Trends: Look for any discernible trends in the price movements. Trends can be upward (bullish), downward (bearish), or sideways (neutral). Trends can help you understand the overall direction of the stock's price.
Support and Resistance Levels: Identify significant support and resistance levels on the chart. Support levels are where the price tends to find buying interest, while resistance levels are where selling interest tends to emerge. These levels can help you identify potential entry and exit points.
Technical Indicators: Apply technical indicators like moving averages, MACD (Moving Average Convergence Divergence), RSI (Relative Strength Index), or Stochastics to gain further insights into the stock's price movements and momentum.
Volume Analysis: Analyze trading volume alongside price movements. Volume can confirm the strength of a trend or indicate potential reversals.
Pattern Recognition: Look for chart patterns such as head and shoulders, triangles, flags, or pennants. These patterns can offer insights into potential future price movements.
Risk Management: Always consider risk management strategies such as setting stop-loss orders to limit potential losses in case the trade doesn't go as planned.
Target Price: Based on your analysis of the chart patterns, trends, and indicators, determine a target price of 360 for IRCON. Make sure your target is realistic and aligns with your risk tolerance and investment goals.

NIFTY Intraday Trade Setup For 28 Feb 2024NIFTY Intraday Trade Setup For 28 Feb 2024
Bullish-Above 22230
Invalid-Below 22180
T- 22435 22650
Bearish-Below 22070
Invalid-Above 22120
T- 21860 21658
NIFTY has closed on a slight bullish note with 0.34% gain today. It just traded between yesterday's range, bounced from plotted golden FIB zone (0.5) till yesterday's high. So overall NIFTY has been trading between 22220 and 22070 since last two days. Breakout will give us a fresh move on expiry day. It will be surprise if it trades in the range tomorrow again. 21300 is the hourly swing high, breakout will give move towards 22520 as per plotted ABCD.
Coming to Thursday's trade setup, if index opens flat and a 15 Min candle closes above 22230 then we will long for the target of 22435 and 22650.
For selling we need a 15 Min candle close below 22070. T- 21860 and 21658.
In case of a big gap up/down, wait till 10 o'clock and mark the high and low of the trading range (5MIN). Trade on this range breakout.
==========
I am Not SEBI Registered
This is my personal analysis for my personal trading. Kindly consult your financial advisor before taking any actions based on this.

Natural Gas - Bullish
1. Natural Gas has made double bottom of at low of 2.7560 on 29th and 30th September 2023 at 1.1414 Fibonacci level of my indicator.
2. Created support at 2.7830 for the last three days and trading above it.
3. On the daily chart it is trading above 200 and 100 SMA.
4. Williams R% plotted at the bottom is showing oversold situation.
All these factors combined together, indicate a bullish trend. Best Opportunity to buy and forget.
5. Most important 12-1-23 12:24 AM with price of 2.7891 candle was the pivotal candle, it is trading above it so again a bullish sign.
6. Invest and hold above this candle.
7. In the evening 12-1-23 6:08 PM this candle is pivotal which will hold the future trend.
Disclaimer: I am not a Registered Analyst with any National/International Regulatory Agency. Please consult your financial advisor before making any decision. I will not be responsible for any of your profits/losses. This is only for educational purposes.
Let you grow. May! I follow you.

NIFTY 50, November 07, 2023NIFTY seems bullish?
NSE:NIFTY
NIFTY 50 opened with a gap-up today. The index traded within a narrow range throughout the day, but bulls managed to defend the crucial support levels.
From an options trader's perspective, the increase in open interest on the call side at the 19,250 to 19,400 strikes suggests that bulls are expecting the index to continue its upward momentum in the coming days. However, it is important to note that the put-call ratio is still close to parity, suggesting that bears are also cautious.
Overall, the technical setup for NIFTY 50 is bullish, but it is important to wait for clear confirmation of the trend before taking any positions. The fresh support and resistance levels that I have plotted on the chart can be used as a guide to make trading decisions.
I have plotted fresh support and resistance levels on the chart. Please note that it is important to wait for clear confirmation of the trend before taking any positions.
All the best!
Like and follow if you like my idea

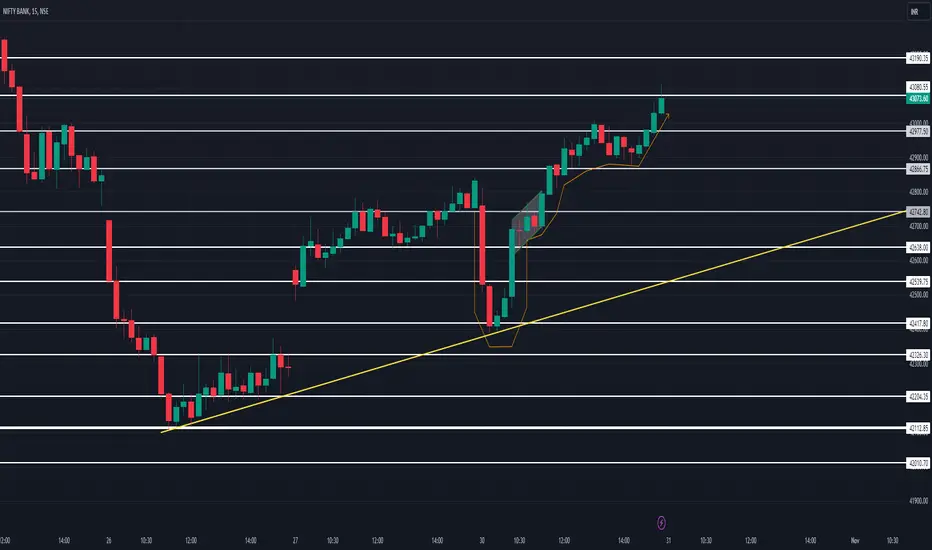
BANKNIFTY, October 31, 2023BankNifty Forms Cup and Handle Pattern: A Bullish Continuation Signal?
NSE:BANKNIFTY
BankNifty opened flat on the last day and then fell sharply, approaching the gap to be filled. However, it sustained support at 42417 and bounced back, with bulls pushing the index back to the continuing uptrend.
Currently, BankNifty is forming a cup and handle pattern, which is a bullish continuation signal. This pattern suggests that the uptrend is likely to continue after a brief consolidation period. The trendline I have plotted crossing the major support levels adds to the bullish outlook.
Global market sentiments are also positive, which further supports the bullish case for BankNifty. I have plotted new support and resistance levels, and I will be monitoring the index closely to see how it performs in the coming days.
Technical analysis is not foolproof, especially in derivative markets, but the cup and handle pattern is a strong bullish signal. I will be keeping a close eye on BankNifty tomorrow, as I believe it has the potential to continue its uptrend.
NB: Please trade at your own risk.
If you like my analysis, please do support and follow me to receive the updates.
BANKNIFTY, October 26, 2023Pre-market analysis for Bank Nifty: Possible surprise breakdown on expiry
Bank Nifty followed the descending trendline and support and resistance levels that were plotted yesterday, as expected. No surprise breakouts occurred.
I have plotted fresh support and resistance lines based on historical patterns. Considering expiry tomorrow, Bank Nifty may start with a small gap up or gap down, followed by consolidation with sideways movement. However, given the current market sentiment and trend, a surprise breakdown is also possible.
This is just an assumption, and you should always keep that in mind. Take positions only when there is a clear trend and movement, especially since it is expiry.
If you like my pre-market analysis, please like and comment.

Bearish LastKissA gold bearish engulfing pattern within specific trading zones can signal potential reversals or downturns in the market. When you spot this pattern, it's like the market is dropping hints for a plot twist. The bearish engulfing candlestick pattern is essentially a two-candlestick pattern where a small bullish candle is followed by a larger bearish candle that engulfs it. It's like the bears are taking over the party.
Now, let's talk about these trading zones. Picture them as battlegrounds where bulls and bears are in a constant tug-of-war. When a bearish engulfing pattern emerges in these zones, it's like the bears are flexing their muscles and gaining control.
Tradivew Publishing would likely describe this scenario as a potential turning point in the gold market. It could be seen as a signal for traders to brace themselves for a bearish trend. They might advise caution or recommend strategies to capitalize on potential downward movements in gold prices.
Remember, though, the market is a complex character, and patterns don't guarantee outcomes. It's like reading the weather—patterns might suggest rain, but you never know if a sudden gust of wind will blow the clouds away.
Always do your due diligence, maybe have a risk management strategy up your sleeve, and keep an eye on other market indicators. The financial world is a story in constant motion, and you're navigating the plot twists

BANKNIFTY INDEX MAGICAL LEVELS FOR 29-09-23
The plotted levels on the chart should be considered only when BANKNIFTY opens flat on 29-09-2023.
If BANKNIFTY opens GAP-UP or GAP-DOWN on 29-09-2023 then the following calculations must be considered:
Level 1 = OPEN PRICE (29-SEP) -78.80
Level 2 = OPEN PRICE (29-SEP) -235.75
Level 3 = OPEN PRICE (29-SEP) - 117.80
Level 4 = OPEN PRICE (29-SEP) + 78.80
Level 5 = OPEN PRICE (29-SEP) + 235.75
Level 6 = OPEN PRICE (29-SEP) + 117.80
Level 7 = (Level 1 + Level 2) / 2
Level 8 = (Level 4 + Level 5) / 2
The yellow, purple, and white coloured lines plotted on the attached chart are strong reversal levels.
DISCLAIMER: This idea is only for educational purpose.

NIFTY 50 INDEX MAGICAL LEVELS FOR 29-09-23
The plotted levels on the chart should be considered only when NIFTY opens flat on 29-09-2023.
If NIFTY opens GAP-UP or GAP-DOWN on 29-09-2023 then the following calculations must be considered:
Level 1 = OPEN PRICE (29-SEP) -26.75
Level 2 = OPEN PRICE (29-SEP) - 80.00
Level 3 = OPEN PRICE (29-SEP) - 40.00
Level 4 = OPEN PRICE (29-SEP) + 26.75
Level 5 = OPEN PRICE (29-SEP) + 80.00
Level 6 = OPEN PRICE (29-SEP) + 40.00
Level 7 = (Level 1 + Level 2) / 2
Level 8 = (Level 4 + Level 5) / 2
The yellow, purple, and white coloured lines plotted on the attached chart are strong reversal levels.
DISCLAIMER: This idea is only for educational purpose.

NIFTY 50 INDEX MAGICAL LEVELS FOR 28-09-23
The above plotted levels on the chart should be considered only when NIFTY opens flat on 28-09-2023.
If NIFTY opens GAP-UP or GAP-DOWN on 28-09-2023 then the following calculations must be considered:
Level 1 = OPEN PRICE (28-SEP) -28.35
Level 2 = OPEN PRICE (28-SEP) - 76.90
Level 3 = OPEN PRICE (28-SEP) - 33.55
Level 4 = OPEN PRICE (28-SEP) + 28.35
Level 5 = OPEN PRICE (28-SEP) + 76.90
Level 6 = OPEN PRICE (28-SEP) + 33.55
Level 7 = (Level 1 + Level 2) / 2
Level 8 = (Level 4 + Level 5) / 2
High Probable Reversal Levels: The yellow, purple, and white lines plotted on the attached chart depicts high probable reversal levels.
DISCLAIMER: This published idea is only for educational purpose.

BANKNIFTY INDEX MAGICAL LEVELS FOR 28-09-23
The above plotted levels on the chart should be considered only when BANKNIFTY opens flat on 28-09-2023.
If BANKNIFTY opens GAP-UP or GAP-DOWN on 28-09-2023 then the following calculations must be considered:
Level 1 = OPEN PRICE (28-SEP) -92.20
Level 2 = OPEN PRICE (28-SEP) - 250.35
Level 3 = OPEN PRICE (28-SEP) - 109.20
Level 4 = OPEN PRICE (28-SEP) + 92.20
Level 5 = OPEN PRICE (28-SEP) + 250.35
Level 6 = OPEN PRICE (28-SEP) + 109.20
Level 7 = (Level 1 + Level 2) / 2
Level 8 = (Level 4 + Level 5) / 2
High Probable Reversal Levels: The yellow, purple, and white lines plotted on the attached chart depicts the high probable reversal levels.
DISCLAIMER: This published idea is only for educational purpose.

BANKNIFTY INDEX MAGICAL LEVELS FOR 27-09-23
The plotted levels on the chart should be considered only when BANKNIFTY opens flat on 27-09-2023.
If BANKNIFTY opens GAP-UP (Open > Previous High) or GAP-DOWN (Open < Previous Low) on 27-09-2023 then the following calculations must be considered:
Level 1 = OPEN PRICE (25-SEP) - 116.25
Level 2 = OPEN PRICE (25-SEP) - 286.40
Level 3 = OPEN PRICE (25-SEP) - 109.80
Level 4 = OPEN PRICE (25-SEP) + 116.25
Level 5 = OPEN PRICE (25-SEP) + 286.40
Level 6 = OPEN PRICE (25-SEP) +109.80
High Probable Reversal Levels: The levels plotted with Yellow, White, and Purple colours.
DISCLAIMER: This idea is only for educational purpose.

NIFTY 50 INDEX MAGICAL LEVELS FOR 27-09-23
The plotted levels on the chart should be considered only when NIFTY opens flat on 27-09-2023.
If NIFTY opens GAP-UP (Open > Previous High) or GAP-DOWN (Open < Previous Low) on 27-09-2023 then the following calculations must be considered:
Level 1 = OPEN PRICE (25-SEP) -32.30
Level 2 = OPEN PRICE (25-SEP) - 79.50
Level 3 = OPEN PRICE (25-SEP) - 30.50
Level 4 = OPEN PRICE (25-SEP) + 32.30
Level 5 = OPEN PRICE (25-SEP) + 79.50
Level 6 = OPEN PRICE (25-SEP) + 30.50
High Probable Reversal Levels: The levels plotted with Yellow, White, and Purple colours.
DISCLAIMER: This idea is only for educational purpose.

BANKNIFTY INDEX MAGICAL LEVELS FOR 26-09-23
The plotted levels on the chart should be considered only when BANKNIFTY opens flat on 26-09-2023.
If BANKNIFTY opens GAP-UP (Open > Previous High) or GAP-DOWN (Open < Previous Low) on 26-09-2023 then the following calculations must be considered:
Level 1 = OPEN PRICE (25-SEP) - 131.20
Level 2 = OPEN PRICE (25-SEP) - 292.20
Level 3 = OPEN PRICE (25-SEP) - 97.25
Level 4 = OPEN PRICE (25-SEP) + 131.20
Level 5 = OPEN PRICE (25-SEP) + 292.20
Level 6 = OPEN PRICE (25-SEP) + 97.25
DISCLAIMER: This idea is only for educational purpose.
NOTE: High probability of reversal may be expected around the levels plotted with yellow lines.

NIFTY 50 INDEX MAGICAL LEVELS FOR 26-09-23
The plotted levels on the chart should be considered only when NIFTY opens flat on 26-09-2023.
If NIFTY opens GAP-UP (Open > Previous High) or GAP-DOWN (Open > Previous Low) on 26-09-2023 then the following calculations must be considered:
Level 1 = OPEN PRICE (25-SEP) - 36.45
Level 2 = OPEN PRICE (25-SEP) - 81.15
Level 3 = OPEN PRICE (25-SEP) - 27
Level 4 = OPEN PRICE (25-SEP) + 36.45
Level 5 = OPEN PRICE (25-SEP) + 81.15
Level 6 = OPEN PRICE (25-SEP) + 27
NOTE: High probability of reversal may be expected around the levels plotted with yellow lines.
DISCLAIMER: This idea is only provided for educational purpose.

HEROMOTOCO , will it move down ?Stock has re-traced sharply after the massive fall and is drifting on the slope, bearish pattern in the making . Break of the orange plot shoudl trigger weakness
Level plot and high leve study on the chart.

HTF - GOLD - HAS LOST ITS SHINE?My analysis today deals with how the further course of our most popular precious metal "GOLD / XAU" could look like.
For this I have carried out a "MULTI-TIME-FRAME" analysis, which refers to the higher time units (month - week - day) and thus makes the big picture visible.
Normally, all time units below "1h" are called noise, but even a - 1h-4h - analysis is of no use to you, if the knowledge about the big and whole is missing.
> We traders know that nobody can predict the future, and that's exactly why you have to be prepared for all initial situations.
> If the DXY should rise again, it means "BLOOD" for the traditional and crypto markets.
> This creates dangers, but also opportunities - it is important to look at the big picture.
> I have explained in detail which levels are RELEVANT in the following pages. .
table of contents
1st part = INTRODUCTION
2nd part = TECHNICAL ANALYSIS
= Monthly - Time frame
= Weekly - Time frame
= Dayly - Time frame
3rd part = CONCLUSION
PART ONE
"INTRODUCTION"
After "XAU/USD" formed a double top between 2020-2022, a strong sell-off has been unleashed thereafter.
> This sell-off paused in October this year to test the strength of it.
> With a subsequent bullish monthly candle, many retail investors now feel on the safe side that new highs will be reached.
> Here I do not want to take away the joy, but the big picture does not suggest anything like that.
> Once you look at the DXY (USD index) on the higher timeframes, the following sell-off in gold is "indirectly" confirmed.
(My DXY analysis is linked below this post, for confirmation purposes.)
GOLD SAFE HARBOUR .
If you follow popular wisdom, GOLD is classified as a safe and reliable haven.
SPEAKING LIKE ...
> "All that glitters is not gold."
> "Talk is silver, silence is gold."
> "Much gold, much future."
That, the precious metal gold got such a high value awarded - HAD - its reasons.
> Inflation protection and security - are definitely the two most associated words with this precious metal.
Unfortunately, at the latest, since the year 2021, this no longer seems to apply.
> If one compares the loss of inflation and the gain in value of gold, a significant gap can be seen, at which there can no longer be any talk of "inflation compensation".
> Gold will therefore no longer live up to its reputation and a rethinking of its value will have to take place in the future.
SECOND PART
TECHNICAL ANALYSIS
For the analysis of the higher time levels, I proceed according to the onion-skin principle.
> MONTH - level > WEEK - level > DAY - level
These are divided into
> SUMMARY > CHARTS
The charts are presented in logarithmic scaling, as the given information can be visually presented in a more harmonious way.
1st MONTH – Time frame
SUMMARY
The trend channel plotted on the chart formed in March|2007 and has since maintained its position as a legitimate trend channel. Its mid-trend line showed reactions when confronted and was respected by the market.
> Price is in the area below the mean line and had last touched the channel in 2018.
> September|2020 the price ran into the mid-line but was not strong enough. This becomes very clear when looking at the moving away middle line despite the "double top".
> The trend arc is another resistance, which should be taken into account for a future downward movement.
If we go into more detail about the "SUPPLY & DEMAND" zones, you can look at two zones in the chart.
> The "SUPPLY" zone is VERY STRONG because it is a RBD (Rally Base Drop).
> The "DEMAND" zone is VERY WEAK, as it is a DBD (Drop-Base-Drop).
> If we get another rise in the DXY, the drawn "DEMAND" zone will break and the sell-off will continue.
The Fibonacci retracements should serve us as additional confirmation, and have been proved in past moves (last decades) .
> Should the price rise even further, FIB (1) will serve as a Strong Resistance Zone, although the "FIB Zone = 0.75-0.88 - is the Strongest Resistance. (1)
> If the sell-off continues, FIB (2) cannot do much in the monthly chart, but if necessary there will be a reaction on the "smaller" time levels.
> The FIB (3) = 1.618 level, will resemble a large magnet and in combination with the FIB (4), will trigger a large resistance reaction in the market.
Past highs and lows usually serve as resistance / support, of which we have three.
> HIGH | 08/20 - Already showed a reaction (double top).
> HIGH | 09/11 - Point of Control
> LOW | 03/21 - Broken and recaptured
Points and levels of interest are in front of us, which have played a strong role for the market since 2011 .
> The most significant resistance, represents the plotted - POI (1800 USD), which is still contested at the time of this analysis.
> The other POIs have non-negligible resistance and support characteristics and should be kept in mind.
CHARTS
XAU - Overall picture
XAU - Trend lines
XAU - Supply & Demand ZONES + Market Structure Break
XAU - Fibonacci
XAU - POI
ATTENTION
In the following time levels, I will only deal with the NEW, added elements. .
2nd WEEK – Time frame
SUMMARY
In addition to the already mentioned trend channel, now three more become visible, which may have escaped the one or the other.
> The "Purple" trend channel formed at the same time as its big brother (monthly channel) and thus represents a major significance for the market.
We are at the middle line of the channel and the market seems to have used it as support.
> The "Turquoise" trend channel accompanies us since the last high and has a big say with its many interactions.
My guess is that its resistance line will decide whether the sell-off will continue or be broken with confirmation.
> The "Earth-colored" trend channel is a small sideways accumulation and accompanies us in this area.
Currently, the price has fought its way back into the channel, confirmed it and is now targeting the top of the sideways channel.
> The "Orange colored" trend line , has been respected since 2018, 07|2022 broken.
The price suggests that the trend line is approaching for a final retest.
The additional "SUPPLY & DEMAND" zones join the two existing ones and remain untouched.
As additional Fibonacci additions, we have:
> The 0.88 FIB (1), combined with the levels from the FIB (2). This represents with the 0.88 levels from FIB (2) - two very relevant resistance ranges.
> FIB (3) is only valid if the price does not rise further and therefore the input values do not change. Should this be the case, the 0.786 + 0.88 area is the most important to watch out for.
CHARTS
XAU - Overall picture
XAU - Overall picture + Month
XAU - Trend Channels + Trend Lines
XAU - Supply & Demand ZONES
XAU - Fibonacci
ATTENTION
In the following time levels, I will only deal with the NEW, added elements. .
3rd DAY – Time frame
SUMMARY
The chart shows a falling triangle which has been broken .
> As a result, the price has confirmed this break, with a close at the break point.
> At this time level, there will be a sell-off, especially if the DXY rises.
To give a little comment on the "Supply & Demand" zones:
> The upper two "SUPPLY" zones are definitely very strong. 1800 + 1980.
> The bottom "DEMAND" zone is very strong, as it is a DBR (Drop-Base-Rally) zone. (ca. 1640 - ca. 1615)
> The "DEMAND" zones in between are incidental, will trigger small reactions on the lower time frames, but nothing significant. (ca. 1760 - ca. 1660)
CHARTS
XAU - Overall picture + Month + Week
XAU - Supply & Demand ZONES + Trend Lines
THIRD PART
CONCLUSION
"The central banks, themselves, are behind the gold price manipulation. What should you get out of it?"
Run this question through your head and let me know in the comments what you think is more likely.
> Another sell-off or a positive gold price for now?
In summary, based on technical analysis, there are a few reasons for a weak GOLD price .
> If you look at the area between 1,950 USD - 1,840 USD, it almost seems like an arm guarding the upper levels.
> To bring down this defense, I think, needs more momentum than what we have and are getting right now. (Christmas, New Year, Chinese New Year)
For this reason, I expect a weak gold rate and a strong USD, and an accompanying bloodbath in the traditional and crypto markets.
> Positioning after confirmation of this thesis = SHORT .
If this idea and explanation has added value to you, I would be very happy to receive an evaluation of the idea.
Thank you and happy trading!

NIFTY WEEKLY AND MONTHLY VIEWHi
This chart is plotted with Gann sq of 144 levels mentioned in degrees ,and GANN BOX plotted from the point of break out level of 18791.45 on 27JUNE 2023 NIFTY.
OBSERVATION.
From the high the level of 18881.2 made on 01DEC2022 a correction happened in the price till
the level of16826.2 made on 21 March 2023 ,this entire correction was in the from of ABC then
an upward journey started on 31 MARCH 2023 FROM the level of 17204.45 which is still intact even till today .
On a weekly chart this break out from 18876.25 on 28 June 2023,this level is the level made on 27JUNE2022 , so according to chart pattern if the low and the level of break out measured come to nearly 1600 points so if target calculated from the break out level of 28 JUNE 2023 ,
TARGET for NIFTY comes around 20548.
IF any minor correction till the full moon low 19234.4 BUY ON DIPS would be the strategy ,IF this level is breached and if the price goes on downside the entire view would be wrong .
so the level of 19234.4 made on 3JULY2023 would be the STOP LOSS .
NOTE: keep following the MOVING AVERAGES EMA 12 and EMA 20.
ENJOY
