FREE Webinar on Pine Scripts for Beginners : Register NOW!Join us for an insightful webinar where you will learn how to build and create your strategies on TradingView using Pine Script.
Pine Script is the programming language of TradingView. It empowers traders to develop and execute their own trading tools on the servers. It also enables the creation of indicators and strategies that can be backtested. Most of TradingView’s built-in indicators are crafted using Pine Script.
Our expert, Syam Mohan aka @t7support a distinguished member of our madefortrade.in community, will guide you through Pine Script. With 17+ years of market experience, Syam offers valuable knowledge and practical insights to help you master strategy building on TradingView.
Date: 30th May 2024, Thursday
Time: 9 PM
Channel: DhanHQ Youtube: www.youtube.com
Register for FREE NOW!
lu.ma
Search in ideas for "Pine Script"

profitable
Certainly! However, it's important to note that writing a profitable trading strategy requires careful consideration, testing, and validation. Pine Script is the scripting language used in TradingView for creating custom indicators and strategies. Here's a simple example of a Moving Average Crossover strategy in Pine Script:
pinescript
Copy code
//@version=5
strategy("Moving Average Crossover", overlay=true)
// Define input parameters
fastLength = input(9, title="Fast MA Length")
slowLength = input(21, title="Slow MA Length")
src = close
// Calculate moving averages
fastMA = sma(src, fastLength)
slowMA = sma(src, slowLength)
// Plot moving averages
plot(fastMA, color=color.blue, title="Fast MA")
plot(slowMA, color=color.red, title="Slow MA")
// Strategy logic
longCondition = crossover(fastMA, slowMA)
shortCondition = crossunder(fastMA, slowMA)
// Execute strategy
strategy.entry("Long", strategy.long, when=longCondition)
strategy.entry("Short", strategy.short, when=shortCondition)
This script defines a simple moving average crossover strategy. When the fast moving average (blue line) crosses above the slow moving average (red line), it triggers a long entry, and when the fast moving average crosses below the slow moving average, it triggers a short entry. This is a basic example, and you should thoroughly backtest and optimize any strategy before considering it for live trading.
Remember, trading involves risk, and no strategy can guarantee profits. Always practice good risk management and consider seeking advice from financial professionals before engaging in live trading.

VDTradingView is a powerful charting platform and social network used by traders and investors worldwide to analyze financial markets and share trading ideas. It provides a comprehensive suite of tools for technical analysis, market research, and strategy development. Here's a detailed description of TradingView:
Key Features of TradingView:
Advanced Charting Tools:
TradingView offers highly customizable and interactive charts that support multiple timeframes and asset classes, including stocks, forex, cryptocurrencies, commodities, and indices.
Users can apply a wide range of technical indicators, drawing tools, and chart types (e.g., candlestick, line, bar, Renko, Heikin Ashi).
Pine Script for Custom Indicators:
TradingView includes a proprietary scripting language called Pine Script, allowing users to create custom indicators, strategies, and alerts.
Pine Script is beginner-friendly yet powerful enough for advanced algorithmic trading.
Real-Time Data and Alerts:
The platform provides real-time market data and price updates for various financial instruments.
Users can set up custom alerts based on price levels, technical indicators, or specific conditions.
Social Networking and Idea Sharing:
TradingView has a vibrant community of traders and investors who share their trading ideas, strategies, and market analyses.
Users can follow other traders, comment on ideas, and engage in discussions.

TradingView Community Awards 2023Our 2023 Community Awards have arrived! It's time to shine a light on the standout traders, the ones who have not only shared consistent ideas on our network, but have also expanded their influence and captivated our trading community with countless boosts, follows, and comments.
Below, you'll find the profiles of our winners. This includes the top achievers who not only made it to our Editors' Picks but also bagged a free Premium plan! And let's not forget our second and third-place stars, who are also getting their well-deserved spotlight. Make sure to check out and follow these remarkable authors! 🌟🏆📈👇
🏆 Most popular ideas:
These are the ideas that created the most engagement from our community in 2023. Check out how they stood the test of time. 🔥📈💡
🥇 Gold
- Don't Dread! Spread the Thread in Polymed! Looks good Ahead!
🥈 Silver
- HUL Analysis! W and Flag and Pole!
🥉 Bronze
- Bank Nifty Positional view
🏆 Most Valuable Pine Scripts
Dive into the most valuable Pine Scripts of 2023 on TradingView. They're game-changers, loaded with innovative features to enhance your trading. Check them out and level up your strategies! 🌲📊🚀
🥇 Gold
- Simple Range
🥈 Silver
- Benchmark, Sector & Stock Performance
🥉 Bronze
- Buy/sell signals with Support/Resistance
🏆 Best Educational Ideas
Packed with wisdom and top-notch strategies, these ideas are gold mines for anyone keen to learn. Dive in and boost your trading know-how!📖💡
🥇 Gold
- Interpretation Of Chart Patterns According To Market Phase
🥈 Silver
- EMA, Envelope & Bollinger bands for Trend Trade with Small SL
🥉 Bronze
- Risk and Opportunity
🏆 The Top Chatters
Our most active chatters of 2023 on TradingView! Think of them as the Chatty Cathys and Talkative Toms of the TradingView social network.🎙️😄
🥇 Gold: www.tradingview.com
🥈 Silver: www.tradingview.com
🥉 Bronze: www.tradingview.com
🏆 Top Live Streamers
These are the superstars turning screens into stages, dishing out live trading drama and wisdom. Tune in to their channels for a front-row seat to the action! 🎥🎤
🥇 Gold: www.tradingview.com
🥈 Silver: www.tradingview.com
🥉 Bronze: www.tradingview.com
🏆 Top Editors’ Picks
Take a look at 2023's stars on TradingView, consistently featured in Editors' Picks! They're the maestros of the market, delivering quality insights and analyses time and again. Follow their work for a steady stream of top-notch trading wisdom. 🔮📈🧙♂️
🥇 Gold: www.tradingview.com
🥈 Silver: www.tradingview.com
🥉 Bronze: www.tradingview.com
And there you have it! Our 2023 community award winners. Now, let’s all have a fantastic 2024 together. Godspeed!
Team TradingView 📈🌲

BEST TRADING STRATEGY ON TRADING VIEW BIND BACK TESTEDThis video is about blind testing the world's best script on TV and see if it still generates the net profit of 4000-15000% of net profit in just 1.5 years . This means 40 to 150 times of initial investment in just 1.5 years. You can ofcourse deduct the fee/commission part of platforms and some more but still, this is too much. What I have done here is developed a pine script which when I applied to any market pair on cryptocurrency market generates staggering profits in just 1.5 years. Today, to make it purely blind I have used a mobile application to generate random numbers first and then with that number I select the market pair and apply my script to see the back testing results. Results are still the same as we saw in my first video about the script. Also, I discussed various ways people can take advantage of the script. People can either buy it and apply it own their own on any number of charts on any market and generate signals/calls for trading automatically or they can chose to go for Copy Trading Service where they don't have to do anything but just subscribe to my Copy Trading Services and grow with me and relax while my script does the job for both of us. For details you can message me or email me.

Now Trade Options on TradingView🚀Hello Community,
At Dhan, we understand that traders like you are constantly seeking ways to streamline their trading process, optimize their strategies, and seize opportunities swiftly. With this in mind, we proudly present the Dhan Webhooks for TradingView feature, designed exclusively for TradingView's super users.
Our team has collaborated closely with TradingView to leverage their Alert feature and craft an unparalleled order execution system on the Dhan platform. This integration empowers you to place orders on Dhan based on your TradingView indicators, strategies, alerts, or Pine scripts, effectively bridging the gap between these two platforms.
New possibilities with webhook feature
Listening to your valuable feedback, we have enhanced and expanded the Dhan Webhooks experience, and today, we're excited to unveil a new range of enhancements:
1. Webhooks as an Order Type: With our new update, Webhooks are now available as an order type on the Dhan platform. This means that you're not confined to scripts available solely on TradingView. Whether it's Equity, Futures, Options, or even Multi-segments, you can execute orders based on any chart, providing you with unprecedented trading flexibility.
2. Options Trading with Dhan Webhooks: We've also introduced the ability to execute Options trades using Dhan Webhooks. Now, you can leverage the power of this integration to optimize your Options trading strategies and capitalize on market movements like never before.
3. Multi-Segment Strategies: Take your trading to the next level by building strategies with multiple legs across segments. Thanks to Dhan Webhooks, you can now place orders via indicators on TradingView charts, creating intricate trading strategies with ease.
We understand that one of the most important goals for traders is the ability to automate their strategies without the need for complex coding. With Dhan Webhooks, this goal becomes a reality. You can seamlessly integrate your existing TradingView strategies with Dhan's order execution capabilities, without altering your chart setup.
Dive into systematic trading with confidence, as your TradingView strategies generate alerts and place trades, all while you monitor the progress. And here's the best part: no coding experience or knowledge is required. Dhan Webhooks empowers you to build sophisticated automated trading strategies effortlessly.
Want to get started? look no further we have made a dedicated video for how you can add webhook on TradingView and Dhan.
Just search for How to use Dhan Webhook for TradingView | Options Trading | Pine Script | Alert Explained | Dhan on youtube and you’re good to go!
Hope you like this feature as much as we loved building it for you.
Happy Trading!

Now Live: Trade Directly on Dhan from TradingView Mobile AppsWe know Traders love Charts and also love one of their (and also our) favorite charting platforms - TradingView. Just a few months back we launched our integration with TradingView which enabled Dhan users to trade directly from TradingView.com.
Our integration with TradingView has been a game-changer for many Super Traders in India, as it has allowed them to execute trades directly from TradingView's platform. As of now, over 40,000+ traders in India have connected their Dhan accounts with TradingView and are seamlessly analyzing their trades as well as executing or trading directly from TradingView.
We understand that many traders are on the move, and as a result also frequent users of TradingView apps. Today, we are thrilled to announce that Dhan is now accessible through TradingView's Android and iOS apps, which means now you can trade directly from TradingView mobile apps!
As the first platform in India to offer this incredible feature, we take immense pride in delivering an outstanding trading experience to our Super Traders. This integration with TradingView offers our users an added level of convenience and flexibility, providing them with a seamless trading experience on one of the most widely used platforms globally.
By connecting to the Trading Panel on TradingView, you can elevate your trading experience and take advantage of some remarkable features like:
- Pine Editor: Get seamless access to Pine Editor and execute your trades directly without any manual intervention
- Get access to all the required Pine Script libraries
- Access to > 1,00,000 Community Scripts
- Bar Replay - Rewind markets and watch with user-defined speed
- Use Multiple Indicators
- Stock Screener
- 1-Second Chart Timeframes
- Add Price Alerts across all your positions seamlessly
- Trade with 12 Charts Types Including Renko, Kagi, and Point & Figure
Note: Access to these features depends on your TradingView subscription.
In case you need a quick refresher on how to connect your Dhan account to TradingView, we have this demo for you below.
We are committed to bringing our customers the best possible trading experience, and we believe that this integration will further enable our users to trade seamlessly.
Happy Trading!
JSW-INFRA : Powering India’s Port Revolution – A Deep Dive into NSE:JSWINFRA
JSW Infrastructure Ltd.
🧾 Company Overview
Role: JSW Infrastructure is India's second-largest commercial port operator (after Adani Ports), and forms a core part of the JSW Group.
Operations: The company manages and operates major ports across both the east and west coastlines of India.
Revenue Streams: Primarily driven by port operations (handling bulk, breakbulk, containerized cargo), as well as integrated logistics services.
📊 FY24 Financial Snapshot
Revenue ₹3,200+Cr
EBITDA Margin 55–60%
Net Profit ₹750+Cr
Debt to Equity ~0.6x
ROCE ~15%
ROE ~13%
Positive aspects:
Asset Turnover Strong
Double-digit revenue CAGR (>20%) over the past three years.
High EBITDA margins consistent with best-in-class infra businesses.
Well-diversified cargo and customer profile, with increasing non-JSW business.
Stable long-term contracts & beneficiary of India’s logistics and trade reforms.
Risks / Weaknesses:
~70% revenue is from group companies, though diversification is underway.
Aggressive capex plans elevate financial risk.
Susceptible to regulatory, tariff, and environmental compliance changes.
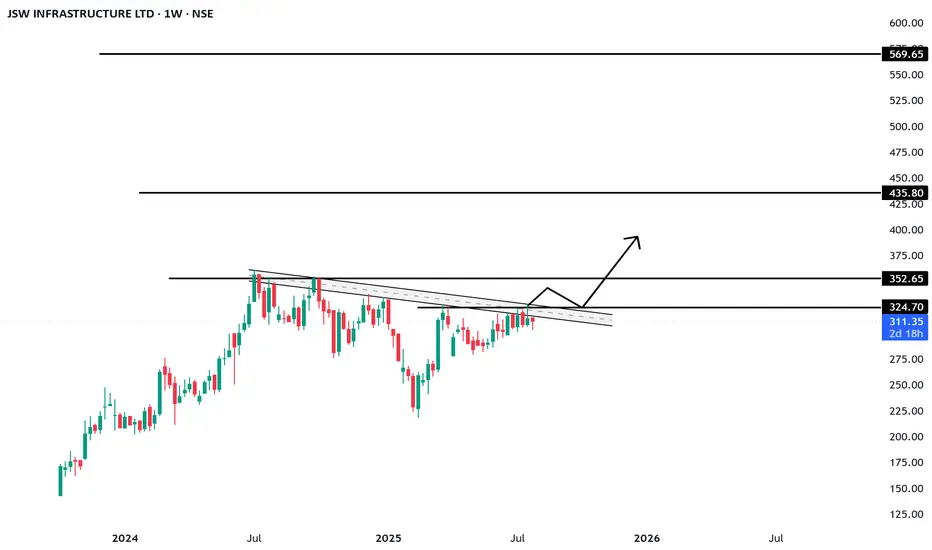
📈 Technical Analysis (July 2025)
• Share Price: Trading in the ₹260–₹280 range. IPO was at ₹119 (Sep 2023); strong price appreciation since listing.
• Trend: Intact uptrend; recently consolidated between ₹240–₹260.
• Support/Resistance: Key support at ₹230–₹235; resistance at ₹285–₹300.
• Moving Averages: Stock remains above both its 50-EMA and 200-EMA — a structurally bullish indicator.
• Momentum:
o RSI: 60–65 (bullish, but approaching overbought)
o MACD: Fresh bullish crossover; volume shows accumulation near breakout.
• Outlook: Breakout above ₹285 could trigger medium-term upside toward ₹320–₹340. Buy-on-dips is favored, with strong accumulation likely in the ₹230–₹240 zone.
🚀 Growth Prospects & Strategic Moves
• Capacity Expansion: Plans to nearly double port capacity by FY30 (from ~160 MTPA to ~300 MTPA).
• Cargo Diversification: Targeting major reduction of group dependency (from ~70% to ~50%) by growing third-party cargo traffic.
• New Projects: Investment pipeline includes both greenfield and brownfield projects in Odisha, Maharashtra, and other states.
• Integrated Logistics: Deeper backward integration into rail connectivity and warehousing to capture higher value from logistics value chain.
• Macro Tailwinds
o Major government initiatives (e.g., Sagarmala) catalyzing sector growth.
o India’s trade/exports rising; strong outlook for cargo and container volumes.
o Shifts in supply chains to coastal shipping and blended logistics.
o Demand uptrend in containerization and warehousing services.
⚠️ Key Risks & Limitations
• High Capex Cycle: Expansion could elevate debt and financial leverage.
• Macro Sensitivity: Lower industrial/output growth would hit cargo volumes.
• Regulatory Overhang: Tariff and ESG regulations present chronic uncertainty.
• Group Concentration: Third-party cargo growth remains an execution challenge.
• Rivalry: Competitive intensity from Adani, DP World, and others is ramping up.
📌 Conclusion & Investment Verdict
Parameter Verdict
Fundamentals Strong, superior margins, efficient operations
Valuation Fair to premium (due to uptrend and growth)
Technical Trend Bullish, ready for potential breakout
Growth Outlook High (supported by sector tailwinds)
Risk Profile Moderate (driven by capex & regulatory factors)
For long-term investors:
JSW Infra presents a compelling case for portfolio inclusion, offering robust growth visibility, sectoral leadership, and operating excellence. Accumulation is best near ₹230–₹240 on dips.
Short-term view:
Stocks in strong uptrends may see minor corrections but are well-placed for fresh breakouts above ₹285, targeting ₹320–₹340.
The stock is ideal for investors seeking infrastructure-sector exposure with high growth potential, but one must remain mindful of execution and regulatory risks.
==============================
==============================
⚠️ Disclaimer:
This analysis is for educational and informational purposes only.
We are not SEBI-registered analysts or advisors.
This is our personal view based on available data and market trends.
Please consult your SEBI-registered investment advisor before making any investment or trading decisions.
You are solely responsible for any financial decisions you make based on this content.
========================
Trade Secrets By Pratik
========================
Update idea
Add note
Trade_Secrets_By_Pratik
Also on:
Disclaimer
The information and publications are not meant to be, and do not constitute, financial, investment, trading, or other types of advice or recommendations supplied or endorsed by TradingView. Read more in the Terms of Use.
English (India)
Select market data provided by ICE Data services.
Select reference data provided by FactSet. Copyright © 2025 FactSet Research Systems Inc.
© 2025 TradingView, Inc.
More than a product
Supercharts
Screeners
Stocks
ETFs
Bonds
Crypto coins
CEX pairs
DEX pairs
Pine
Heatmaps
Stocks
ETFs
Crypto
Calendars
Economic
Earnings
Dividends
More products
Yield Curves
Options
News Flow
Pine Script®
Apps
Mobile
Desktop
Tools & subscriptions
Features
Pricing
Market data
Trading
Overview
Brokers
Special offers
CME Group futures
Eurex futures
US stocks bundle
About company
Who we are
Athletes
Blog
Careers
Media kit
Merch
TradingView store
Tarot cards for traders
The C63 TradeTime
Policies & security
Terms of Use
Disclaimer
Privacy Policy
Cookies Policy
Accessibility Statement
Security tips
Bug Bounty program
Status page
Community
Social network
Wall of Love
Refer a friend
House Rules
Moderators
Ideas
Trading
Education
Editors' picks
Pine Script
Indicators & strategies
Wizards
Freelancers
Business solutions
Widgets
Charting libraries
Lightweight Charts™
Advanced Charts
Trading Platform
Growth opportunities
Advertising
Brokerage integration
Partner program
Education program
Look First
HDFC BANK LTD
NSE•Real-time•Market closed
Edit Idea
Minimize
Close
JSW INFRA : Powering India’s Port Revolution – A Deep Dive into
NSE:JSWINFRA
JSW Infrastructure Ltd.
🧾 Company Overview
Role: JSW Infrastructure is India's second-largest commercial port operator (after Adani Ports), and forms a core part of the JSW Group.
Operations: The company manages and operates major ports across both the east and west coastlines of India.
Revenue Streams: Primarily driven by port operations (handling bulk, breakbulk, containerized cargo), as well as integrated logistics services.
📊 FY24 Financial Snapshot
Revenue ₹3,200+Cr
EBITDA Margin 55–60%
Net Profit ₹750+Cr
Debt to Equity ~0.6x
ROCE ~15%
ROE ~13%
Positive aspects:
Asset Turnover Strong
Double-digit revenue CAGR (>20%) over the past three years.
High EBITDA margins consistent with best-in-class infra businesses.
Well-diversified cargo and customer profile, with increasing non-JSW business.
Stable long-term contracts & beneficiary of India’s logistics and trade reforms.
Risks / Weaknesses:
~70% revenue is from group companies, though diversification is underway.
Aggressive capex plans elevate financial risk.
Susceptible to regulatory, tariff, and environmental compliance changes.
📈 Technical Analysis (July 2025)
• Share Price: Trading in the ₹260–₹280 range. IPO was at ₹119 (Sep 2023); strong price appreciation since listing.
• Trend: Intact uptrend; recently consolidated between ₹240–₹260.
• Support/Resistance: Key support at ₹230–₹235; resistance at ₹285–₹300.
• Moving Averages: Stock remains above both its 50-EMA and 200-EMA — a structurally bullish indicator.
• Momentum:
o RSI: 60–65 (bullish, but approaching overbought)
o MACD: Fresh bullish crossover; volume shows accumulation near breakout.
• Outlook: Breakout above ₹285 could trigger medium-term upside toward ₹320–₹340. Buy-on-dips is favored, with strong accumulation likely in the ₹230–₹240 zone.
🚀 Growth Prospects & Strategic Moves
• Capacity Expansion: Plans to nearly double port capacity by FY30 (from ~160 MTPA to ~300 MTPA).
• Cargo Diversification: Targeting major reduction of group dependency (from ~70% to ~50%) by growing third-party cargo traffic.
• New Projects: Investment pipeline includes both greenfield and brownfield projects in Odisha, Maharashtra, and other states.
• Integrated Logistics: Deeper backward integration into rail connectivity and warehousing to capture higher value from logistics value chain.
• Macro Tailwinds
o Major government initiatives (e.g., Sagarmala) catalyzing sector growth.
o India’s trade/exports rising; strong outlook for cargo and container volumes.
o Shifts in supply chains to coastal shipping and blended logistics.
o Demand uptrend in containerization and warehousing services.
⚠️ Key Risks & Limitations
• High Capex Cycle: Expansion could elevate debt and financial leverage.
• Macro Sensitivity: Lower industrial/output growth would hit cargo volumes.
• Regulatory Overhang: Tariff and ESG regulations present chronic uncertainty.
• Group Concentration: Third-party cargo growth remains an execution challenge.
• Rivalry: Competitive intensity from Adani, DP World, and others is ramping up.
📌 Conclusion & Investment Verdict
Parameter Verdict
Fundamentals Strong, superior margins, efficient operations
Valuation Fair to premium (due to uptrend and growth)
Technical Trend Bullish, ready for potential breakout
Growth Outlook High (supported by sector tailwinds)
Risk Profile Moderate (driven by capex & regulatory factors)
For long-term investors:
JSW Infra presents a compelling case for portfolio inclusion, offering robust growth visibility, sectoral leadership, and operating excellence. Accumulation is best near ₹230–₹240 on dips.
Short-term view:
Stocks in strong uptrends may see minor corrections but are well-placed for fresh breakouts above ₹285, targeting ₹320–₹340.
The stock is ideal for investors seeking infrastructure-sector exposure with high growth potential, but one must remain mindful of execution and regulatory risks.
==============================
==============================
⚠️ Disclaimer:
This analysis is for educational and informational purposes only.
We are not SEBI-registered analysts or advisors.
This is our personal view based on available data and market trends.
Please consult your SEBI-registered investment advisor before making any investment or trading decisions.
You are solely responsible for any financial decisions you make based on this content.
========================
Trade Secrets By Pratik
========================
My PredictiveEngine's Intraday call(26-Mar) - UBL - Short Off-late I started investigating more on predicting the next candle for the day and seeing enough success by using the patterns of various indicators. Pine scripting in tradingview has helped a lot to automate everything and create necessary signals. Based on the engine's call, tomorrow (26-Mar-2018) will be a super "RED" for NSE:UBL
Sell below: 941.8
Target-1: 932.1
Target-2: 928.4
Target-3: 923.9
Target-4 (for Risk takers) - 908.2
Stop loss: 947.7
Note: These calls are based on my own analysis. It may or may not work well for you. So please carefully consider whether it is suitable for you and please do your own research before attempting any. The profit/loss made by you due to this call, is solely your own responsibility. Thanks, All the best. Happy Trading. :-)

My Predictive Engine's Intraday call (23-Mar) - CADILAHC - ShortOff-late I started investigating more on predicting the next candle for the day and seeing enough success by using the patterns of various indicators. Pine scripting in tradingview has helped a lot to automate everything and create necessary signals. Based on the engine's call, tomorrow (23-Mar-2018) will be a super "RED" for NSE:CADILAHC
Sell below: 376.3
Target-1: 373.5
Target-2: 371.8
Target-3: 370.1
Stop loss: 379.8
Note: These calls are based on my own analysis. It may or may not work well for you. So please carefully consider whether it is suitable for you and please do your own research before attempting any. The profit/loss made by you due to this call, is solely your own responsibility. Thanks, All the best. Happy Trading. :-)

My Predictive Engine's Intraday call (23-Mar)-ICICIPRULI - ShortOff-late I started investigating more on predicting the next candle for the day and seeing enough success by using the patterns of various indicators. Pine scripting in tradingview has helped a lot to automate everything and create necessary signals. Based on the engine's call, tomorrow (23-Mar-2018) will be a super "RED" for ICICIPRULI - NSE:ICICIPRULI
Sell below: 377.55
Target-1: 374.7
Target-2: 373.1
Target-3: 371.2
Stop loss: 380.8
Note: These calls are based on my own analysis. It may or may not work well for you. So please carefully consider whether it is suitable for you and please do your own research before attempting any. The profit/loss made by you due to this call, is solely your own responsibility. Thanks, All the best. Happy Trading. :-)

My Predictive Engine's Intraday call(23-Mar)-Hindalco-Long Off-late I started investigating more on predicting the next candle for the day and seeing enough success by using the patterns of various indicators. Pine scripting in tradingview has helped a lot to automate everything and create necessary signals. Based on the engine's call, tomorrow (23-Mar-2018) will be a super "GREEN" for Hindalco NSE:HINDALCO
Buy above: 217.3
Target-1: 219
Target-2: 220
Target-3: 220.95
Stop loss: 215.4
Note: These calls are based on my own analysis. It may or may not work well for you. So please carefully consider whether it is suitable for you and please do your own research before attempting any. The profit/loss made by you due to this call, is solely your own responsibility. Thanks, All the best. Happy Trading. :-)

My Predictive Engine's Intraday call - SunPharma - ShortOff-late I started investigating more on predicting the next candle for the day and seeing enough success by using the patterns of various indicators. Pine scripting in tradingview has helped a lot to automate everything and create necessary signals. Based on the engine's call, tomorrow (22-Mar-2018) will be a super "Red" candle for NSE:SUNPHARMA .
Following are the entry/exit points
Short Below: 503.0
Target-1: 499.5
Target-2: 497.2
Target-3: 494.8
Stop loss: 508.2
Happy trading

My Predictive Engine's Intraday call (22-Mar) - HCLTECH - SHORTOff-late I started investigating more on predicting the next candle for the day and seeing enough success by using the patterns of various indicators. Pine scripting in tradingview has helped a lot to automate everything and create necessary signals. Based on the engine's call, tomorrow (22-Mar-2018) will be super "RED" candle for NSE:HCLTECH .
Short Below: 935.0
Target-1: 928.0
Target-2: 923.7
Target-3: 919.3
Stop loss: 942.4
Happy Trading!!!

My Predictive Engine's Intraday call (22-Mar) BHARTIARTL- ShortOff-late I started investigating more on predicting the next candle for the day and seeing enough success by using the patterns of various indicators. Pine scripting in tradingview has helped a lot to automate everything and create necessary signals. Based on the engine's call, tomorrow (22-Mar-2018) will be a super "RED" for NSE:BHARTIARTL
Short below: 417.1
Target-1: 415.1
Target-2: 413.1
Target-3: 411.2
Stop loss: 421.6
Happy Trading!!!

BULLISH On VOLTASTrendline (using pine script)and the specially designed volume action analysis(using pine script) suggest a bullish run on the VOLTAS.
This is my weekly analysis on VOLTAS ,RESISTENCE becoming the new support line.
will give follow back to all the followers.
Please comment and let me know about my analysis, Follow for more analysis.

Call and put stratagyMoving Averages (MA): The script uses two simple moving averages (SMA) — a shorter one (default length of 9) and a longer one (default length of 21). The strategy is based on the crossover of these MAs.
RSI (Relative Strength Index): An RSI indicator is used to check if the asset is overbought or oversold, adding another layer of confirmation for buy or sell signals.
Buy Signal: A buy signal is generated when the shorter MA crosses above the longer MA, and the RSI is below the oversold level (30).
Sell Signal: A sell signal is triggered when the shorter MA crosses below the longer MA, and the RSI is above the overbought level (70).
How to Use:
Copy and paste the script into the Pine Script editor in TradingView.
Adjust the input parameters as needed based on backtesting results or personal preferences.
Add the indicator to your chart and analyze its performance.
Important Note:
Backtest the strategy with historical data to check its performance and make necessary adjustments.
No indicator can guarantee 90% accuracy consistently. It is crucial to use risk management techniques and combine this indicator with other market analysis tools.
Would you like to add any specific features or customize this strategy further?

BUY NIFTY18SEP11600PESignals are generated using a proprietary indicator developed by me using Tradingview Pine Script ( and ).
My posts here are delayed. To get real time updates take subscription for TrendShikariNTS.

BUY NIFTY18SEP11300CESignals are generated using a proprietary indicator developed by me using Tradingview Pine Script ( and ).
My posts here are delayed. To get real time updates take subscription for TrendShikari NTS

Buy NIFTY18SEP11600PESignals are generated using a proprietary indicator developed by me using Tradingview Pine Script ( and ).
My posts here are delayed. To get real time updates take subscription for TrendShikari NTS.

Buy NIFTY18SEP11600CESignals are generated using a proprietary indicator developed by me using Tradingview Pine Script ( and ).

Buy NIFTY18SEP11400CESignals are generated using a proprietary indicator developed by me using Tradingview Pine Script ( and ).

Buy NIFTY18SEP11800PESignals are generated using a proprietary indicator developed by me using Tradingview Pine Script ( and ).
