Ripple Might be Go to $0.235 LevelRipple Might be go for $0.235 in next 48 Hours. It may be possible scenario.
Thanks & Regards
Myrocket7393
Search in ideas for "RIPPLE"

Ripple Long-Term ViewRipple(XRP/USD)
Ripple
Overview
Ripple(XRP/USD) has suffered about 91+% correction(drop) since all time high-level price($3.3+) reached in January’18.It has seen significant upward movement in the month of September’18(110+%) and is now retesting a major support level.
Let us continue to analyze price action for Ripple(XRP/USD) over the long term and proceed to highlight any potential areas of support and resistance moving forward.
Long-Term Analysis (Monthly Timeframe)
Scenario 1: Bullish (Uptrend)
The bullish argument one can see on the XRP/USD chart is that it has been respecting the long-term trend-line(since July'17) pretty well. The trend-line was tested in September'18 which lead to a movement of 110+% upside. It is retesting again now and we might see an upside movement to the Resistance Zone 1 ranging from $0.63--$0.71 if the Support Zone from $0.16--$0.29 holds well.
Support Zone is quite a strong area of bounce as its the previous year resistance now turned support.
If Ripple held the trend-line then it might follow path "1" as specified in the chart.
If it manages to close above "Resistance(Sell) Zone 1" then it will retest "Resistance(Sell) Zone 2" ranging from -$0.84--$0.98 within few months which might show some sign of bullish confirmation.
Stochastic RSI is also in the oversold region with an upward trend.
Scenario 2: Bearish (Downtrend)
If the monthly candle(December) closes below $0.28 and the trend-line doesn't hold up then we might follow the path "2".
If the trend-line is broken with strong sell volume then the trend-line will act as a strong resistance area to break in the future.
Generally, if the trend-line is retested multiple times then it becomes weaker.
Note: Monthly time frame charts illustrates the movement of price over a long-term horizon and are most often used by long-term investors.
Short-Term Analysis (Daily and Weekly)
Scenario 1: Bullish (Uptrend)
The weekly chart of (XRP/USD) shows that the long downtrend line(red dotted) has been broken with significant buy volume showing bullish signs.
It tested the support zone and jumped 110+% in September'18 proving this zone to be strong support.
If this support zone held in the coming weeks/month then we might retest the Resistance Zone 1 ranging from $0.58--$0.70.
We get the confirmations of the next bull cycle only if the Resistance zone 2 ranging from $0.88-$1 is broken with significant buy volume.
Scenario 2: Bearish (Downtrend)
If the support zone is broken with significant sell volume then we might test area of $0.07-0.14$ price levels and support zone will act as a strong resistance area to be broken in the near future.
News and event analysis:
One of the major catalyst which happened in the past that, 42nd President of the United States Bill Clinton was a keynote speaker in the Swell conference held in the October'18.
Many banks are experimenting with its Ripple network(xRapid) for money transfer across borders.
There is still decision to be made by SEC(USA) authorities whether or not Ripple is security.
Conclusion:
Ripple remains in 2nd position, in terms of overall market cap rankings along with Bitcoin and Ethereum.
The 65-month-old coin is now experiencing its first bear market and has already corrected enough(91% down) to commence its new bull cycle in coming weeks/months.
People likely showed interest in Ripple as it offers a cheap alternative in terms of asset price when compared to bitcoin and other crypto assets with good fundamentals.
The only concern lies with Ripple is of categorizing it to be a Security which might lead to retail traders not able to participate in trading.


Ripple/Bitcoin Failing Wedge PossibleRipple/Bitcoin Failing Wedge Possible.... XRP/Btc
#binance #coinbase #xrp #forexsignals #finance #ripple #stocks #binary #hodl #bitcoinexchange #altcoin #success #blockchaintechnology #mining #forexlifestyle #usa #cryptoworld #wealth #motivation #financialfreedom #cryptomining #bitcoinbillionaire #trade #altcoins #ico #gold #stockmarket #wallstreet #cryptoinvestor #cryptotrader
#crypto #bitcoin #cryptocurrency #blockchain #btc #ethereum #forex #money #trading #bitcoinmining #cryptocurrencies #bitcoinnews #cryptotrading #bitcoins #investment #investing #entrepreneur #cryptonews #invest #business #eth #bitcointrading #forextrader #litecoin #bitcoincash #trader #bitcoinprice #investor #forextrading #bhfyp

Ripple hit 7 Years High: 500% up from Our EntryRipple hit 7 Years High:
🔹 XRP/USDT 500% up from our Initial Entry.
🔹 I am booking 80% Profit here for safe Zone.
🔹 500% Profit not bad guys.
I told you to buy at $0.40-$0.50 and ignore the negative news and drama (thanks, Gary Gensler). Hope you held strong because now you're in huge profits. 🎉
❤️ $3 is just around the corner.
What’s Next?
▪️ I’m expecting $3-$5 in this bull run for XRP.
▪️ Don’t repeat last bull run’s mistake: Holding blindly and not selling when it’s time.
My Suggestion:
▪️ Take out your initial investment and 70% Profit and hold the rest as profit.
▪️ While $10 is possible, it’s unlikely this bull market.
Smart moves can turn this into a big win.
Of corse NFA & DYOR

Ripple Price Prediction - Day 1Ripple possible outcomes and two long ideas.
Not financial advice
DYOR


Ripple a good or bad bet for now.A nice bet in crypto can be the Ripple coin. As it has not formed a new LOWER LOW.
The coin on seems to hold the support level of 0.585 on weekly basis.
The coin has been in a bearish trend and signs of trend reversal are there.
Ripple had made an equal and if it break the previous high convincingly a bullish momentum is possible.
On weekly analysis, coin is trading around its 20 ema.
Ripple can be a positional trade.
The coin has consolidated in a range on a high time frame, its break out will confirm the trend reversal.
Moreover, it will be trading above its moving averages.
A nice momentum trade can also be initiated for intraday and swing trade.


RIPPLE getting ready for clear BREAKOUT?Holding the Fibonacci Levels & Channel Levels, RIPPLE looks headed to 200 INR.

Ripple has good opportunityOm Namah Shivay
Ripple is in a position of trade. it has the potential to touch 75527. If price goes above 53995 then go long.
Below 51809, look 33915 short. Possibly it is planning for a short first.
Careful with the invalidation points.
Om Namah Shivay

Ripple vs Bitcoin | It's Been A While (Can Go Up?)It's been a while since my last analysis on the XRPBTC (Ripple vs Bitcoin) chart... This is one of our favorites.
XRPBTC printed a higher low on low volume... This retrace is coming to an end.
Many other altcoins pairs have a similar chart, a strong retrace that produced a higher low, and ended up in a strong bullish breakout, this can happen for Ripple as well.
The chart is looking neutral right now but the tendency is up.
If the orange trendline is broken, XRPBTC can go lower and hit support.
If prices stay above this trendline, we can expect the next move to be a nice JUMP!
Remember to hit LIKE to show your support.
I will be doing a 10X Lev. trade for Ripple once more... Hoping for great profits for us.
Namaste.
Please support my BTCUSD and ETHUSD analysis as well, every bit counts 😊
Thanks again... Feel free to leave a comment anytime with your thoughts and questions, I am so happy to help.
✴️ Bitcoin Conquers EMA10, Aims At $9,500/$9,900 Next!
Ethereum Hits Support, Going To $260 or $285+?


💡Don't miss the great buy opportunity in Ripple/BitcoinTrading suggestion:
". There is a possibility of temporary retracement to suggested support line (0.00002980).
. if so, traders can set orders based on Price Action and expect to reach short-term targets."
Technical analysis:
. Ripple/Bitcoin (XRPBTC) is in a range bound and the beginning of uptrend is expected.
. The price is above the 21-Day WEMA which acts as a dynamic support.
. The RSI is at 42.
Take Profits:
TP1= @ 0.00003300
TP2= @ 0.00003490
TP3= @ 0.00003820
TP4= @ 0.00004200
TP5= @ 0.00004770
TP6= @ 0.00005370
SL= Break below S2
❤️ If you find this helpful and want more FREE forecasts in TradingView
. . . . . Please show your support back,
. . . . . . . . Hit the 👍 LIKE button,
. . . . . . . . . . Drop some feedback below in the comment!
❤️ Your Support is very much 🙏 appreciated! ❤️
💎 Want us to help you become a better Forex trader ?
Now, It's your turn !
Be sure to leave a comment let us know how you see this opportunity and forecast.
Trade well, ❤️
ForecastCity English Support Team ❤️

A Long-Term Trading Opportunity To Buy in Ripple/Euro ...Technical analysis:
. RIPPLE/EURO is in a Range Bound and Beginning of uptrend is expected.
. The price is below the 21-Day WEMA which acts as a dynamic resistance.
. The RSI is at 44.
Trading suggestion:
There is a possibility of temporary retracement to suggested support zone (0.55 to 0.38). if so, traders can set orders based on Daily-Trading-Opportunities and expect to reach short-term targets.
. Beginning of entry zone (0.55)
. Ending of entry zone (0.38)
Entry signal:
Signal to enter the market occurs when the price comes to "Buy zone" then forms one of the reversal patterns, whether "Bullish Engulfing" , "Hammer" or "Valley" , in other words,
NO entry signal when the price comes to the zone BUT after any of reversal patterns is formed in the zone.
To learn more about "Entry signal" and the special version of our "Price Action" strategy FOLLOW our lessons:
Take Profits:
TP1= @ 0.76
TP2= @ 0.96
TP3= @ 1.39
TP4= @ 2.33
TP5= @ 2.86
TP6= Free

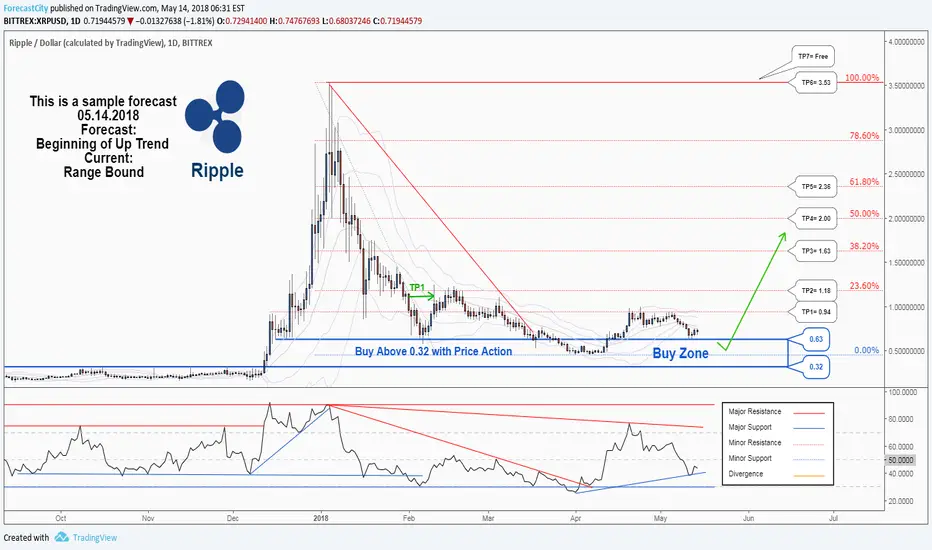
There is a possibility for the beginning of uptrend in RippleTechnical analysis:
. RIPPLE/DOLLAR is in a Range Bound and Beginning of up trend is expected.
. The price is below the 21-Day WEMA which acts as a dynamic resistance.
. The RSI is at 44.
Trading suggestion:
There is a possibility of temporary retracement to suggested support zone (0.63 to 0.32). if so, traders can set orders based on Daily-Trading-Opportunities and expect to reach short-term targets.
. Beginning of entry zone (0.63)
. Ending of entry zone (0.32)
Entry signal:
Signal to enter the market occurs when the price comes to "Buy zone" then forms one of the reversal patterns, whether "Bullish Engulfing" , "Hammer" or "Valley" , in other words,
NO entry signal when the price comes to the zone BUT after any of reversal patterns is formed in the zone.
To learn more about "Entry signal" and special version of our "Price Action" strategy FOLLOW our lessons:
Take Profits:
TP1= @ 0.94
TP2= @ 1.18
TP3= @ 1.63
TP4= @ 2.00
TP5= @ 2.36
TP6= @ 3.53
TP7= Free
Ripple (XRP) Price Prediction 2022 Ripple (XRP) Price Prediction 2022
Ripple (XRP) holds the 7th position on CoinGecko right now. XRP price prediction 2022 is explained below with a daily time frame.
The above chart of Ripple (XRP) laid out an Ascending Triangle.The ascending triangle is a characteristic pattern of an ongoing bullish trend. This triangle is formed by a horizontal upper trendline that connects the highs and the lower trendline that connects the rising lows. If the trend breaks out at the resistance level, the price will continue to move up in this ascending triangle pattern.
Currently, Ripple (XRP) is in the range of $0.3468. If the pattern continues, the price of XRP might reach the resistance levels of $0.5937. If the trend reverses, then the price of XRP may fall to $0.3309

A Breakout in Ripple| Buy once Trend Line BreakA Breakout opportunity in Ripple (In Daily chart). It is Cup & Handle Pattern. Buy once Trend Line Break and a 15 minute candle close above it. #ripple #cryptocurrency

[XRPU19][LONG][7X][165.13% ROE] Ripple 7X Lev. (165% ROE)Here is our full trade for Ripple (XRPU19) on BitMEX.
We are using 7X (high leverage) for high ROE.
BitMEX (leveraged) trading is for experienced/advanced traders only.
This is not financial advice. We are sharing our views and opinion for learning and entertainment purposes only.
A trade setup can do good just as it can go bad. Some we win others we lose. If you decide to trade, you do so at your own risk.
We recommend trading altcoins pairs for beginners, margin trading should be done only after you have lots of experience and you have patience as well.
Patience is key.
Thanks a lot for your continued support.
Now, let's take a look at the numbers for our Ripple (XRPU19) trade:
_________________
Pair: LONG XRPU19 (Ripple)
Leverage: 7X
Entry: 0.00002550 – 0.00002670
Time frame: 4H
Targets:
(1) 0.00002700
(2) 0.00002820
(3) 0.00002900
(4) 0.00003110
(5) 0.00003300
Stop-loss: Close daily (1D) below 0.00002400.
Liq. price: 0.00002356
(Buy-in calculated at 0.00002670)
Potential profits: 165.13% ROE
Capital allocation: 6%.
_________________
If you have any questions, feel free to use the comments section below.
This is Alan Masters.
Namaste.

XRP/USDT RIPPLE Ready for $10 in bull market ?#XRP/USDT Bull Market Technical Analysis:
➡️ Last bull #XRP seriously underperformed while stuck fighting the #SEC
➡️ BTC hit new highs while XRP failed to pass 2017's $3.30 ATH
But with the SEC case now won - the floodgates may finally BE OPEN!
➡️ Similar triangle breakdown to 2017 is FORMING!
➡️ If 2017's 40,000% pump repeats - we could see mind-blowing $10+ XRP!
➡️ Survived 2,291 (6+ Years) brutal bear days - this coiling pattern signals Ripple's ready to ERUPT!
My Accumulation Zone: $0.40 - $0.50
Targets: $0.90/$1.95/$4/$7/$10+( bonus )
If you believe in parabolas, triangles, and cycles - CRYPTOCAP:XRP may be on the launching pad again here!!

XRPUSD long Ripple chart analysis XRPUSD long Ripple chart analysis
XRP looks perfect to buy here, which can give me you the best return.
I will add more if the next weekly candle closes bullish

Long on ripplewe could see ripple rising to some point and then correction to area of interest where i personally will go long .
Disclaimer: This is just my analysis and you must take financial advice or do your own research before investing.
Thank you
ps; I am still learning please let me know more on this guys.

XRP:RIPPLE : Corrective sequenceAfter peaking to 55 level ripple is currently forming a corrective structure & should face a sell off soon for the target region of 21 .
