tajgvk hotels ### **Technical Analysis of TajGVK Hotels & Resorts Ltd. (TAJGVK)**
#### **1. Support and Resistance Levels (Current Situation)**
- **Support Levels:**
- The key support levels to watch are typically previous price lows, or areas where the stock has repeatedly bounced back in the past.
- **Example Support Levels:** If the stock recently bounced at ₹240 and ₹230, these might be considered strong support levels. A drop below these levels could signal a further downtrend.
- **Resistance Levels:**
- Resistance levels are price zones where the stock has previously faced selling pressure. If the stock price is approaching a key resistance area and is struggling to break through, it might indicate a reversal or consolidation.
- **Example Resistance Levels:** If the stock is struggling to break through ₹270 and ₹280, these could be key resistance levels. A breakout above these levels would signal bullish momentum.
#### **2. Moving Averages (MA) Analysis:**
- **50-day MA:** If the stock is trading above the 50-day moving average, it signals a potential bullish short-term trend. A price below the 50-day MA suggests a bearish or corrective phase.
- **Current Situation:** If the stock is at ₹250 and the 50-day MA is at ₹245, the stock is currently above the short-term trend indicator, which is bullish.
- **200-day MA:** This is an important long-term indicator. If the stock is trading above the 200-day MA, the long-term trend is considered bullish. If it's below, the long-term trend may be bearish.
- **Current Situation:** If the stock is at ₹250 and the 200-day MA is at ₹240, the stock is still in a long-term uptrend.
#### **3. RSI (Relative Strength Index):**
- **RSI Levels:**
- **Above 70:** Indicates that the stock is potentially overbought and may be due for a pullback.
- **Below 30:** Indicates the stock is oversold and may be due for a reversal or rally.
- **Current Situation:**
- If the RSI is at **75**, it suggests the stock is in overbought territory and may face a correction soon.
- If the RSI is at **25**, it suggests the stock is oversold, which could signal an upward move or reversal.
#### **4. MACD (Moving Average Convergence Divergence):**
- **Bullish Cross:** When the MACD line crosses above the signal line, it signals upward momentum.
- **Bearish Cross:** When the MACD line crosses below the signal line, it indicates potential downward pressure.
- **Current Situation:**
- If the MACD has recently crossed above the signal line, it suggests bullish momentum and could be a signal to enter long positions.
- If the MACD is below the signal line, it might indicate weakness and potential selling pressure.
#### **5. Volume Analysis:**
- **Increasing Volume:** Confirm price movements. Rising volume during upward movements suggests strong buying interest, while rising volume during downward movements signals strong selling interest.
- **Decreasing Volume:** Can indicate weakening momentum, either during a rally or a decline.
- **Current Situation:**
- If the stock is moving upwards with increasing volume, it indicates strength in the price move.
- If the stock is declining with high volume, it could signal that the downtrend has strength.
#### **6. Candlestick Patterns:**
- **Bullish Patterns:** **Hammer**, **Engulfing**, **Morning Star**, and **Bullish Harami** are all potential signs of reversals to the upside.
- **Bearish Patterns:** **Shooting Star**, **Evening Star**, and **Bearish Engulfing** could indicate a potential reversal to the downside.
- **Current Situation:**
- If the stock has recently formed a **Bullish Engulfing** pattern, it may suggest the start of an upward move.
- If a **Shooting Star** or **Evening Star** has formed at a resistance level, it could indicate a potential reversal and price drop.
#### **7. Fibonacci Retracement Levels:**
- Use Fibonacci retracement to find key support or resistance levels. If the stock is in an uptrend, key retracement levels are typically at **23.6%, 38.2%, 50%, 61.8%**.
- If the stock is pulling back, check these levels for potential areas to find support.
- **Current Situation:**
- If the stock has risen from ₹230 to ₹270, the key Fibonacci retracement levels to watch for support would be around ₹255 (23.6%), ₹245 (38.2%), and ₹240 (50%).
---
**Disclaimer:**
- I am not a SEBI-registered professional or licensed financial advisor.
- All analysis, recommendations, and opinions provided are based solely on historical price data, patterns, and general market trends.
- Any action you take on the basis of this information is at your own risk. Please consult with a licensed financial advisor before making any investment decisions.
- Technical analysis cannot guarantee future results and may not be accurate in predicting market movements.
- Market conditions and stock prices can be influenced by many factors including external events, news, and economic data, which are beyond the scope of this analysis.
el, feel free to share any real-time data you may have, and I can tailor the analysis accordingly!
Search in ideas for "STRONG BUY"

Strong Bullish Momentum with EMA 200 Crossover + RSI Breakout📈 Stock: Mazagon Dock Shipbuilders (NSE:MAZDOCK)
🔍 Closing Price: 2180.10
📊 Technical Signals:
✅ Strong Bullish Candle, signaling strong buying interest
✅ Bullish Engulfing pattern adds strength to the trend
✅ EMA 200 Crossover, indicating trend strength
✅ RSI Breakout, confirming bullish momentum
Key Levels to Watch:
🔹 Support Zones: 1999 – 1819 – 1721
🔹 Resistance Zones: 2278 – 2377 – 2557
Trading Outlook:
📌 Sustained move above 2278 may open the path towards 2377 and 2557.
📌 If price dips below 1999, a retracement toward 1819 is possible.

Redington: Swing Trade OpportunityRedington has demonstrated a significant recovery after a rebound from the demand zone, which is identified between the price levels of 158 to 161. The stock has successfully breached the previously established resistance range of 186 to 189, closing above this critical level, which is a positive indicator for potential further upward movement.
The price movement from lower lows to higher highs illustrates a robust bullish trend. Notably, the stock has encountered the 61.8% Fibonacci retracement level multiple times, reinforcing the notion of a strong upward trajectory in the near term. This recurring interaction with the Fibonacci level suggests that the market participants view this area as a strong point of support and resistance, which is crucial for traders to consider.
Further corroborating the positive outlook, both the Relative Strength Index and the Moving Average Convergence Divergence indicators on the daily and weekly time frames reflect strong buying momentum. An RSI value above 70 may indicate an overbought condition; however, current readings suggest that the stock is not yet in that territory, leaving room for potential upward movement. Meanwhile, the MACD crossing above its signal line indicates a bullish trend.
The stock currently appears poised for accumulation at the current market price. Traders and investors should be aware of a potential resistance range at approximately 225 to 227. It is advisable to consider placing a stop-loss order below the demand zone, ideally around the 158 level, to mitigate potential losses in the event of an unfavourable market movement.
Disclaimer:
The information contained in this technical analysis report is for informational and educational purposes only and should not be construed as financial advice. It is recommended that individuals conduct their own research or consult a qualified financial advisor and consider their financial situation and risk tolerance before making any investment decisions.

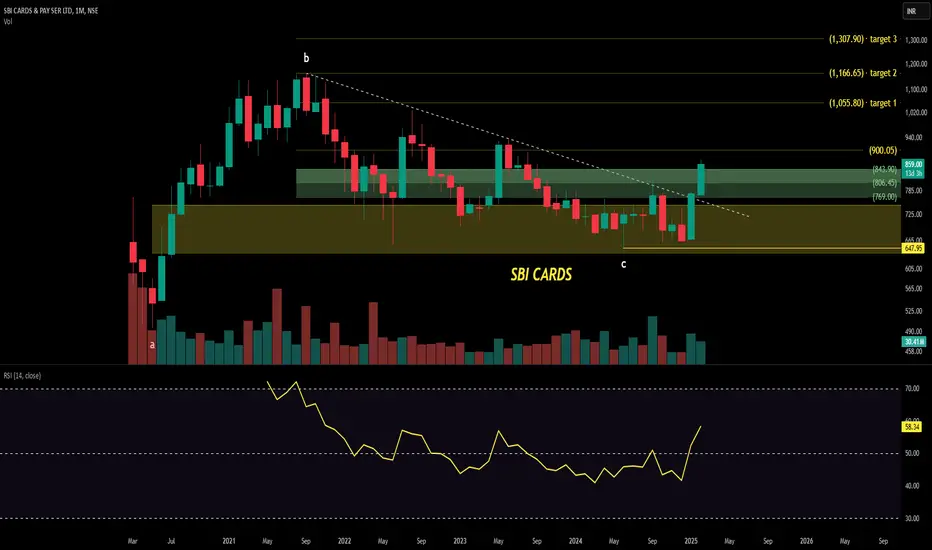
ready to blast SBI CARDSRelative Strength Index (RSI)
RSI Value: 58.34
Interpretation: The RSI indicates that the stock is in a neutral to slightly bullish territory. RSI values above 70 indicate an overbought condition, while values below 30 indicate an oversold condition. With a current RSI of 58.34, the stock is neither overbought nor oversold.
Volume
Recent Volume: 30.41 million
Interpretation: The recent increase in volume suggests strong buying interest and higher trading activity. A significant increase in volume often indicates strong investor interest and can signal the strength of price movements.
Key Support and Resistance Levels
Support Levels:
647.95 INR (Highlighted support zone)
Resistance Levels:
769.00 INR
806.45 INR
843.90 INR
900.05 INR
Target 1: 1,055.80 INR
Target 2: 1,166.65 INR
Target 3: 1,307.90 INR
Trend Analysis
Trendline: The chart shows a descending trendline from point 'b' to point 'c', which has been recently broken with the latest candlestick moving above the trendline. This breakout indicates a potential reversal of the previous downtrend.
Candlestick Patterns: The recent candlestick shows a significant upward movement with a closing price of 859.00 INR, up by 80.80 INR (+10.38%).
Summary
The stock has recently broken above several resistance levels (769.00 INR, 806.45 INR, and 843.90 INR) and is approaching the next resistance at 900.05 INR. The RSI value suggests a neutral to slightly bullish stance, and the increase in volume indicates strong investor interest. The breakout above the descending trendline indicates a potential reversal of the previous downtrend.
Disclaimer: This analysis is for informational purposes only and should not be considered as financial advice. I am not a SEBI registered analyst. Please consult with a certified financial advisor before making any investment decisions.
HIMATSEIDE Trade set up with 17RHimatsingka Seide Ltd (HIMATSEIDE) has shown strong bullish price action recently. The stock closed at 183.95 on February 4, 2025, which is 20.47% below its 52-week high of 231.30 set on December 11, 20243. The stock has been exhibiting positive momentum with several bullish indicators:
Breakout: HIMATSEIDE has shown a rounding bottom breakout, indicating potential for significant upside12.
Volume: The stock has been trading with rising price and increasing volume, signaling strong buying interest4.
Technical indicators:
The stock has made a new six-month high with good volume.
It has shown a positive breakout from Keltner Bands, MA Envelope Bands, and Bollinger Bands.
The MACD indicator shows a bullish crossover and is sustaining above the signal line.
Trend strength: The Average Directional Index (ADX) indicates a nice uptrend.
Momentum: Both Slow Stochastic and Money Flow Index (MFI) are in overbought territory, but the uptrend appears strong, suggesting potential for further upward momentum.
However, investors should note that the stock's PE ratio of 21.09 is considered high, and its P/B ratio of 1.27 is also on the higher side. Additionally, historical data shows that HIMATSEIDE has given negative returns in February for 20 out of 26 years, with an average negative change of -7.06%.
Given these factors, while the current price action is bullish, investors should carefully consider the potential risks and historical performance before making investment decisions.

Jash Enginering. Watch for a Base Breakout!Stock: Jash Engineering Ltd.
Chart Pattern: Breakout from a consolidation range.
Key Levels:Entry: ₹655.5
Stop Loss (SL): ₹545.10
Expected T1: 777
Observations:
- Strong bullish momentum with a 10.23% move today.
-Price consolidating and forming a base
-Above key moving averages.
-Resilient in Bearish Market
-Volume spike indicates strong buying interest.
-Strong RSI
-Stock is in an Uptrend.
-Takes Support at 50 and 200 DMA on each pull back.
Risk-Reward: Favorable setup for swing traders.
⚠️Overall Market is Bearish. We are trading against the trend. Risk Management is important. If your Risk Management is poor then please do not trade.
Disclaimer: This is for educational purposes only, not financial advice.

XAUUSD | Trading Strategy For Monday✅Friday's non-farm payrolls data was bearish for gold, but the trend was unexpected. Although there was a pullback, it eventually showed a bottoming-out and rebounding pattern. It rebounded after hitting a low of around 2664, and rose to a high of 2697, closing at around 2690. The daily line recorded four consecutive positives, and the weekly line also closed with a big positive, showing that the bulls are still strong. The current upper pressure level of gold prices is at the 2700 integer mark, and the key resistance and watershed are around 2710. Breaking through this position may stimulate a new round of bullish upward space.
✅However, we should also be wary of the possibility of a change in the market next week. Since the pullback from 2583, the gold price has risen by about $110. Although the bullish trend is strong, we need to pay attention to the digestion of support. The current key support below is at 2680. If this position is stable, the bulls may continue to exert their strength; if there is a weak pullback in the European session, the support needs to be focused on around 2665, and it is expected that there will still be strong buying support here.
✅Long order strategy
🔰If the gold price retreats to the 2682-2680 range, long orders can be arranged with a light position, and the target is around 2700-2710;
🔰If the gold price retreats to the 2670-2665 range to stabilize, long orders can be added, and the target is also 2700-2710
✅Short order strategy
🔰If the gold price encounters resistance near 2710, short-term short orders can be tried with a light position, and the target is 2685-2680.
🔰If the gold price breaks through 2710, continue to follow up with long orders after the retracement is confirmed, and the target is 2727.
✅The current trend of gold prices is relatively strong, but it is necessary to pay attention to the performance of the 2700-2710 pressure area above and the strength of the pullback support. When the market opens next Monday, if the gold price retreats to the key support of 2680 or 2665 and stabilizes, it is recommended to continue to focus on long positions at low levels, while paying close attention to the impact of market news on the gold price to adjust the strategy.

Technical Analysis: Potential Bullish Reversal at Weekly DemandThe chart highlights a critical supply-demand setup for this asset, currently trading at $0.03773, which is situated within a Weekly Demand Zone. The price has retraced from its 2024 highs around $0.18 and is now testing a significant support area, suggesting a potential reversal to the upside.
Key Observations:
Weekly Demand Zone (Support Area):
The gray zone marks a strong accumulation area where buyers historically stepped in, initiating a rally toward $0.18 earlier in 2024. This demand zone aligns with key structural lows, acting as a reliable support level.
Break of Structure (BOS):
In early 2024, the breakout above $0.06 (marked BOS) indicated a bullish shift in market structure. The current retracement suggests a potential retest of this area before a new bullish impulse.
Volume Analysis:
The current volume at 38.87M shows increasing activity as the price approaches the demand zone, a sign that buyers could soon reclaim control. High volume near demand zones often confirms accumulation by institutional players.
Price Action Signals:
Candlestick patterns near the demand zone show long lower wicks, indicating rejection of lower prices. This aligns with historical behavior, where strong buying pressure emerged at similar levels.
Bullish Projection:
A successful bounce from the $0.03–$0.04 demand zone could trigger a new rally. The price may target intermediate resistance levels at $0.06 and $0.12, with a longer-term potential to retest 2024 highs near $0.18.
Bull Case:
Strong support at the demand zone suggests limited downside risk.
Increasing volume signals accumulation.
Break above $0.06 could confirm the reversal and attract more buyers.
Bear Case:
Failure to hold the demand zone may result in further downside, with potential support near $0.02.
Broader macroeconomic or market-specific bearish trends could suppress bullish momentum.
Outlook:
Short-Term (1–4 weeks): Expect consolidation within the demand zone, with $0.04 as critical support.
Medium-Term (1–3 months): A break above $0.06 could signal a sustained bullish trend toward $0.12.
Long-Term (3+ months): If bullish momentum persists, the price could revisit $0.18, completing a full cycle from the demand zone.

Delta Air Lines (DAL) - Breakout Play with Strong Volume ConfirmKey Observations:
Breakout Zone:
DAL has broken above a significant resistance level at $67.87, with a strong bullish candle and a 9% gain in one day.
Volume Spike:
A substantial volume increase indicates strong buying interest and institutional participation.
Risk/Reward Setup:
Entry Price: $67.87 (breakout level)
Target Price: $95.07 (potential upside of ~39.6%).
Stop Loss: $55.45 (below support zone).
Risk/Reward Ratio: 2.14
Moving Averages Support:
The stock is trading above key moving averages, showing a positive trend shift.
Trade Plan:
Bullish Case:
If the stock sustains above the breakout level, the next target zone lies near $95, aligning with historical resistance levels.
Bearish Case:
If the breakout fails and the price falls below $61.54, it may retest lower support at $55.45.
Disclaimer:
This idea is for educational purposes only. Please conduct your own research before making any investment decisions.

ACC Ltd | Bullish Reversal Setup with Strong ConfluenceOverview:
This idea highlights a potential bullish reversal setup for ACC Ltd (NSE) based on technical confluences observed in the daily time frame. The stock is currently approaching a key Demand Zone and is showing signs of a potential breakout.
Key Observations:
Demand Zone / Order Block:
The green zone (₹1,900–₹2,050) marks a significant demand area where price is expected to find strong buying support. This is aligned with the previous consolidation period and order block theory.
Price Retest:
The price is retesting this demand zone, creating a potential low-risk entry point for buyers.
Change of Character (CoCh):
A structural shift is evident, with a "W" pattern forming. This pattern indicates accumulation and potential reversal from bearish to bullish momentum.
RSI Divergence (1H Time Frame):
Bullish RSI divergence is visible in lower time frames, confirming weakening bearish momentum and possible price reversal.
Price Imbalance Filled:
The imbalance area has been fully resolved, reducing downward pressure. This increases the likelihood of a bounce from the demand zone.
Descending Channel:
The stock is currently trading within a descending channel. A breakout above the upper boundary of the channel could signal a continuation of the bullish move.
Projected Scenarios:
Bullish Scenario:
If the price holds the demand zone and breaks out above the descending channel, potential targets are:
Target 1 : ₹2,400 (near-term resistance).
Target 2 : ₹2,800 (upper trendline resistance).
Target 3 : ₹3,000+ (long-term resistance zone).
Bearish Scenario:
If the price fails to hold the demand zone, it could revisit the lower levels near ₹1,800 or ₹1,700 for another accumulation phase.
Trade Setup:
Entry : ₹1,950–₹2,050 (Demand Zone).
Stop-Loss : ₹1,890 (below the demand zone).
Targets:
T1: ₹2,400
T2: ₹2,800
T3: ₹3,000
Risk-Reward Ratio : 1:3 or better.
Confluence Factors:
Strong support at the demand zone.
Bullish RSI divergence in lower time frames.
Structural breakout potential (CoCh and "W" pattern).
Full price imbalance resolved, reducing selling pressure.

#APARINDSApar Industries has delivered a breakout from a strong resistance zone with a solid close above ₹10,950. The breakout is accompanied by decent volume, signaling strong buying interest. The price action demonstrates a robust uptrend, forming consistent higher highs and higher lows on the weekly chart.
Key highlights:
Breakout Confirmation: Price has decisively broken the resistance zone, marking the beginning of a potential new rally.
Relative Strength: Outperforming Nifty, indicating strong momentum and institutional interest in this stock.
Volume: Noticeable spike in volume during the breakout week, confirming buyer dominance.
Trading Plan:
Entry: Consider adding positions above the breakout level of ₹10,950.
Stop-loss: As per the level mentioned on the chart (adjust as per risk appetite).
Target: Medium-term target at ₹12,000–₹12,500 based on historical price projections.
Keep an eye on the volumes in the coming sessions and ensure the breakout sustains. Monitor broader market conditions for alignment with bullish momentum.

Nifty Intraday key levels for 23.12.24Hi,
* Nifty Intraday key levels for 23.12.24
* Please mark the levels in your chart and get prepared for tomorrow
* These Support and Resistance levels have good accuracy.
Resistance 23780 / 23830
Support 23530 / 23430
* Gap zone 24065 - 24150 will be acting as strong Resistance
* As we are at a strong buying zone, we might witness a strong pull back in coming week
* Below 23300 on daily closing basis, market will witness more weakness
Regards
Bull Man

max profit minimum time opportunity (value investing)Entry Price: The entry price should be between ₹3700 and ₹3900.
Target Price: ₹5910 (35% upside potential)
Sell Signal
between -10 and -15
Hold Signa
ranges between -10 and 10
Strong Buy Signal
exceeds 10
sector - gold and jewelry
NSE:SKYGOLD
:Sky Gold Limited is engaged in the business of designing, manufacturing, and marketing gold jewellery
:The company has reputed clients like Malabar Gold, Joyalukkas, Senco , Khazana Jewellers, Khimji, Kalyan Jewellers, GRT, Istaara etc.
The company's previous financial reports indicate continuous and strong sales growth
The quarter-on-quarter (QoQ) average sales growth in the last four quarter is 30%, while the year-on-year (YoY) average sales growth over the past two years stands at 46%. Additionally, the company has consistently improved its profit margins on a YoY basis.
The company's EPS has also shown remarkable growth alongside its profit and sales. In the financial year 2022-23E PS grew by 9%, followed by an impressive 76% growth in 2023-24. In the current financial year, EPS growth has reached 96%
peer base valuation
The company's P/B ratio appears undervalued compared to top peers. However, many of its peers are outperforming it in terms of P/B ratio performance.
The company's P/E ratio is significantly higher than the industry average but considerably lower compared to the major players in the industry.
Its EPS growth in the previous quarter has been the highest among its peers.
The company's sales growth is also the highest in the industry,
its EV/EBITDA is much lower than that of market leaders.
Additionally, the company's ROE is better than many peers in the industry, although it still lags behind the industry leader's ROE.
:share holding changes
The company's promoters have been continuously reducing their stake since the September quarter of the previous year. Their holding, which was 73.55% in September 2023, has dropped significantly to 58.24% by October 2024, which is a concerning trend.
On the other hand, FIIs, which held 0% in September 2023, have steadily increased their stake over the last four quarters to 1.38%. Additionally, DIIs have acquired a 6.31% stake in the recent period, indicating strong trust from major investors, which is a positive sign for the company.
estimate for q3
Recently, several news portals have reported that 46 lakh weddings are expected to take place in India during November and December. Given that gold accessories are heavily purchased during Indian weddings, the upcoming quarter could be highly favorable for the gold sector.
This presents a significant opportunity for the company to expand its market. However, it is important to note that the company primarily focuses on lightweight jewelry, while heavier jewelry is typically preferred for weddings.
That said, the company's B2B business model, which involves selling jewelry to stores and online platforms that further sell to end consumers, provides growth in this high-demand period.

Ethereum (ETH) Chart Analysis ### Chart Overview:
This **Ethereum (ETH) chart price action** on a 1-hour timeframe with Heikin Ashi candles. Various indicators, such as volume, MACD, RSI, and custom elements like support, resistance, and divergence patterns, are used to enhance the analysis. The chart highlights a **double-bottom pattern**, volume trends, and bullish divergence.
### Key Chart Features and Pattern Observation:
1. **Double Bottom Pattern**:
- The chart identifies two significant "bottoms" (marked as Bottom 1 and Bottom 2) at support levels.
- This is a bullish reversal pattern, suggesting potential upward momentum.
2. **Support and Resistance**:
- Key support levels are visible at **$3,501.00** and **$3,516.00**.
- Resistance levels include **$4,018.50** and the target price at **$4,096.00**.
3. **Heikin Ashi Candles**:
- The current candles show a bullish trend with consecutive green candles following Bottom 2.
4. **ATR Trailing Stops**:
- Suggestive of a breakout above previous consolidation, supported by bullish momentum.
### Indicator Analysis:
1. **Volume**:
- Volume spiked significantly near Bottom 1, indicating strong buying activity at lower levels.
- Gradual increase in green volume bars signals growing bullish interest.
2. **MACD**:
- The MACD line has crossed above the signal line (bullish crossover) near Bottom 2.
- Histogram bars transitioning from negative to positive territory confirm increasing bullish momentum.
3. **RSI**:
- RSI shows a **bullish divergence** near Bottom 2, with price creating a lower low while RSI forms a higher low.
- The RSI value at 77.89 suggests the asset is entering overbought territory, signaling caution for new entries.
### Key Levels or Price Levels:
- **Support Levels**:
- $3,501.00 (strong support).
- $3,516.00 (intermediate support).
- **Resistance Levels**:
- $3,748.15 (intermediate resistance).
- $4,018.50 (major resistance).
- $4,096.00 (target level).
### Overall Summary:
The chart displays a bullish reversal setup with the double bottom pattern, confirmed by increasing volume and positive momentum in the MACD and RSI indicators. Price action above the resistance zone indicates a potential continuation toward the target level. However, the RSI nearing overbought territory suggests monitoring for potential pullbacks.
### Recommendation or Trading Strategy:
1. **For Long Positions**:
- Enter above $3,748.15 with a target at $4,018.50 and $4,096.00.
- Place a stop-loss below $3,516.00 to protect against downside risk.
2. **For Short Positions** (if price fails to sustain above resistance):
- Consider entering near $4,018.50 with a target back to $3,748.15 or lower.
- Tight stop-loss above $4,096.00 to limit losses.
3. **Additional Notes**:
- Monitor volume for confirmation of breakout or reversal.
- Consider partial profit booking as the price approaches $4,018.50.
### Conclusion:
Ethereum shows strong bullish momentum with the double bottom pattern, bullish divergence, and positive indicator confirmations. While the trend favors further upside, overbought RSI conditions caution against overextending positions. Traders should align entries and exit with key levels while managing risk through disciplined stop-loss placement.

Technical Analysis of Nifty 50: Key Levels and Trend OutlookThe chart appears to be an hourly candlestick chart of the Nifty 50 index with key technical levels and zones annotated. Here's an analysis of the chart pattern:
1. **Seller’s Zone (Resistance):**
- The zone around 24,500 to 24,600 is marked as a resistance level.
- Price is currently testing this zone and has faced rejection, as indicated by the red candles forming near this area.
- If the price closes above 24,600, bullish activity could increase, as the resistance will have been broken.
2. **Nearest Support:**
- The support level is around 24,350. This level is critical for the price to maintain upward momentum.
- If this support is broken, the price might retrace further toward lower levels.
3. **Buyer’s Zone (Demand Zone):**
- The area around 23,900 has been marked as a buyer's zone, where strong buying interest was previously observed.
- Price bounced strongly from this zone, confirming its validity as a significant demand area.
4. **Key Support Levels:**
- S: Around 23,907 (Buyer’s Zone).
- S1: Around 23,335, which is likely a strong historical support level.
5. **RSI Analysis:**
- The RSI (14) is at 70.14, indicating that the index is near overbought territory.
- A reversal or consolidation might occur if the RSI crosses above 70 and begins to decline.
6. **Trend Observation:**
- The index appears to be in a recovery phase after a downtrend, as evidenced by higher highs and higher lows forming since the bounce from 23,907.
- A breakout above the seller’s zone could confirm a continuation of the upward trend.
### Conclusion:
- **Bullish Scenario:** If the price breaks and sustains above 24,600, the next target could be higher resistance zones.
- **Bearish Scenario:** If the price fails to hold the 24,350 support, it might retest the buyer’s zone around 23,907 or even lower to 23,335.
Further decisions should be made based on upcoming candlestick patterns and volume confirmations. Let me know if you'd like a more detailed breakdown!

MONTE CARLO FASHIONS Approaching Multi-Year Resistance The stock is nearing its multi-year resistance level around 950, which has acted as a major hurdle in the past. A decisive breakout above this level could open doors for a strong upward rally.RSI is at 69, indicating bullish momentum with room to push higher. Recent price action is supported by consistent volume, signaling strong buying interest.The long-term trendline support near ₹600 has provided a strong base for the uptrend. Sustained movement above 950 with rising volumes will confirm the breakout, potentially leading the stock toward 1100 levels.

AXISBANK Probable BreakoutStock Name: Axis Bank
CMP: ₹1160.50
Technical Analysis:
Axis Bank is currently displaying strong bullish momentum. The stock has achieved a breakout, with the previous close decisively above the trendline, confirming a significant bullish setup. This move is supported by high trading volumes, indicating strong participation from buyers.
Moreover the stock is in a strong buying position at the long tested support.

Riba Textiles Ltd. 95.81 [RIBATEX] – Cup and Handle Pattern (5 Y1. Pattern Overview
- Formation Details:
- The stock has developed a 5-year cup and handle pattern, a strong continuation formation indicating the potential for a bullish breakout.
- The cup portion reflects a gradual decline and recovery, showcasing accumulation over time.
- The handle portion is a short consolidation phase near the resistance, preparing for a breakout.
- The key resistance level is identified at ₹95, which aligns with the top of the pattern.
- Significance:
- This long-term cup and handle pattern is a highly reliable signal of bullish sentiment.
- A breakout above ₹95 signals the resumption of an uptrend, with strong momentum expected.
2. Volume Analysis
- Volume Trends:
- Volume shows increasing participation, especially during the recent rally toward the resistance zone.
- A breakout accompanied by a volume surge would confirm the bullish move.
- The accumulation phase within the handle is characterized by relatively lower volumes, which is typical in such patterns.
3. Key Levels
- Resistance Levels:
- ₹95: Critical breakout level. A sustained move above this will open the path for higher targets.
- ₹130: Projected target based on the height of the cup.
- Support Levels:
- ₹80: Immediate support level, which aligns with the lower boundary of the handle.
- ₹70: Secondary support, below which the bullish structure would be invalidated.
4. Price Target Calculation
- The height of the cup (₹130 - ₹70 = ₹60) is added to the breakout level (₹95):
- First Target: ₹130 (psychological resistance).
- Extended Target: ₹150 (potential follow-through after breakout).
5. Price Action Highlights
- Recent Price Movement:
- The stock is currently testing the critical ₹95 resistance, with bullish candlesticks indicating upward pressure.
- The gradual rise in lows during the handle formation supports the bullish bias.
- Candlestick Patterns:
- The formation of bullish engulfing candles near the ₹80 support indicates strong buying interest.
- A breakout candle above ₹95, preferably a bullish marubozu, would confirm the uptrend.
6. Trade Setup
- Breakout Trade:
- Entry: Above ₹95 on confirmed breakout with significant volume.
- Targets:
- Short-Term: ₹110
- Mid-Term: ₹130
- Extended Target: ₹150
- Stop Loss: ₹80 (below handle support) to minimize risk.
- Pullback Opportunity:
- If the price retests ₹95 after the breakout, it could provide a secondary entry point for traders.
#Trading #Investing #Stocks #TechnicalAnalysis

Swing This chart represents Kabra Extrusion Technik Ltd. on a weekly timeframe. Here's a brief analysis:
Trend Overview:
The stock was in a strong uptrend from early 2021 to mid-2022, reaching higher levels with increasing volume.
It then entered a consolidation phase with lower highs, forming a descending triangle-like pattern.
Key Levels:
Support level: Around ₹450 (black horizontal line), which the stock has respected multiple times during the consolidation phase.
Resistance level: Around ₹510-516, where it is currently trading after breaking out of the descending trendline (orange line).
Breakout:
The stock has shown a breakout above the descending trendline with a strong weekly close at ₹509.90, gaining 8.76% in this session. This indicates a potential trend reversal.
Volume Analysis:
Increased volume during the breakout suggests strong buying interest and the possibility of further upward momentum.
Outlook:
If the stock sustains above ₹510, it could aim for higher targets.
A retest of the ₹510 level is possible before moving upward.
Failure to sustain above ₹510 might see the stock pulling back towards ₹450 support.
This breakout aligns with a bullish scenario, provided the resistance is successfully converted into support.

Federal Bank Looking Very Strong- Keep In Radar📊 Federal Bank Ltd
✅ The stock has successfully broken above a descending trendline that has been acting as resistance for the past few months. This breakout, accompanied by increased volume indicates strong buying interest and a potential shift in trend direction.
✅The recent price move was supported by a notable surge in volume, further validating the breakout. High volume on the breakout suggests that institutional investors may be involved which adds strength to the upward momentum.
✅ Federal Bank has established a solid support base around the 182-184 level which has held up well over multiple testing points. This level now acts as a floor limiting downside risk and providing a robust foundation for the stock’s upward move.
✅The RSI currently stands at 70 signaling strong bullish momentum without yet entering the extreme overbought zone. This suggests the stock has further upside potential as momentum builds.
🚨With the trendline breakout and volume confirmation, Federal Bank could target 215 in the short term, with a potential extended move towards 225 if the momentum continues. These targets align with historical resistance zones, making them realistic profit-taking levels.
🚨 The 192 support serves as a logical stop-loss level, providing a cushion against a potential pullback while allowing room for the trade to mature. Any close below this level would indicate a weakening of the bullish setup signaling an exit.

Stock Analysis: JK Paper Ltd (Weekly Time Frame)Breakout with Retest:
1) All-Time High Breakout: JK Paper has recently broken out of its all-time high with significant volume on the weekly chart, suggesting strong bullish momentum.
2) Retest of Breakout Level: After the breakout, the stock came back to retest the previous high, which is a classic technical move. The retest was successful, and the stock has reversed from this level.
3) Marubozu Candle: A strong Marubozu candle has formed on the weekly time frame, confirming the reversal with good volume. This type of candle typically indicates strong buying pressure with no hesitation from sellers.
This setup suggests that JK Paper might continue its bullish momentum after the successful retest. Keep an eye on the stock's movement for a potential entry point.

JPPOWER - Risky - Triangle BO -Wkly- Near Multiyear BOJPPOWER -Risky bet -
The Jaiprakash Power Ventures Ltd. (JP Power) weekly chart shows significant bullish momentum after a prolonged period of accumulation. Here’s an analysis based on the chart you provided:
### 1. **Cup and Handle Formation**
- **Cup Formation (2017-2023)**: The chart clearly shows a large **cup pattern**, which is a bullish continuation pattern. It started forming around 2017 and completed in 2023. The depth of this cup indicates a long consolidation phase, with strong accumulation at lower levels.
- **Breakout**: JP Power broke out of the cup’s resistance around the ₹10.71 level, leading to a sharp upward move.
### 2. **Handle and Continuation**
- The handle formation was brief and followed by another breakout, confirming the strength of the pattern. The breakout from the handle shows increasing volumes, a strong bullish sign.
### 3. **Current Consolidation in Triangle**
- After the breakout, the stock is currently consolidating in a symmetrical **triangle pattern** between ₹16.63 and ₹23.78.
- **Support**: The lower bound of this triangle is around ₹16.63, which also coincides with a previous resistance level.
- **Resistance**: The upper bound of the triangle is near ₹23.78, which could act as the next resistance zone.
- A breakout above ₹23.78 could lead to a continuation of the bullish trend, possibly taking the stock higher.
### 4. **RSI and Momentum**
- The **RSI** (Relative Strength Index) at the bottom of the chart is hovering in the bullish range (above 50), but not yet in overbought territory. This indicates the stock still has room for upward movement.
- The recent bounce in RSI suggests that buyers are stepping in to support the stock at current levels.
### 5. **Volume Analysis**
- There is a noticeable increase in **volume** during the breakout phases, which indicates strong buying interest. The volume spikes during the key breakout confirm the strength of the move.
### 6. **Targets and Projections**
- The measured move from the **cup and handle** pattern, calculated from the depth of the cup (approximately ₹10.71), projects a potential upside target around ₹31.80 in the longer term, which aligns with a previous high seen in 2015.
- Near-term resistance levels could be ₹23.78 and ₹31.80 if the triangle breaks to the upside.
- Support levels: If the triangle breaks down, the stock might find support around ₹16.63 or even as low as ₹11.00.
### Conclusion:
- **Bullish Outlook**: The chart shows a long-term bullish trend, especially after the breakout from the cup and handle pattern. However, the stock is currently in a consolidation phase and traders should watch for a breakout above ₹23.78 for further bullish confirmation.
- **Risk Management**: Key support levels to monitor are ₹16.63 and ₹11.00 in case of any pullbacks.

Strong Breakout From Hindalco, Keep In RadarHindalco is showing strong bullish momentum as it approaches the key resistance level around 720. The stock is trading above both the 100 and 200 EMAs, indicating sustained bullish sentiment. A breakout above this resistance could lead to further upward movement. Volume has significantly increased, suggesting strong buying interest. Traders should look for a close above 720 for a potential rally towards 830 and beyond.
