Nifty Bank trend and Levels expecting on 18-01-22 trading dayHi,
The Following points may help full to Nifty -50 & Bank nifty FN&O and Option traders – Good Luck.
Nifty-50 trend indicators in last session Strong Buy in Weekly , Strong Buy in Daily and Strong Buy in 15mint charts.
Bank nifty trend indicators in last session Strong Buy in Weekly , Strong Buy in Daily and Strong Buy in 15mint charts.
World market trend indicators – US – Strong Sell & Neutral & Europe Strong Sell & Neutral in Hr. Chart.
Asian market Trend Indicators – Nikkei – Neutral , Hang Seng - Neutral & KOSPI - Strong Sell in Hr. Chart.
FII – Sold 1598.2Cr . in cash , Sold 625.61Cr. in Index Future & Bought 5358.5Cr in Index Option on 14-01-22.
DII- Bought 371.41 Cr. on 14-01-22
Nifty50 Future – Open @ -45.25 point Lower i.e. Gap down and @7.35 AM today trading -22.5 points .It seam getting recover. Trend Indicators- Strong Sell in Hr. Chart .
SGX – Open @ -83 point Lower i.e. Gap down and @ 7.35 AM today trading -69.5 points . It seam getting recover. Trend Indicators -Strong Sell in Hr. Chart.
The market may open Negative or Flat and according to sustains of support or resistance levels as mentioned in Chart above FIBONACCI RETRACMENT FOR NEAR AND SHORT TERM & PIVOT TABLE for Nifty and Bank Nifty
Search in ideas for "STRONG BUY"

Nifty -50 trend and Levels expecting on 18-01-22 trading dayHi,
The Following points may help full to Nifty -50 & Bank nifty FN&O and Option traders – Good Luck.
Nifty-50 trend indicators in last session Strong Buy in Weekly , Strong Buy in Daily and Strong Buy in 15mint charts.
Bank nifty trend indicators in last session Strong Buy in Weekly , Strong Buy in Daily and Strong Buy in 15mint charts.
World market trend indicators – US – Strong Sell & Neutral & Europe Strong Sell & Neutral in Hr. Chart.
Asian market Trend Indicators – Nikkei – Neutral , Hang Seng - Neutral & KOSPI - Strong Sell in Hr. Chart.
FII – Sold 1598.2Cr . in cash , Sold 625.61Cr. in Index Future & Bought 5358.5Cr in Index Option on 14-01-22.
DII- Bought 371.41 Cr. on 14-01-22
Nifty50 Future – Open @ -45.25 point Lower i.e. Gap down and @7.35 AM today trading -22.5 points .It seam getting recover. Trend Indicators- Strong Sell in Hr. Chart .
SGX – Open @ -83 point Lower i.e. Gap down and @ 7.35 AM today trading -69.5 points . It seam getting recover. Trend Indicators -Strong Sell in Hr. Chart.
The market may open Negative or Flat and according to sustains of support or resistance levels as mentioned in Chart above FIBONACCI RETRACMENT FOR NEAR AND SHORT TERM & PIVOT TABLE for Nifty , Bank Nifty and reliance Industries .

Bank Nifty trend and Levels expecting on 14-01-22 trading dayThe Following points may help full to Nifty -50 & Bank nifty FN&O and Option traders – Good Luck
Nifty-50 trend indicators in last session Strong Buy in Weekly , Strong Buy in Daily and Strong Buy in 15mint charts.
Bank nifty trend indicators in last session Strong Buy in Weekly , Strong Buy in Daily and Neutral in 15mint charts.
World market trend indicators – US – Sell & Europe Strong Buy in Hr. Chart
Asian market Trend Indicators – Nikkei - Strong Sell, Hang Seng - Neutral & KOSPI - Strong Sell in Hr. Chart
FII – Sold 1390.85Cr . in cash , Bought 1472.58Cr. in Index Future & Bought 4905.98Cr in Index Option on 13-01-22
DII- Bought 1065.32 Cr. on 13-01-22
Nifty50 Future – Open @ -65.25 point Lower i.e. Gap down and @8.15 AM today trading down trend -97 points . Trend Indicators- Strong Sell in Hr. Chart
SGX – Open @ 4.5 Points Higher i.e. Flat and @ 8.15 AM today trading down trend -64 points . Trend Strong Sell in Hr. Chart
The market may open Negative or gap down and according to sustains of support or resistance levels as mentioned in Chart above

Nifty -50 trend and Levels expecting on 14-01-22 trading dayHi,
The Following points may help full to Nifty -50 & Bank nifty FN&O and Option traders – Good Luck
Nifty-50 trend indicators in last session Strong Buy in Weekly , Strong Buy in Daily and Strong Buy in 15mint charts.
Bank nifty trend indicators in last session Strong Buy in Weekly , Strong Buy in Daily and Neutral in 15mint charts.
World market trend indicators – US – Sell & Europe Strong Buy in Hr. Chart
Asian market Trend Indicators – Nikkei - Strong Sell, Hang Seng - Neutral & KOSPI - Strong Sell in Hr. Chart
FII – Sold 1390.85Cr . in cash , Bought 1472.58Cr. in Index Future & Bought 4905.98Cr in Index Option on 13-01-22
DII- Bought 1065.32 Cr. on 13-01-22
Nifty50 Future – Open @ -65.25 point Lower i.e. Gap down and @8.15 AM today trading down trend -97 points . Trend Indicators- Strong Sell in Hr. Chart
SGX – Open @ 4.5 Points Higher i.e. Flat and @ 8.15 AM today trading down trend -64 points . Trend Strong Sell in Hr. Chart
The market may open Negative or gap down and according to sustains of support or resistance levels as mentioned in Chart above

Bank Nifty trend and Levels expecting on 11-01-22 trading dayHi,
The Following points may help full to Bank Nifty Option traders – Good Luck
Nifty-50 trend end in last session Strong Buy in Weekly , Strong Buy in Daily and Strong Buy in 15mint charts.
World market Trend Indicators – US – Neutral & Europe - Strong Sell
Asian market Trend Indicators – Nikkei –Strong Sell , Hang Seng -Buy & KOSPI - Strong Sell
FII – Sold 124.23 Cr . in cash , – Sold 538.61 Cr in Index Future & in Index Option Bought 2242.05Cr on 10-01-22
DII- Bought 481.55 Cr. on 10-01-22
SGX – Open @ +9.5 Points Higher i.e Flat and current movement of trading is down wards. Trend Indicators-Strong Buy
Nifty50 Future – Open @ +35 point Higher i.e gap up and current movement of trading is down wards. Trend Indicators- Strong Buy
The market may open flat or gap down and according to sustains of support or resistance levels as bellow mentioned in above FIBONACCI RETRACMENT FOR NEAR AND SHORT TERM & PIVOT TABLE for Nifty , Bank Nifty and reliance Industries .
SGX & Nifty 50 future indicate very cautious trading day today.

Nifty -50 trend and Levels expecting on 11-01-22 trading dayHi,
The Following points may help full to Nifty -50 Option traders – Good Luck
Nifty-50 trend end in last session Strong Buy in Weekly , Strong Buy in Daily and Strong Buy in 15mint charts.
World market Trend Indicators – US – Neutral & Europe - Strong Sell
Asian market Trend Indicators – Nikkei –Strong Sell , Hang Seng -Buy & KOSPI - Strong Sell
FII – Sold 124.23 Cr . in cash , – Sold 538.61 Cr in Index Future & in Index Option Bought 2242.05Cr on 10-01-22
DII- Bought 481.55 Cr. on 10-01-22
SGX – Open @ +9.5 Points Higher i.e Flat and current movement of trading is down wards. Trend Indicators-Strong Buy
Nifty50 Future – Open @ +35 point Higher i.e gap up and current movement of trading is down wards. Trend Indicators- Strong Buy
The market may open flat or gap down and according to sustains of support or resistance levels as bellow mentioned in above FIBONACCI RETRACMENT FOR NEAR AND SHORT TERM & PIVOT TABLE for Nifty , Bank Nifty and reliance Industries .
SGX & Nifty 50 future indicate very cautious trading day today.

Nifty -50 trend and Levels expecting on 10-01-22 trading dayHi,
The Following points may help full to Nifty -50 Option traders – Good Luck
Nifty-50 trend end in last session Strong Buy in Weekly , Strong Buy in Daily and Strong Buy in 15mint charts.
World market Trend Indicators – US – Strong Sell & Europe - Mixture
Asian market Trend Indicators – Nikkei –Strong Sell , Hang Seng - Strong Buy & KOSPI Strong Sell
FII –Bought 496.27 Cr . in cash , Bought 578.5 Cr in Index Future & in Index Option Sold -4633.21Cr on 07-01-22
DII- sold 115.66 Cr. on 07-01-22
SGX – Open @ +53 Points Higher i.e Gap up and current movement of trading is Up wards. Trend Indicators-Strong Buy
Nifty50 Future – Open @ +13.5 point Higher i.e Flat and current movement of trading is up wards. Trend Indicators- Strong Buy
The market may open flat or gap up and according to sustains of support or resistance levels as bellow mentioned in Chart.

Nifty -50 trend and Levels expected on 04-01-22 trading Hi,
The Following points may help full to Nifty -50 Option traders – Good Luck
Nifty-50 trend end in last session Strong Buy in Weekly , Strong Buy in Daily and Strong Buy in 15mint charts.
World market Trends – US – Strong Buy & Europe - Strong Buy
Asian market Trends – Nikkei - Strong Buy , Hang Seng - Strong Buy & KOSPI - Strong Sell
FII -Bought 902.64 Cr . in cash , Bought 661.88 Cr in Index Future & in Index Option Sold -1186.3 Cr on 03-01-22
DII- Bought 803.11Cr. on 03-01-22
SGX – Open flat and currently trading flat no movement
Nifty50 Future – Open flat and currently trading flat no movement
The market may open flat and according to sustains of support or resistance levels as bellow mentioned chart.

solarindsLet's analyze **Solar Industries India Ltd. (SolarInds)** from both a **fundamental** and **technical** perspective.
### **Fundamental Analysis of Solar Industries India Ltd. (SolarInds)**
#### **Overview of Solar Industries India Ltd.**
- **Sector:** Chemicals, Industrials
- **Industry:** Explosives, Defense & Aerospace, and Industrial Products
- **Founded:** 1995
- **Headquarters:** Nagpur, Maharashtra, India
- **Market Cap:** Approx. ₹40,000 crore (as per the latest data)
**Solar Industries India Ltd.** is a leading manufacturer of **industrial explosives** and related products. The company is one of the largest producers of explosives in India and has a diverse portfolio that includes products used in **mining**, **construction**, **defense**, and **aerospace** industries. The company also specializes in providing **explosive solutions** for various commercial and military applications.
Key areas of Solar’s operations include:
- **Industrial Explosives:** Solar produces a wide range of explosives for mining, quarries, and construction.
- **Defense:** The company provides solutions for the defense sector, including ammunition and explosive devices.
- **Aerospace & Other:** Solar manufactures various products for the aerospace and defense sectors, such as high-grade explosives and related services.
#### **Key Financials (Latest Report)**
- **Revenue Growth:** Solar Industries has consistently shown strong revenue growth due to its diversified customer base in industries like mining, infrastructure, and defense. Demand for industrial explosives in infrastructure projects and mining has been a significant growth driver.
- **Profitability:** Solar's profitability is solid, driven by strong margins in its high-demand products. The company benefits from its leadership in the industrial explosives sector and has a strong track record of generating healthy profits.
- **Debt Levels:** The company maintains a relatively low level of debt, allowing it to fund its growth and expansion without significant interest burden. Its ability to generate strong operational cash flow supports its debt servicing.
- **Cash Flow & Dividend Yield:** Solar has a strong cash flow from operations, which allows it to reinvest in growth while also rewarding shareholders with consistent dividend payouts.
#### **Valuation Ratios**
- **P/E Ratio:** Solar’s P/E ratio is generally higher than the broader market due to its leadership position in the explosives and defense sectors. This can reflect the market’s expectation of continued growth and profitability.
- **P/B Ratio:** The P/B ratio of Solar is relatively high, indicating that the market values its equity significantly due to its strong asset base and profitability.
- **Dividend Yield:** Solar has a healthy dividend payout ratio, providing attractive dividends for long-term investors.
#### **Industry & Macro Trends**
- **Infrastructure & Mining Demand:** The demand for explosives in mining and infrastructure is strong, particularly in India, which has seen increased investments in infrastructure development, mining, and construction projects.
- **Defense Spending:** Solar’s defense segment benefits from growing defense budgets, both in India and internationally. With increased defense spending in India, Solar is well-positioned to expand its presence in the sector.
- **Government Initiatives:** The government’s push for infrastructure development, especially in roads, railways, and mining, supports long-term demand for Solar's explosives.
- **Regulations & Safety Standards:** As a manufacturer of explosives, Solar is highly regulated. Changes in regulations or safety standards could impact operations and increase compliance costs.
---
### **Technical Analysis of Solar Industries India Ltd. (SolarInds)**
Let’s evaluate the **technical outlook** of Solar Industries based on its price action, key levels, moving averages, and momentum indicators.
#### **Price Action:**
- **Current Price:** Solar Industries has demonstrated strong upward momentum over the years, benefiting from steady demand in its industrial explosives and defense sectors.
#### **Key Levels:**
- **Support Levels:**
- **₹3,200-₹3,300:** This support range has been tested multiple times in the past. A move below this support could suggest further downside potential.
- **₹2,900-₹3,000:** If the stock faces a significant pullback, this is another key support level to monitor.
- **Resistance Levels:**
- **₹3,600-₹3,700:** This level has historically acted as a strong resistance zone. A breakout above this level would signal a bullish trend, potentially leading to further upside.
- **₹3,800:** This is a psychological resistance level, and a breakout above ₹3,800 could lead to a more significant upward momentum in the stock.
#### **Moving Averages:**
- **50-Day Moving Average (50-MA):** If Solar is trading above its 50-day moving average, it suggests short-term bullishness. A price drop below this level could indicate weakening momentum.
- **200-Day Moving Average (200-MA):** The 200-day moving average is a strong indicator of long-term trends. A stock trading above this level signals that the long-term trend remains bullish.
#### **Momentum Indicators:**
- **RSI (Relative Strength Index):**
- An RSI above 70 indicates that the stock could be overbought, and a pullback might be on the horizon.
- An RSI below 30 suggests that Solar Industries might be oversold, signaling a potential buying opportunity if other indicators support it.
- **MACD (Moving Average Convergence Divergence):**
- A positive MACD crossover (when the MACD line crosses above the signal line) would suggest strong bullish momentum.
- A negative MACD crossover could indicate weakening momentum or the potential for a bearish reversal.
#### **Volume Analysis:**
- **Volume Trends:** Rising volume alongside price increases signals strong buying interest, supporting the bullish trend. Conversely, volume spikes during price declines can indicate strong selling pressure.
- **Volume Spikes:** Pay attention to volume spikes near key levels such as ₹3,600-₹3,700 or ₹3,800. A breakout or breakdown accompanied by significant volume could confirm the direction of the next trend.
---
### **Conclusion:**
- **Fundamental Strengths:**
- Solar Industries has a strong foothold in the **industrial explosives** and **defense sectors**, which are expected to continue growing, driven by infrastructure projects and defense spending.
- The company’s financial health, characterized by consistent revenue growth, low debt levels, and strong profitability, supports its long-term potential.
- Government policies promoting infrastructure development and defense spending are favorable for Solar’s business outlook.
- **Technical Outlook:**
- **Support levels:** ₹3,200-₹3,300 (primary), ₹2,900-₹3,000 (secondary).
- **Resistance levels:** ₹3,600-₹3,700 (primary), ₹3,800 (psychological resistance).
- The stock is likely to continue benefiting from strong demand in its key sectors, and a breakout above resistance levels could lead to further upside momentum.
#### **Risks to Consider:**
- **Commodity Price Fluctuations:** Changes in the prices of raw materials (such as chemicals and energy) used in the production of explosives could impact margins.
- **Regulatory Risks:** Stringent safety regulations and compliance requirements for the explosives industry could impact operations and cost structures.
- **Defense and Global Competition:** While Solar enjoys a strong position in the defense sector, it faces competition from both domestic and international players.
---
**Disclaimer:**
The information provided is for educational purposes only and should not be construed as financial or investment advice. I am not a SEBI-registered advisor, and this analysis is not a recommendation to buy, sell, or hold any securities. Accuracy and timeliness of the data cannot be guaranteed. Always conduct your own research or consult with a professional before making investment decisions. I do not take responsibility for any losses incurred.

EpackLet's analyze **Epack Polymers Ltd. (EPACK)** from both a **fundamental** and **technical** perspective.
### **Fundamental Analysis of Epack Polymers Ltd. (EPACK)**
#### **Overview of Epack Polymers Ltd.**
- **Sector:** Materials, Plastics
- **Industry:** Packaging, Polymers & Plastic Products
- **Founded:** 2006
- **Headquarters:** Delhi, India
- **Market Cap:** Approx. ₹500-600 crore (as per the latest data)
**Epack Polymers Ltd.** is a company primarily engaged in the **manufacturing of polymer products**, particularly **polyethylene films** and **flexible packaging materials**. The company caters to a variety of industries, including **food packaging, pharmaceuticals, retail, agriculture**, and **consumer goods**. Epack’s product portfolio includes **laminated films, pouches, and rolls** used extensively in the packaging sector.
Key areas of Epack’s operations include:
- **Flexible Packaging:** The company provides a wide range of packaging solutions for food, beverages, and other consumer goods.
- **Custom Packaging Solutions:** Epack manufactures packaging products tailored to specific industry needs, such as pharmaceuticals, dairy, and personal care.
- **Sustainability Focus:** The company is gradually integrating sustainable practices in its operations, including eco-friendly packaging solutions.
#### **Key Financials (Latest Report)**
- **Revenue Growth:** Epack has demonstrated steady revenue growth over the years, driven by the demand for packaging products in India, especially in sectors such as food, pharmaceuticals, and agriculture.
- **Profitability:** The company maintains healthy profit margins in the packaging industry, although it faces some pressure due to fluctuating raw material costs, such as the prices of polyethylene and other polymers.
- **Debt Levels:** Epack’s debt levels are generally moderate, with manageable leverage in relation to its earnings and cash flows. The company focuses on maintaining operational efficiency.
- **Cash Flow & Dividend Yield:** The company has been able to generate strong operational cash flows, which it reinvests into expanding production capacity and improving infrastructure.
#### **Valuation Ratios**
- **P/E Ratio:** Epack’s price-to-earnings (P/E) ratio may be on the higher side, reflecting growth expectations in the packaging sector. However, it’s important to compare this ratio with other companies in the packaging industry to determine if it’s overvalued or fairly priced.
- **P/B Ratio:** The P/B ratio is relatively moderate, indicating that the stock is reasonably priced in terms of book value, although it can vary depending on market sentiment.
- **Dividend Yield:** Epack is focused on growth, and while it does not have a high dividend yield, it is investing its earnings into capacity expansion and infrastructure.
#### **Industry & Macro Trends**
- **Packaging Demand:** The packaging industry in India is expected to grow rapidly, driven by increasing consumer demand in retail, food & beverages, and pharmaceutical sectors. Epack is well-positioned to capture this growth due to its diverse product offerings.
- **Sustainability Trends:** With the rising global focus on environmental sustainability, companies in the packaging industry, including Epack, are transitioning toward more eco-friendly packaging solutions. This could present both challenges and opportunities as the industry evolves.
- **Regulations:** The Indian government’s focus on packaging waste and regulations around plastic usage may impact the company’s operations. However, as the company adapts to environmental concerns by shifting toward sustainable solutions, it may continue to tap into the growing demand for green products.
- **Raw Material Prices:** The prices of polymers, including polyethylene, are volatile and can impact margins. Any fluctuations in crude oil prices can affect raw material costs, which would impact profitability.
---
### **Technical Analysis of Epack Polymers Ltd. (EPACK)**
Now, let's look at the **technical outlook** for Epack Polymers Ltd. (EPACK), analyzing key support and resistance levels, moving averages, and momentum indicators.
#### **Price Action:**
- **Current Price:** Epack has shown a positive price trend in recent times, benefiting from increased demand in the packaging sector, especially in the food and pharmaceutical segments.
#### **Key Levels:**
- **Support Levels:**
- **₹170-₹175:** This level has acted as a key support area for Epack in the past. A pullback toward this range could present a potential buying opportunity if the stock shows signs of stabilization.
- **₹160:** This is another key support level, which could act as a fallback in case of a more significant correction.
- **Resistance Levels:**
- **₹200-₹210:** The stock has faced resistance near this level in recent trading. A break above this resistance with strong volume could signal a potential upward trend.
- **₹220:** This level marks a strong resistance and psychological barrier for the stock, above which there could be further bullish momentum.
#### **Moving Averages:**
- **50-Day Moving Average (50-MA):** If Epack is trading above its 50-day moving average, this indicates short-term bullish momentum. A cross below this moving average could suggest weakening trend and bearish sentiment.
- **200-Day Moving Average (200-MA):** The 200-day moving average is a critical indicator for long-term trends. A stock trading above the 200-day MA signals that the broader trend is bullish. However, if it starts trading below this level, it may indicate a shift in trend.
#### **Momentum Indicators:**
- **RSI (Relative Strength Index):**
- If RSI is above 70, the stock may be in an overbought territory, signaling a potential pullback.
- If RSI is below 30, it indicates the stock might be oversold, suggesting that a reversal could be coming.
- **MACD (Moving Average Convergence Divergence):**
- A **bullish MACD crossover** (when the MACD line crosses above the signal line) could signal strong buying momentum.
- A **bearish MACD crossover** (when the MACD line crosses below the signal line) would indicate weakening momentum, signaling potential downside risk.
#### **Volume Analysis:**
- **Volume Trends:** Increasing volume alongside upward price movements generally confirms the strength of the trend. If the stock faces resistance with high volume, it suggests that the selling pressure may overcome the buying pressure.
- **Volume Spikes:** Pay attention to volume spikes near key resistance levels like ₹200-₹210 or ₹220, as these could indicate either strong buying momentum or the beginning of a trend reversal.
---
### **Conclusion:**
- **Fundamental Strengths:**
- **Epack Polymers Ltd.** has a strong position in the **flexible packaging** industry, benefiting from consistent demand in food, pharmaceuticals, and consumer goods sectors.
- The company has demonstrated steady revenue growth and maintains strong profitability, with a focus on reinvesting in growth and capacity expansion.
- While the packaging sector faces challenges related to raw material price fluctuations and sustainability trends, Epack is adapting to these changes by incorporating eco-friendly packaging solutions.
- **Technical Outlook:**
- **Support levels:** ₹170-₹175 (primary), ₹160 (secondary).
- **Resistance levels:** ₹200-₹210 (primary), ₹220 (psychological resistance).
- The stock is likely to continue benefiting from demand in the packaging sector, and a breakout above resistance levels could signal a further bullish trend.
#### **Risks to Consider:**
- **Raw Material Price Fluctuations:** The cost of polyethylene and other polymers is volatile, and sudden increases could squeeze margins.
- **Regulatory Risks:** Changes in government policies regarding packaging, plastic use, and environmental regulations could impact Epack’s operations and product offerings.
- **Market Competition:** The packaging industry is highly competitive, with several established players vying for market share. Epack must continue innovating and adapting to industry trends to maintain its growth trajectory.
---
**Disclaimer:**
The information provided is for educational purposes only and should not be construed as financial or investment advice. I am not a SEBI-registered advisor, and this analysis is not a recommendation to buy, sell, or hold any securities. Accuracy and timeliness of the data cannot be guaranteed. Always conduct your own research or consult with a professional before making investment decisions. I do not take responsibility for any losses incurred.

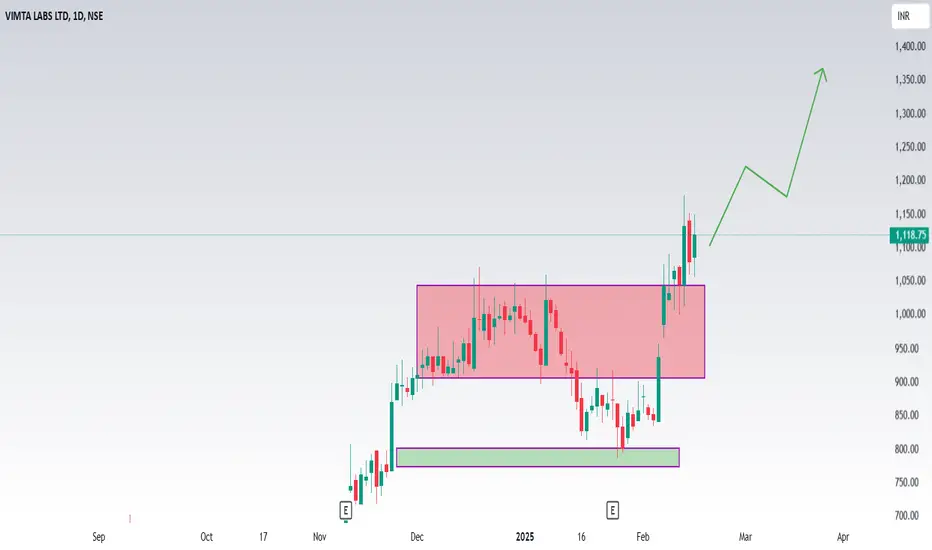
Vimta labs ltdShould I buy VIMTA LABS LTD stock? Our technical rating for VIMTA LABS LTD is buy today. Note that market conditions change all the time — according to our 1 week rating the strong buy trend is prevailing, and 1 month rating shows the strong buy signal.
Vimta Labs Ltd. (NSE: VIMTALABS) is currently exhibiting a strong bullish trend, as indicated by various technical analysis indicators.
**Technical Indicators:**
- **Moving Averages:** All moving averages (5, 10, 20, 50, 100, and 200 periods) are signaling a 'Buy' or 'Strong Buy' position, suggesting sustained upward momentum. citeturn0search2
- **Relative Strength Index (RSI):** The 14-day RSI stands at 89.33, indicating that the stock is in the overbought territory. While this suggests strong momentum, it also implies a potential for price correction. citeturn0search2
- **MACD (Moving Average Convergence Divergence):** The MACD is above the signal line, reinforcing the bullish trend. citeturn0search2
- **Stochastic Oscillator:** The Stochastic Oscillator is in the overbought zone, which may indicate a potential for price pullback. citeturn0search2
**Support and Resistance Levels:**
- **Support:** The stock has support at ₹560. citeturn0search3
- **Resistance:** The resistance level is at ₹1,020. citeturn0search3
**Volume Analysis:**
The stock has experienced high trading volumes at price peaks and lower volumes at price troughs, indicating that price movements are supported by significant trading activity. citeturn0search3
**Conclusion:**
While Vimta Labs Ltd. is currently in a strong bullish phase, the overbought conditions suggested by the RSI and Stochastic Oscillator warrant caution. Investors should monitor these indicators closely, as a price correction could occur if the stock remains in the overbought zone. It's advisable to consider these technical factors alongside fundamental analysis and broader market conditions when making investment decisions.
TRITURBINE: A Technical Breakout Backed by Strong FundamentalsTriveni Turbine Ltd.
Stock Symbol: NSE:TRITURBINE
Market Cap: INR 23,700 crore
Buy Range: INR 767-805
Current Price: INR 795.80 (as of October 13, 2024)
Introduction
Triveni Turbine Ltd., a leading player in the industrial steam turbine market, is positioned for significant growth due to its robust order book, growing presence in international markets, and strong financial performance. Coupled with a recent technical breakout on the charts, this stock is showing promising signs for investors and traders alike.
In this article, I will analyze both the technical setup and the fundamental strengths that make Triveni Turbine a stock worth watching.
Technical Analysis
The recent price action of Triveni Turbine showcases a bullish breakout from a well-defined consolidation phase. Let’s dive deeper into the technical indicators driving this breakout.
Consolidation Phase : Over the past few months, Triveni Turbine had been trading within a narrow range, oscillating between INR 670 and INR 750. The stock formed a descending trendline that acted as resistance, suppressing any potential price rise. Such consolidations often lead to strong price movements, depending on which way the breakout occurs.
Breakout: On October 11, 2024, the stock decisively broke above the trendline resistance, hitting a new high of INR 805, closing at INR 795.80—an impressive +6.88% gain for the day. Breakouts from consolidation phases like this often indicate that a new uptrend may be forming, with more upside potential.
Volume Spike : A key confirmation of this breakout is the noticeable spike in volume. The breakout occurred on significantly higher-than-average volume, signaling strong buying interest. A volume increase typically accompanies strong breakouts, suggesting the move is backed by institutional or large-scale buying.
Support and Resistance: Post-breakout, immediate support is established around INR 750-770, where the stock had previously struggled to move past. The next resistance zone lies around INR 840, which would be a key level to watch in the short to medium term.
Technical Indicators : The 50-day moving average (MA) is trending upwards, further supporting the bullish momentum. The stock is currently trading above its MA, adding to the strength of the ongoing price trend.
In conclusion, the breakout from consolidation, supported by rising volume and positive technical indicators, suggests further upside potential for Triveni Turbine.
Fundamental Analysis
Now, let’s turn to the fundamentals, which further bolster the case for Triveni Turbine’s potential for sustained growth.
Industry Leader in Steam Turbines: Triveni Turbine holds a dominant market share of over 60% in India’s industrial steam turbine market. Its steam turbines, used across more than 20 industries and installed in over 75 countries, make it a global leader in the space. Industries like sugar, steel, cement, chemicals, and waste-to-energy systems all benefit from its innovative turbine solutions, especially as demand for decentralized power generation grows.
Record-Breaking Financial Performance: In Q1 FY25, the company posted its highest-ever quarterly revenue and EBITDA. Notably, the EBITDA margin expanded by 240 basis points year-over-year, showcasing significant operational improvements. This robust performance sets a strong foundation for continued financial success in the coming quarters.
Impressive Order Book: Triveni Turbine’s order book stands at an impressive INR 1,600 crore, offering strong visibility for revenue well into FY26. The company's quarterly order bookings surged by 40% year-on-year, with exports accounting for a substantial 66% of the total. The company's increasing focus on international markets offers immense growth potential, while the domestic market remains poised for recovery in the coming quarters.
Aftermarket and Refurbishment Services: One of the standout growth areas for Triveni Turbine is its aftermarket and refurbishment services. This segment has seen notable growth in revenue share and operates at higher margins compared to its core product sales. With the ability to service and upgrade turbines from other OEMs, Triveni Turbine is uniquely positioned to capitalize on long-term customer relationships and expand its presence in this high-margin segment.
Focus on Renewable Energy: As industries and governments globally push for renewable energy solutions, Triveni Turbine’s expertise in waste heat recovery and waste-to-energy systems gives it a competitive edge. The growing demand for renewable energy solutions and decentralized power generation will further enhance the company’s growth prospects in the future.
Growth Catalysts
Several factors make Triveni Turbine a compelling growth story:
Rising global demand for decentralized steam power systems.
Strong export performance, with 66% of orders coming from international markets.
Expanding margins from high-margin services like aftermarket and refurbishment.
Leadership in renewable energy applications, particularly in waste-to-energy and heat recovery systems.
Risks to Consider
While Triveni Turbine is fundamentally strong and the technical chart signals bullish momentum, there are some risks to be aware of:
The subdued domestic performance in Q1 FY25 due to the election cycle. However, this is expected to recover in the coming quarters.
Currency fluctuations may impact export margins, as a significant portion of revenue is generated from international markets.
Conclusion
With both strong technicals and robust fundamentals, Triveni Turbine Ltd. presents a compelling opportunity for both traders and long-term investors. The recent breakout on the chart, combined with the company’s strong order book, growing international presence, and focus on high-margin services, make this stock a strong contender for future gains.
However, as always, investors should exercise caution and consider their risk tolerance before making any investment decisions. Given the breakout, the stock is now trading within the buy range of INR 767-805. Those looking to enter should watch for potential pullbacks to the support zone around INR 750 or look for continued strength above INR 805.
Disclaimer: This post is for informational purposes only and should not be considered as investment advice. Please conduct your own research or consult a financial advisor before making investment decisions.

NIFTY : The tentative stage of a market melt-up stage in PROB#2NIFTY Projection Case Study:
Probability #2
Target Levels & Tentative Timings are marked in chart
In order to navigate the current market uncertainties effectively, it is crucial to grasp the specific stage of the market melt-up. Recognizing whether the market is in the early uptrend, an acceleration phase, or exhibiting signs of overbought conditions provides valuable insights for strategic decision-making. Acknowledging the risks associated with melt-ups, such as overvaluation and herding behavior, enables us to implement sound risk management practices. Similarly, being attuned to the potential dangers of a market melt-down, including fast declines and panic selling, empowers us to make informed decisions in this dynamic and ever-changing market environment.
A market melt-up typically occurs during the late stages of a bull market when investors rush to buy stocks, driving prices sharply higher. It is characterized by a sudden and intense upward momentum fueled by FOMO (fear of missing out). Melt-ups often precede market corrections or downturns, so caution is advised when witnessing extreme bullish behavior.
The exact timing of a market melt-up in NIFTY happened between 2003 to 2008. The rapid and excessive increase in asset prices driven by speculative buying and fear of missing out resulted in the 2008 financial crisis was marked by a severe downturn, triggered primarily by the collapse of the subprime mortgage market in the United States.
The duration of a melt-up can vary, and there is no fixed timeline for how long it lasts. Melt-ups are characterized by a rapid and intense upward movement in prices, often driven by speculative and fear-of-missing-out (FOMO) behavior among investors. The duration can be influenced by various technical factors, including market conditions, economic indicators, and global events.
In some cases, a melt-up can be relatively short-lived, with prices soaring over a few weeks or months before experiencing a correction. However, in other instances, a melt-up might extend for a more prolonged period if the speculative frenzy and optimistic sentiment persist even for several months or even years.
It's important to note that while melt-ups can result in significant gains, they often precede market corrections or downturns. Investors & traders should exercise caution and be aware of the potential risks associated with the unsustainable nature of extreme upward movements in asset prices. Monitoring market conditions using potential technical indicators and navigating using geometric analysis can help traders & investors make well-informed decisions during such periods.
In technical analysis, a melt-up is often characterized by rapid and aggressive upward price movements. Here are some technical indicators and patterns that might be associated with a typical melt-up:
Sharp Price Spikes: Look for sudden and substantial increases in the price of the asset, often accompanied by high trading volumes. This indicates strong buying interest.
Breakouts and Gaps: Melt-ups may involve breakouts above key resistance levels and price gaps as buyers enthusiastically enter the market, pushing prices higher without waiting for traditional technical levels.
Overbought Conditions: Indicators and oscillators to identify overbought conditions. Extremely high values can indicate that the market is overextended and vice versa.
Parabolic Moves: A parabolic price pattern, where the price accelerates upward in a steep curve, is often associated with a melt-up. This can be identified on a price chart.
FOMO Behavior: Market sentiment plays a crucial role in a melt-up. Watch for signs of Fear of Missing Out (FOMO) behavior among investors, which can contribute to an unsustainable rally.
Low Volatility Pullbacks: During a melt-up, pullbacks might be short-lived and characterized by low volatility. Buyers may quickly step in to take advantage of any dips.
It's important to note that while these indicators may suggest a melt-up, market dynamics can change, and there's always a level of unpredictability.
Risk management and staying informed about broader market conditions are crucial when navigating such extreme scenarios.
Melt-Up Factors observed in Technical Analysis:
Strong Momentum Indicators:
Bullish momentum, as indicated by rising indicators & oscillators having positive readings, can attract more buyers, fueling a melt-up.
Breakout Patterns:
Identification of bullish chart patterns like breakouts or continuation patterns may signal a strong upward move and contribute to a melt-up scenario.
Volume Surge:
High trading volumes accompanying the uptrend suggest increased participation and confidence among investors, reinforcing the melt-up trend.
Supportive Trendlines:
Upward-sloping trendlines provide a visual representation of the bullish trend, and their support can encourage further buying interest.
Liquidity Influx:
Positive market sentiment and an influx of liquidity, possibly driven by accommodative monetary policies, can contribute to a melt-up by facilitating higher valuations. Optimistic Market Psychology:
Positive news, economic indicators, or corporate earnings can create a bullish psychological environment, encouraging traders to adopt a buy-and-hold mentality.
Melt-Down Factors observed in Technical Analysis:
Divergence in Momentum Indicators:
Negative divergences in momentum indicators & oscillators can signal weakening upward momentum, potentially indicating an impending melt-down.
Bearish Reversal Patterns:
Recognition of bearish chart patterns, such as head and shoulders or double tops, can suggest a potential reversal in the trend, leading to a melt-down.
Increasing Selling Volumes:
A surge in selling volumes during a downtrend reflects strong selling pressure, exacerbating the downward movement and contributing to a melt-down.
Violation of Support Levels:
Breaking below key support levels or trendlines may trigger stop-loss orders and further selling, accelerating the melt-down process.
Market Sentiment Shifts:
Negative news, economic downturns, or geopolitical uncertainties can shift market sentiment, prompting investors to exit positions and contribute to a melt-down.
Liquidity Drying Up:
Reduced liquidity in the market, possibly due to risk aversion or tightening monetary policies, can exacerbate price declines during a melt-down.
Analyzing these technical factors provides insights into the dynamics of market movements, helping traders and investors navigate both bullish and bearish scenarios.
Stages of Melt-Up Using Technical Analysis:
Early Uptrend Recognition:
Identification of the initial signs of a bullish trend through technical indicators like moving averages, positive momentum, and breakout patterns.
Acceleration Phase:
Confirmation of the uptrend with strong momentum indicators, increasing trading volumes, and the development of bullish chart patterns, leading to an acceleration of price gains.
Overbought Conditions:
Recognition of overbought conditions using indicators, suggesting that the market may be reaching an unsustainable level of buying activity.
FOMO and Speculative Buying:
Increased speculation and FOMO behavior among investors, as indicated by rapid price increases, a surge in retail trading activity, and a shift towards riskier assets.
Parabolic Price Movement:
Observation of parabolic price movement, characterized by steep and unsustainable upward curves on charts, signaling an intensified phase of the melt-up.
Market Exuberance:
High levels of market exuberance and positive sentiment, possibly fueled by media coverage and optimistic economic outlooks, contributing to a euphoric atmosphere.
Stages of Melt-Down Using Technical Analysis:
Early Signs of Weakness:
Identification of initial signs of weakness in the uptrend, including negative divergences in momentum indicators, bearish reversal patterns, or a failure to sustain higher highs.
Loss of Key Support:
Breaking below key support levels or trendlines, triggering concerns among technical analysts about a potential shift in the trend.
Increased Selling Pressure:
Surge in selling volumes accompanied by downward price movements, signaling increased selling pressure and a potential acceleration of the melt-down.
Bearish Chart Patterns Confirmation:
Confirmation of bearish chart patterns, such as head and shoulders or double tops, supporting the case for a sustained downtrend.
Fear and Panic Selling:
Elevated fear and panic selling as investors rush to exit positions, exacerbating the downward pressure on prices.
Breakdown of Critical Levels:
Breaking through critical support levels, possibly triggering algorithmic trading strategies and stop-loss orders, intensifying the melt-down.
Understanding these stages using technical analysis can help traders and investors make informed decisions and implement risk management strategies during both melt-up and melt-down scenarios.
Risk and Dangers of a Market Melt-Up:
Overvaluation:
Melt-ups can lead to overvaluation, where asset prices detach from underlying fundamentals. This poses a risk of substantial losses when the market corrects.
Herding Behavior:
Investors may engage in herding behavior during a melt-up, following the crowd without considering fundamentals, increasing the risk of a sharp reversal.
Sudden Corrections:
Melt-ups are often followed by sudden corrections or market downturns. Investors entering late in the rally may face significant losses if they don't exit positions in time.
Excessive Risk-Taking:
The euphoria of a melt-up can lead to excessive risk-taking and leveraged positions, increasing vulnerability to market volatility.
Risk and Dangers of a Market Melt-Down:
Fast and Sharp Declines:
Melt-downs are characterized by fast and sharp declines in prices, catching investors off guard and resulting in substantial portfolio losses.
Panic Selling:
Fear and panic selling during a melt-down can exacerbate the decline, causing a cascading effect as more investors rush to liquidate positions.
Liquidity Issues:
Melt-downs may lead to liquidity issues, making it challenging for investors to exit positions at desired prices, amplifying losses.
Financial System Stress:
Severe market downturns can stress the financial system, potentially leading to disruptions in banking and other financial institutions.
Economic Impact:
Market melt-downs can have broader economic consequences, affecting consumer confidence, business investments, and overall economic stability.
A market melt-up poses risks as it can lead to overvaluation, herding behavior, and sudden corrections. Investors might be drawn into a euphoric buying frenzy, neglecting underlying fundamentals and taking excessive risks.
The danger lies in the potential for significant losses when the market corrects, catching latecomers off guard. Conversely, a market melt-down carries the risk of fast and sharp declines, triggering panic selling and liquidity issues. The rapid deterioration can stress the financial system, impacting not just investors but also having broader economic consequences. Both scenarios require vigilant risk management, strategic decision-making, and adaptability to navigate the inherent dangers associated with extreme market movements.
Using Technical Analysis to Mitigate Risks:
Risk Management:
Set clear risk management strategies, including stop-loss orders and position sizing, to protect against significant losses.
Diversification:
Diversify your portfolio across different asset classes to spread risk and reduce the impact of a severe market event.
Stay Informed:
Regularly monitor technical indicators, trend reversals, and market sentiment to stay informed about potential shifts in market conditions.
Avoid Chasing Trends:
Avoid chasing trends during melt-ups and practice disciplined investing to mitigate the risk of entering the market at unsustainable levels.
Adaptability:
Be adaptable and ready to adjust your investment strategy based on changing technical signals and market dynamics.
While technical analysis can provide valuable insights, it's essential to combine it with a holistic approach to risk management and a thorough understanding of market dynamics to navigate the challenges associated with both melt-ups and melt-downs.
Disclaimer:
The information provided in the technical analysis charts published on this TradingView account is for educational and informational purposes only. It does not constitute financial advice, investment recommendations, or trading strategies.
Trading and investing in financial markets involve risk, and past performance is not indicative of future results. The charts and analysis presented here may not guarantee accuracy or completeness, and users are encouraged to conduct their own research and seek professional advice before making any investment decisions.
The author of these charts is not responsible for any losses, damages, or other liabilities arising from the use of the information presented. Users should be aware of the inherent risks associated with trading and carefully consider their financial situation and risk tolerance before engaging in any trading activities.
By accessing and using the information provided in these charts, users acknowledge and agree to the terms of this disclaimer.

NIFTY : The tentative stage of a market melt-up stage in PROB#1NIFTY Projection Case Study:
Probability #1
Target Levels & Tentative Timings are marked in chart
In order to navigate the current market uncertainties effectively, it is crucial to grasp the specific stage of the market melt-up. Recognizing whether the market is in the early uptrend, an acceleration phase, or exhibiting signs of overbought conditions provides valuable insights for strategic decision-making. Acknowledging the risks associated with melt-ups, such as overvaluation and herding behavior, enables us to implement sound risk management practices. Similarly, being attuned to the potential dangers of a market melt-down, including fast declines and panic selling, empowers us to make informed decisions in this dynamic and ever-changing market environment.
A market melt-up typically occurs during the late stages of a bull market when investors rush to buy stocks, driving prices sharply higher. It is characterized by a sudden and intense upward momentum fueled by FOMO (fear of missing out). Melt-ups often precede market corrections or downturns, so caution is advised when witnessing extreme bullish behavior.
The exact timing of a market melt-up in NIFTY happened between 2003 to 2008. The rapid and excessive increase in asset prices driven by speculative buying and fear of missing out resulted in the 2008 financial crisis was marked by a severe downturn, triggered primarily by the collapse of the subprime mortgage market in the United States.
The duration of a melt-up can vary, and there is no fixed timeline for how long it lasts. Melt-ups are characterized by a rapid and intense upward movement in prices, often driven by speculative and fear-of-missing-out (FOMO) behavior among investors. The duration can be influenced by various technical factors, including market conditions, economic indicators, and global events.
In some cases, a melt-up can be relatively short-lived, with prices soaring over a few weeks or months before experiencing a correction. However, in other instances, a melt-up might extend for a more prolonged period if the speculative frenzy and optimistic sentiment persist even for several months or even years.
It's important to note that while melt-ups can result in significant gains, they often precede market corrections or downturns. Investors & traders should exercise caution and be aware of the potential risks associated with the unsustainable nature of extreme upward movements in asset prices. Monitoring market conditions using potential technical indicators and navigating using geometric analysis can help traders & investors make well-informed decisions during such periods.
In technical analysis, a melt-up is often characterized by rapid and aggressive upward price movements. Here are some technical indicators and patterns that might be associated with a typical melt-up:
Sharp Price Spikes: Look for sudden and substantial increases in the price of the asset, often accompanied by high trading volumes. This indicates strong buying interest.
Breakouts and Gaps: Melt-ups may involve breakouts above key resistance levels and price gaps as buyers enthusiastically enter the market, pushing prices higher without waiting for traditional technical levels.
Overbought Conditions: Indicators and oscillators to identify overbought conditions. Extremely high values can indicate that the market is overextended and vice versa.
Parabolic Moves: A parabolic price pattern, where the price accelerates upward in a steep curve, is often associated with a melt-up. This can be identified on a price chart.
FOMO Behavior: Market sentiment plays a crucial role in a melt-up. Watch for signs of Fear of Missing Out (FOMO) behavior among investors, which can contribute to an unsustainable rally.
Low Volatility Pullbacks: During a melt-up, pullbacks might be short-lived and characterized by low volatility. Buyers may quickly step in to take advantage of any dips.
It's important to note that while these indicators may suggest a melt-up, market dynamics can change, and there's always a level of unpredictability.
Risk management and staying informed about broader market conditions are crucial when navigating such extreme scenarios.
Melt-Up Factors observed in Technical Analysis:
Strong Momentum Indicators:
Bullish momentum, as indicated by rising indicators & oscillators having positive readings, can attract more buyers, fueling a melt-up.
Breakout Patterns:
Identification of bullish chart patterns like breakouts or continuation patterns may signal a strong upward move and contribute to a melt-up scenario.
Volume Surge:
High trading volumes accompanying the uptrend suggest increased participation and confidence among investors, reinforcing the melt-up trend.
Supportive Trendlines:
Upward-sloping trendlines provide a visual representation of the bullish trend, and their support can encourage further buying interest.
Liquidity Influx:
Positive market sentiment and an influx of liquidity, possibly driven by accommodative monetary policies, can contribute to a melt-up by facilitating higher valuations. Optimistic Market Psychology:
Positive news, economic indicators, or corporate earnings can create a bullish psychological environment, encouraging traders to adopt a buy-and-hold mentality.
Melt-Down Factors observed in Technical Analysis:
Divergence in Momentum Indicators:
Negative divergences in momentum indicators & oscillators can signal weakening upward momentum, potentially indicating an impending melt-down.
Bearish Reversal Patterns:
Recognition of bearish chart patterns, such as head and shoulders or double tops, can suggest a potential reversal in the trend, leading to a melt-down.
Increasing Selling Volumes:
A surge in selling volumes during a downtrend reflects strong selling pressure, exacerbating the downward movement and contributing to a melt-down.
Violation of Support Levels:
Breaking below key support levels or trendlines may trigger stop-loss orders and further selling, accelerating the melt-down process.
Market Sentiment Shifts:
Negative news, economic downturns, or geopolitical uncertainties can shift market sentiment, prompting investors to exit positions and contribute to a melt-down.
Liquidity Drying Up:
Reduced liquidity in the market, possibly due to risk aversion or tightening monetary policies, can exacerbate price declines during a melt-down.
Analyzing these technical factors provides insights into the dynamics of market movements, helping traders and investors navigate both bullish and bearish scenarios.
Stages of Melt-Up Using Technical Analysis:
Early Uptrend Recognition:
Identification of the initial signs of a bullish trend through technical indicators like moving averages, positive momentum, and breakout patterns.
Acceleration Phase:
Confirmation of the uptrend with strong momentum indicators, increasing trading volumes, and the development of bullish chart patterns, leading to an acceleration of price gains.
Overbought Conditions:
Recognition of overbought conditions using indicators, suggesting that the market may be reaching an unsustainable level of buying activity.
FOMO and Speculative Buying:
Increased speculation and FOMO behavior among investors, as indicated by rapid price increases, a surge in retail trading activity, and a shift towards riskier assets.
Parabolic Price Movement:
Observation of parabolic price movement, characterized by steep and unsustainable upward curves on charts, signaling an intensified phase of the melt-up.
Market Exuberance:
High levels of market exuberance and positive sentiment, possibly fueled by media coverage and optimistic economic outlooks, contributing to a euphoric atmosphere.
Stages of Melt-Down Using Technical Analysis:
Early Signs of Weakness:
Identification of initial signs of weakness in the uptrend, including negative divergences in momentum indicators, bearish reversal patterns, or a failure to sustain higher highs.
Loss of Key Support:
Breaking below key support levels or trendlines, triggering concerns among technical analysts about a potential shift in the trend.
Increased Selling Pressure:
Surge in selling volumes accompanied by downward price movements, signaling increased selling pressure and a potential acceleration of the melt-down.
Bearish Chart Patterns Confirmation:
Confirmation of bearish chart patterns, such as head and shoulders or double tops, supporting the case for a sustained downtrend.
Fear and Panic Selling:
Elevated fear and panic selling as investors rush to exit positions, exacerbating the downward pressure on prices.
Breakdown of Critical Levels:
Breaking through critical support levels, possibly triggering algorithmic trading strategies and stop-loss orders, intensifying the melt-down.
Understanding these stages using technical analysis can help traders and investors make informed decisions and implement risk management strategies during both melt-up and melt-down scenarios.
Risk and Dangers of a Market Melt-Up:
Overvaluation:
Melt-ups can lead to overvaluation, where asset prices detach from underlying fundamentals. This poses a risk of substantial losses when the market corrects.
Herding Behavior:
Investors may engage in herding behavior during a melt-up, following the crowd without considering fundamentals, increasing the risk of a sharp reversal.
Sudden Corrections:
Melt-ups are often followed by sudden corrections or market downturns. Investors entering late in the rally may face significant losses if they don't exit positions in time.
Excessive Risk-Taking:
The euphoria of a melt-up can lead to excessive risk-taking and leveraged positions, increasing vulnerability to market volatility.
Risk and Dangers of a Market Melt-Down:
Fast and Sharp Declines:
Melt-downs are characterized by fast and sharp declines in prices, catching investors off guard and resulting in substantial portfolio losses.
Panic Selling:
Fear and panic selling during a melt-down can exacerbate the decline, causing a cascading effect as more investors rush to liquidate positions.
Liquidity Issues:
Melt-downs may lead to liquidity issues, making it challenging for investors to exit positions at desired prices, amplifying losses.
Financial System Stress:
Severe market downturns can stress the financial system, potentially leading to disruptions in banking and other financial institutions.
Economic Impact:
Market melt-downs can have broader economic consequences, affecting consumer confidence, business investments, and overall economic stability.
A market melt-up poses risks as it can lead to overvaluation, herding behavior, and sudden corrections. Investors might be drawn into a euphoric buying frenzy, neglecting underlying fundamentals and taking excessive risks.
The danger lies in the potential for significant losses when the market corrects, catching latecomers off guard. Conversely, a market melt-down carries the risk of fast and sharp declines, triggering panic selling and liquidity issues. The rapid deterioration can stress the financial system, impacting not just investors but also having broader economic consequences. Both scenarios require vigilant risk management, strategic decision-making, and adaptability to navigate the inherent dangers associated with extreme market movements.
Using Technical Analysis to Mitigate Risks:
Risk Management:
Set clear risk management strategies, including stop-loss orders and position sizing, to protect against significant losses.
Diversification:
Diversify your portfolio across different asset classes to spread risk and reduce the impact of a severe market event.
Stay Informed:
Regularly monitor technical indicators, trend reversals, and market sentiment to stay informed about potential shifts in market conditions.
Avoid Chasing Trends:
Avoid chasing trends during melt-ups and practice disciplined investing to mitigate the risk of entering the market at unsustainable levels.
Adaptability:
Be adaptable and ready to adjust your investment strategy based on changing technical signals and market dynamics.
While technical analysis can provide valuable insights, it's essential to combine it with a holistic approach to risk management and a thorough understanding of market dynamics to navigate the challenges associated with both melt-ups and melt-downs.
Disclaimer:
The information provided in the technical analysis charts published on this TradingView account is for educational and informational purposes only. It does not constitute financial advice, investment recommendations, or trading strategies.
Trading and investing in financial markets involve risk, and past performance is not indicative of future results. The charts and analysis presented here may not guarantee accuracy or completeness, and users are encouraged to conduct their own research and seek professional advice before making any investment decisions.
The author of these charts is not responsible for any losses, damages, or other liabilities arising from the use of the information presented. Users should be aware of the inherent risks associated with trading and carefully consider their financial situation and risk tolerance before engaging in any trading activities.
By accessing and using the information provided in these charts, users acknowledge and agree to the terms of this disclaimer.

Nifty -50 trend and Levels expecting on 05-01-22 trading dayHi,
The Following points may help full to Nifty -50 Option traders – Good Luck
Nifty-50 trend end in last session Strong Buy in Weekly , Strong Buy in Daily and Strong Buy in 15mint charts.
World market Trends – US – MIXTURE & Europe - Strong Buy
Asian market Trends – Nikkei - Strong Buy , Hang Seng - Buy & KOSPI - Strong Sell
FII -Bought 1273.86 Cr . in cash , Bought 703.3Cr in Index Future & in Index Option Sold -1808.01 Cr on 04-01-22
DII- Bought 532.97Cr. on 04-01-22
SGX – Open @ -41 Points less and currently trading flat at same level no movement
Nifty50 Future – Open @ -18 Points less and currently trading flat at same level no movement
The market may open flat or gap down and according to sustains of support or resistance levels are mentioned in the chart.

HindalcoLet's analyze **Hindalco Industries Ltd.** from both a **fundamental** and **technical** perspective.
### **Fundamental Analysis of Hindalco Industries Ltd.**
#### **Overview of Hindalco Industries Ltd.**
- **Sector:** Metals, Mining, Aluminium, Copper
- **Industry:** Aluminium, Copper, and Metal Products
- **Founded:** 1958
- **Headquarters:** Mumbai, Maharashtra, India
- **Market Cap:** Approx. ₹90,000 crore (as per the latest data)
**Hindalco Industries Ltd.**, a part of the **Aditya Birla Group**, is one of the largest manufacturers of aluminium and copper products in India. The company is a leading player in the metal sector, with a diverse product portfolio, including aluminium sheets, foil, wire rods, copper cathodes, and more.
Hindalco operates through two primary business segments:
- **Aluminium:** Including alumina refining, primary aluminium production, rolling, and extrusions.
- **Copper:** Includes copper cathodes and related products, which are widely used in electrical, industrial, and telecommunications applications.
#### **Key Financials (Latest Report)**
- **Revenue Growth:** Hindalco has seen consistent revenue growth driven by strong demand in both aluminium and copper products. The company benefits from robust demand in the infrastructure, automotive, and electrical industries.
- **Profitability:** Hindalco's profitability is relatively stable, benefiting from economies of scale, a diversified product portfolio, and integrated operations. The company has maintained solid operating margins.
- **Debt Levels:** Hindalco has a manageable debt load, though it operates in a capital-intensive sector. The company has demonstrated a consistent ability to service debt, supported by strong cash flows from operations.
- **Cash Flow & Dividend Yield:** Hindalco generates strong operational cash flow, allowing it to fund capital expenditures, debt servicing, and pay consistent dividends to shareholders.
#### **Valuation Ratios**
- **P/E Ratio:** Hindalco's P/E ratio is typically lower than that of high-growth sectors, reflecting its cyclical nature. However, its stable growth in aluminium and copper makes it a defensive play in the metals sector.
- **P/B Ratio:** The P/B ratio is moderate, reflecting Hindalco’s substantial asset base in aluminium and copper production. This ratio tends to track closely with the company’s earnings growth and commodity prices.
- **Dividend Yield:** Hindalco is known for paying consistent and healthy dividends, which is attractive for long-term investors seeking income alongside capital appreciation.
#### **Industry & Macro Trends**
- **Global Aluminium and Copper Demand:** The demand for aluminium and copper is tied to global economic growth, particularly in infrastructure, automotive, and construction sectors. Hindalco benefits from rising global demand for lightweight materials like aluminium.
- **Commodity Prices:** Hindalco’s margins are highly sensitive to fluctuations in the prices of aluminium, copper, and energy. The prices of these commodities are volatile and can impact profitability, especially in periods of global supply disruptions or changes in demand.
- **Government Regulations and Policies:** Being in the metals sector, Hindalco is impacted by government policies related to environmental regulations, mining rights, and pricing regulations for raw materials.
- **Competition:** Hindalco competes with global players such as **Norsk Hydro**, **Rio Tinto**, and **Vedanta** in aluminium and copper. Domestic competitors include **National Aluminium Company (NALCO)** and **Vedanta Limited**.
---
### **Technical Analysis of Hindalco Industries Ltd.**
Let’s evaluate the **technical outlook** of Hindalco based on its stock price patterns, momentum indicators, and key levels:
#### **Price Action:**
- **Current Price:** Hindalco has experienced volatility over time, reflecting both global commodity price trends and company-specific events. The stock could move in line with broader metal sector trends.
#### **Key Levels:**
- **Support Levels:**
- **₹430-₹450:** This support level has historically been an important area where Hindalco’s stock tends to find buying interest. A fall below this zone could signal further downside risk.
- **₹400-₹420:** If the stock pulls back, this level could provide another level of support, especially during market corrections or commodity price pullbacks.
- **Resistance Levels:**
- **₹500-₹520:** This range is a significant resistance zone for Hindalco. A breakout above this level would signal strong bullish momentum, especially if accompanied by high volume.
- **₹550:** This is another key resistance level. A break above ₹550 could signal that the stock is entering a new bullish phase and could lead to further upside.
#### **Moving Averages:**
- **50-Day Moving Average (50-MA):** If Hindalco is trading above its 50-day moving average, it is considered to be in a short-term uptrend. A cross below the 50-day MA would indicate a potential shift to a bearish phase.
- **200-Day Moving Average (200-MA):** The 200-day moving average is a strong indicator of the long-term trend. A stock trading above this level signals long-term bullishness, while a fall below this would indicate a bearish trend.
#### **Momentum Indicators:**
- **RSI (Relative Strength Index):**
- An RSI above 70 would suggest that Hindalco might be overbought and due for a pullback.
- An RSI below 30 indicates the stock may be oversold and could be due for a reversal or consolidation.
- **MACD (Moving Average Convergence Divergence):**
- A positive MACD (when the MACD line crosses above the signal line) would suggest upward momentum.
- A negative MACD (when the MACD line crosses below the signal line) would indicate weakening momentum or potential reversal to the downside.
#### **Volume Analysis:**
- **Volume Trends:** Rising volume during price increases suggests strong buying interest and can confirm a bullish trend. Similarly, decreasing volume during price drops could indicate that selling pressure is subsiding.
- **Volume Spikes:** A large spike in volume at key support or resistance levels (₹450, ₹500) could signal a breakout or breakdown, depending on the direction of the price move.
---
### **Conclusion:**
- **Fundamental Strengths:**
- Hindalco Industries is a dominant player in the global aluminium and copper markets with strong fundamentals, including a solid revenue base, good profitability, and strong cash flow.
- The company is well-positioned to benefit from the growing demand for aluminium, driven by sectors like automotive, infrastructure, and electrical.
- Despite the cyclical nature of the metals industry, Hindalco’s diversified business and strong management enable it to weather volatility and continue to generate value for shareholders.
- **Technical Outlook:**
- **Support levels:** ₹430-₹450 (primary), ₹400-₹420 (secondary).
- **Resistance levels:** ₹500-₹520 (primary), ₹550 (psychological resistance).
- The stock is likely to follow the global trends in aluminium and copper prices. Keep an eye on the breakout above resistance levels for further upward momentum.
#### **Risks to Consider:**
- **Commodity Price Volatility:** Hindalco’s performance is closely tied to fluctuations in aluminium and copper prices. Global economic conditions and supply-demand imbalances in metals can significantly impact profitability.
- **Geopolitical Risks:** Trade tariffs, sanctions, and other geopolitical factors can impact the prices and supply of raw materials, potentially affecting Hindalco’s margins.
---
**Disclaimer:**
The information provided is for educational purposes only and should not be construed as financial or investment advice. I am not a SEBI-registered advisor, and this analysis is not a recommendation to buy, sell, or hold any securities. Accuracy and timeliness of the data cannot be guaranteed. Always conduct your own research or consult with a professional before making investment decisions. I do not take responsibility for any losses incurred.

BPCL Long Pick
Please consult your financial advisor before investing
All research for educational purposes only.
Here is a technical analysis of BPCL (Bharat Petroleum Corporation Ltd) as of May 2024:
Current Stock Performance
Current Price: ₹629.00
Day's Range: ₹607.20 - ₹623.50
52-Week Range: ₹331.45 - ₹687.95
Market Cap: ₹1.36 trillion
Volatility: 0.57% with a beta of 1.37
Moving Averages
BPCL's stock exhibits strong buy signals across various moving averages:
MA5: Simple - ₹616.23, Exponential - ₹617.74
MA10: Simple & Exponential - ₹612.80
MA20: Simple - ₹604.85, Exponential - ₹608.35
MA50: Simple - ₹598.97, Exponential - ₹601.91
MA100: Simple - ₹597.53
Technical Indicators
BPCL shows strong buy signals based on multiple technical indicators:
RSI (14): 72.13 (Buy)
Stochastic (9,6): 67.29 (Buy)
StochRSI (14): 100 (Overbought)
MACD (12,26): 5.75 (Buy)
ADX (14): 45.97 (Buy)
CCI (14): 159.24 (Buy)
Williams %R: -3.90 (Overbought)
ATR (14): 6.05 (High Volatility)
Highs/Lows (14): 10.31 (Buy)
Ultimate Oscillator: 56.68 (Buy)
ROC: 4.70 (Buy)
Bull/Bear Power (13): 19.42 (Buy)
Summary
Overall, the technical analysis for BPCL indicates a strong buy signal. This conclusion is based on the convergence of multiple moving averages and technical indicators all pointing towards a bullish trend. The stock's performance shows positive momentum, with several indicators such as RSI, MACD, and ADX suggesting strong buying conditions.
This analysis should be supplemented with additional research and consideration of other factors such as market conditions and fundamental analysis before making any investment decisions.

Nifty -50 trend and Levels expecting on 07-01-22 trading dayHi,
The Following points may help full to Nifty -50 Option traders – Good Luck
Nifty-50 trend end in last session Strong Buy in Weekly , Strong Buy in Daily and Strong Buy in 15mint charts.
World market Trends – US – Strong Sell & Europe - Strong Sell
Asian market Trends – Nikkei –Strong Sell , Hang Seng -Neutral & KOSPI Neutral
FII –Sold 1926.77Cr . in cash , Sold 3013.08Cr in Index Future & in Index Option Bought -14095.61 Cr on 06-01-22
DII- Bought 800.91Cr. on 06-01-22
SGX – Open @ +11 Points Higher i.e flat and current movement of trading is Up wards. Sell
Nifty50 Future – Open @ +36 point Higher i.e gap up and current movement of trading is up wards . Strong Buy

Nifty -50 trend and Levels expecting on 06-01-22 trading dayHi,
The Following points may help full to Nifty -50 Option traders – Good Luck
Nifty-50 trend end in last session Strong Buy in Weekly , Strong Buy in Daily and Strong Buy in 15mint charts.
World market Trends – US – Strong Sell & Europe - Strong Buy
Asian market Trends – Nikkei –Neutral , Hang Seng -Strong Sell & KOSPI - Strong Sell
FII -Bought 336.83 Cr . in cash , Bought 475.68Cr in Index Future & in Index Option Sold -498.56 Cr on 05-01-22
DII- Bought 1271.95Cr. on 05-01-22
The support or resistance levels are mentioned in Chart . Your trade may take Position either side CE or PE of at the Money strict after sustained of min. 5 mints at the level above or below current market movement. Trade and earn money Good luck.

Nifty 50 trend and Levels on 28-12-21Hi,
The Following points may help full to Nifty -50 Option traders – Good Luck
Nifty-50 trend end with last session Sell in Weekly , Neutral in Daily and Strong Buy in 15mint charts.
World market – US - Strong Buy & Europe - Strong Buy
Asian market – Nikkei - Strong Buy, Hang Seng - Strong Buy & KOSPI - Strong sell
FII – Sold 1038 Cr. in cash , Bought 55. Cr in Index Future & Bought 7943 Cr in Index Option on 27-12-21
DII- Bought 956 Cr. on 27-12-21
SGX – Gap UP open around +113 points and currently trading in down from open .
Nifty50 Future – Gap up open around +21 points and currently in down from open . Same as SGX
The market may Gap Up open then it will move according to sustains of support or resistance levels as bellow mentioned.
The major support zone 17062 crossed bellow and sustained then fall down to16961,16836,16635.
The major resistance zone 17163 crossed above and sustained then raise up to 17307, 17490,17639.

NIFTY 50 PREDICTION OF 16-09-2020T ODAY GREEN CANDLE FORM AFTER PREVIOUS RED CANDLES,
IT SHOWS BULLISH STRENGTH OF THE MARKET.
AT 14-09-2020 PROFIT BOOKING WAS THERE, SO ONLY BUYING WOULD FORM IN THE MARKET.
MARKET SENTIMENT DATA:
Moving Averages - - 100% Strong Buy
Momentum Oscillators - 83% Strong Buy
Trend Oscillators - 67% Buy
Volatility - - 100% Strong Buy
ALL INDICATOR DATA:
Name Value Action
RSI(14) 55.287 Buy
STOCH(9,6) 63.209 Buy
STOCHRSI(14) 70.377 Buy
Williams %R -18.270
CCI(14) 38.9796 Neutral
ROC 3.721 Buy
Ultimate Oscillator 58.761 Buy
KEY POINTS FOR TOMORROW
1. MARKET SHOULD OPEN ABOVE 11565.
2. STRONG RESISTANCE IS 11550.
3. AFTER GAP UP SHORT SELLING WILL FORM NEAR 11585.
4. AVOID TRADE ABOVE 11600 AS BUY CALL.
5. ABOVE 11585 CHANCE OF SHORT SELLING, BUT IN LIMITED ZONE. (11525-11565)
IF MARKET OPEN IN GAP DOWN (BELOW 11500), THEN BUY IMMEDIATELY.
BUT OPEN BELOW 11460, THEN SHORT SELL.
ALSO AWARE INTERNATIONA AND NATIONAL NEWS SENTIMENTS.

Chambl-Fertilizer watch for breakoutLet's analyze **Chambal Fertilizers and Chemicals Ltd. (CHAMBLFERT)** from both a **fundamental** and **technical** perspective.
### **Fundamental Analysis of Chambal Fertilizers & Chemicals Ltd. (CHAMBLFERT)**
#### **Overview of Chambal Fertilizers & Chemicals Ltd.**
- **Sector:** Fertilizers & Agrochemicals
- **Industry:** Fertilizers, Chemicals
- **Founded:** 1985
- **Headquarters:** Kota, Rajasthan, India
- **Market Cap:** Approx. ₹20,000 crore (as per the latest data)
Chambal Fertilizers & Chemicals Ltd. is one of India’s leading manufacturers and marketers of fertilizers. The company primarily produces Urea and other nitrogenous fertilizers. It is part of the **SKS Group**, which has a strong presence in the Indian agricultural and chemical sectors.
#### **Key Financials (Latest Report)**
- **Revenue Growth:** Chambal Fertilizers has shown consistent growth, driven by increased demand for fertilizers, especially in India’s agricultural sector. The company's revenue is sensitive to changes in fertilizer subsidies, raw material costs, and government policies.
- **Profitability:** The company has maintained stable profitability due to its scale and integrated operations, with a focus on efficient production. Chambal Fertilizers benefits from favorable subsidies provided by the Indian government to the fertilizer sector.
- **Debt Levels:** Chambal Fertilizers has a moderate debt-to-equity ratio typical for companies in the capital-intensive fertilizer industry. The company’s debt levels have been manageable, as it generates stable cash flows.
- **Cash Flows:** The company benefits from a predictable cash flow structure due to the government support for fertilizers. However, fluctuations in raw material costs and subsidy payments can affect cash flow in the short term.
#### **Valuation Ratios**
- **P/E Ratio:** Chambal Fertilizers has a relatively low P/E ratio compared to many other sectors, which is typical for companies in the fertilizer space. The P/E ratio is influenced by the company's steady revenue and stable margins.
- **P/B Ratio:** The price-to-book ratio of Chambal Fertilizers is generally moderate, reflecting its asset base and efficient management of capital.
- **Dividend Yield:** Chambal Fertilizers has a strong dividend track record, reflecting its stable earnings and cash flow generation. Investors in this stock typically benefit from a regular dividend payout.
#### **Industry & Macro Trends**
- **Fertilizer Demand in India:** India remains one of the largest consumers of fertilizers due to its large agricultural sector. Government subsidies and policies support demand for fertilizer products, including urea and other nitrogenous fertilizers.
- **Subsidy Support:** The Indian government has a significant impact on the fertilizer sector due to subsidies for urea. Any changes in subsidy policy can influence the profitability of companies like Chambal Fertilizers.
- **Raw Material Costs:** Chambal Fertilizers' margins are sensitive to fluctuations in raw material costs, such as natural gas (used for urea production), which can affect production costs.
- **Agricultural Growth:** The growth in India’s agricultural output, including increased acreage for key crops like wheat and rice, directly impacts the demand for fertilizers.
- **Competition:** Chambal Fertilizers faces competition from other major fertilizer producers like National Fertilizers Ltd., IFFCO, and Rashtriya Chemicals and Fertilizers (RCF).
---
### **Technical Analysis of Chambal Fertilizers & Chemicals Ltd. (CHAMBLFERT)**
Let’s evaluate the **technical outlook** of Chambal Fertilizers, based on its stock price patterns and key levels:
#### **Price Action:**
- **Current Price:** Chambal Fertilizers' stock price tends to move in tandem with the overall agricultural and chemical sector sentiment. The price may consolidate within a range depending on the broader market conditions and agricultural output forecasts.
#### **Key Levels:**
- **Support Levels:**
- **₹300-₹320:** This range could be considered as the first level of support. If the stock approaches this level and bounces, it would suggest buying interest around this zone.
- **₹280-₹290:** If the stock falls below the ₹300 level, the ₹280-₹290 range could act as a secondary support level, marking a strong point for potential price stabilization or reversal.
- **Resistance Levels:**
- **₹350-₹370:** This level is a critical resistance zone, where selling pressure might emerge. A breakout above this level could signal bullish movement in the stock.
- **₹400:** This is a key psychological resistance level. If the stock breaks above ₹400 with strong volume, it could indicate further upside potential.
#### **Moving Averages:**
- **50-Day Moving Average (50-MA):** If the stock is trading above the 50-day moving average, it suggests short-term bullish momentum. A cross below the 50-MA could signal weakness.
- **200-Day Moving Average (200-MA):** This is the key indicator for long-term trends. If the stock is above the 200-day MA, it suggests that the long-term trend remains bullish. If the stock is below, it could indicate a prolonged downtrend or neutral market conditions.
#### **Momentum Indicators:**
- **RSI (Relative Strength Index):**
- An RSI above 70 would indicate that the stock is overbought and might be due for a pullback.
- An RSI below 30 suggests oversold conditions and could present a buying opportunity if the stock shows signs of reversal.
- **MACD (Moving Average Convergence Divergence):**
- A positive MACD (when the MACD line crosses above the signal line) would suggest bullish momentum.
- A negative MACD (when the MACD line crosses below the signal line) would suggest weakening momentum.
#### **Volume Analysis:**
- **Volume Trends:** Pay attention to volume trends. If the stock rallies with increasing volume, it would suggest strong buying conviction. Conversely, declining volume during price increases may suggest a lack of conviction.
- **Volume Spikes:** A significant volume spike at key support or resistance levels could indicate that a breakout or breakdown is imminent.
---
### **Conclusion:**
- **Fundamental Strengths:**
- Chambal Fertilizers benefits from a stable and predictable demand for its products due to India’s large agricultural sector and government subsidies.
- The company has a robust track record of profitability, strong cash flows, and a shareholder-friendly dividend policy.
- It faces risks from raw material cost fluctuations and any changes in government subsidy policy but is well-positioned in the fertilizer market due to its scale and distribution reach.
- **Technical Outlook:**
- **Support levels:** ₹300-₹320 (primary) and ₹280-₹290 (secondary).
- **Resistance levels:** ₹350-₹370 (primary) and ₹400 (psychological resistance).
- The stock is likely to remain range-bound unless it breaks out of the key resistance levels. Watch for momentum indicators like the MACD and RSI for potential trend changes.
#### **Risks to Consider:**
- **Policy Risks:** Any changes in fertilizer subsidies or government regulations could impact profitability.
- **Commodity Price Volatility:** Rising raw material costs could compress margins.
---
**Disclaimer:**
The information provided is for educational purposes only and should not be construed as financial or investment advice. I am not a SEBI-registered advisor, and this analysis is not a recommendation to buy, sell, or hold any securities. Accuracy and timeliness of the data cannot be guaranteed. Always conduct your own research or consult with a professional before making investment decisions. I do not take responsibility for any losses incurred.

Sardaen stock for watchLet's dive into the analysis of **Sarda Energy & Minerals Ltd.** (often referred to as **Sarda Energy**), which is a leading player in the Indian steel industry, focusing on both production and power generation.
### **Fundamental Analysis of Sarda Energy & Minerals Ltd.**
#### **Overview of Sarda Energy & Minerals Ltd.**
- **Sector:** Steel, Mining, Power Generation
- **Industry:** Steel, Iron & Steel Products, Power
- **Founded:** 1973 by Mr. Sushil Sarda
- **Headquarters:** Raipur, Chhattisgarh, India
- **Market Cap:** Approx. ₹5,000-6,000 crore (as per the latest data)
Sarda Energy & Minerals Ltd. (SEML) is a diversified company involved in manufacturing steel, ferro alloys, power generation, and mining. It is known for its integrated steel plant in Chhattisgarh, and the company also focuses on power generation through its captive power plants.
#### **Key Financials (Latest Report)**
- **Revenue Growth:** The company has shown steady revenue growth due to its integrated business model, which combines steel production, power generation, and mining. The demand for steel and other products has generally been stable, contributing to this growth.
- **Profitability:** Sarda Energy has shown solid profitability, driven by its strong operational efficiency and backward integration into mining. The company has also benefited from the higher demand for steel and ferro alloys in domestic and export markets.
- **Debt Levels:** The company has moderate debt levels, which are typical in the capital-intensive steel industry. However, it has shown an ability to manage its debt efficiently, with its operational cash flows supporting its debt servicing.
- **Return Ratios:** The return on equity (RoE) and return on capital employed (RoCE) ratios of Sarda Energy have generally been above industry averages, indicating efficient use of shareholder capital.
#### **Valuation Ratios**
- **P/E Ratio:** Sarda Energy's P/E ratio can fluctuate based on commodity price cycles, but it is typically in line with other steel companies of similar size and market positioning.
- **P/B Ratio:** Sarda Energy has a P/B ratio that reflects its strong asset base, driven by its mining and power generation assets. The company’s stock is likely to be valued higher due to its integrated nature and diversified revenue streams.
- **Debt-to-Equity Ratio:** As a capital-intensive sector, the company’s debt-to-equity ratio is typical of the steel industry. However, it’s crucial to watch this ratio in relation to its ability to generate consistent cash flows.
#### **Industry & Macro Trends**
- **Steel Sector Growth:** The Indian steel sector has shown steady growth in the past decade, driven by infrastructure development, urbanization, and government spending on projects. Sarda Energy, with its strong domestic presence, stands to benefit from these trends.
- **Ferro Alloy and Mining Demand:** Demand for ferro alloys and minerals (mainly manganese and iron ore) has been rising, driven by the steel and energy sectors. Sarda Energy’s backward integration into mining gives it a cost advantage and ensures supply stability.
- **Government Policy:** Initiatives like "Make in India" and infrastructure development programs by the government continue to drive demand for steel products. Additionally, policies like anti-dumping duties on imported steel could help domestic producers like Sarda Energy.
- **Commodity Price Fluctuations:** Steel and ferro alloy prices are subject to global commodity price fluctuations. While demand is growing, prices can be volatile, impacting margins.
---
### **Technical Analysis of Sarda Energy & Minerals Ltd.**
Let's look at potential technical levels and patterns for **Sarda Energy & Minerals Ltd.**, assuming the stock is being analyzed:
#### **Price Action:**
- **Current Price:** The stock price of Sarda Energy would reflect its financial performance, steel demand trends, and broader market sentiment. If the stock price is consolidating in a range, it may indicate indecision among investors.
#### **Key Levels:**
- **Support Levels:**
- **₹300-₹320:** This is an important support level where the stock might find buying interest. A breach below this level could suggest further downside risk.
- **₹280-₹290:** If the stock falls to this level, it would likely test another critical support. A bounce from here could signal a buying opportunity.
- **Resistance Levels:**
- **₹380-₹400:** A resistance level for Sarda Energy. If the stock breaks above this level with strong volume, it could suggest further upward momentum.
- **₹420-₹440:** This is another significant resistance zone where selling pressure may build. If the stock moves above this zone, it could target higher levels.
#### **Moving Averages:**
- **50-Day Moving Average (50-MA):** A close above the 50-day moving average would indicate short-term bullishness, while trading below it could suggest a bearish trend.
- **200-Day Moving Average (200-MA):** The 200-day moving average is a key indicator of the long-term trend. If the stock is trading above it, it suggests long-term strength.
#### **Momentum Indicators:**
- **RSI (Relative Strength Index):**
- If the RSI is above 70, the stock could be overbought, signaling a potential pullback.
- If the RSI is below 30, the stock could be oversold and may see a price reversal or consolidation.
- **MACD (Moving Average Convergence Divergence):**
- A bullish signal occurs when the MACD line crosses above the signal line. A bearish crossover (MACD line crossing below the signal line) would indicate a potential downtrend.
#### **Volume Analysis:**
- **Volume Trends:** Rising volume along with price increases is a bullish signal, indicating strong buying interest. Conversely, increasing volume during price declines can suggest that selling pressure is dominant.
- **Volume Spikes:** A large volume spike near key support or resistance levels can signify a potential breakout or breakdown.
---
### **Conclusion:**
- **Fundamental Strengths:**
- Sarda Energy & Minerals Ltd. has a strong position in the Indian steel, mining, and power sectors, benefiting from vertical integration, solid financial management, and a diversified revenue base.
- Its focus on high-margin products like ferro alloys and its ability to manage its debt levels provide a competitive edge in the industry.
- **Technical Outlook:**
- Support levels around ₹300-₹320 and resistance near ₹380-₹400 should be closely watched. A breakout above ₹400 could signal bullish momentum.
- The stock's 50-day and 200-day moving averages will give insight into short-term and long-term trends, while RSI and MACD will help gauge market sentiment and potential price movements.
#### **Risks to Consider:**
- **Commodity Price Volatility:** Sarda Energy’s profitability is tied to the price of steel and ferro alloys, which can be volatile.
- **Debt and Capital Intensive Nature:** The company’s capital structure and debt levels need to be monitored closely, especially if there’s a downturn in the steel market.
---
**Disclaimer:**
The information provided is for educational purposes only and should not be construed as financial or investment advice. I am not a SEBI-registered advisor, and this analysis is not a recommendation to buy, sell, or hold any securities. Accuracy and timeliness of the data cannot be guaranteed. Always conduct your own research or consult with a professional before making investment decisions. I do not take responsibility for any losses incurred.
