#Nifty 15Min #SupportandResistance for 24/11/2022 #NIFTYFUTUREHi All, here I shared my view on #niftyfuture Support and Resistance level for 24/11/2022. for educational purpose only, not for trade recommended.
Search in ideas for "SUPPORTANDRESISTANCE"

#Nifty 15Min #SupportandResistance for 23/11/2022 #NIFTYFUTUREHi All, here I shared my view on #niftyfuture Support and Resistance level for 23/11/2022. for educational purpose only, not for trade recommended.

#Nifty 15Min #SupportandResistance for 18/11/2022 #NIFTYFUTUREHi All, here I shared my view on #niftyfuture Support and Resistance level for 18/11/2022. for educational purpose only, not for trade recommended.

#Nifty 15Min #SupportandResistance for 15/11/2022 #NIFTYFUTUREHi All, here I shared my view on #niftyfuture Support and Resistance level for 15/11/2022. for educational purpose only, not for trade recommended.

#Nifty 15Min #SupportandResistance for 15/11/2022 #NIFTYFUTUREHi All, here I shared my view on #niftyfuture Support and Resistance level for 15/11/2022. for educational purpose only, not for trade recommended.

#Nifty 15Min #SupportandResistance for 14/11/2022 #NIFTYFUTUREHi All, here I shared my view on #niftyfuture Support and Resistance level for 14/11/2022. for educational purpose only, not for trade recommended.

#Nifty 15Min #SupportandResistance for 11/11/2022 #NIFTYFUTUREHi All, here I shared my view on #niftyfuture level for 11/11/2022 Support and Resistance. for educational purpose only, not for trade recommended.

#Nifty 15Min #SupportandResistance #NIFTYFUTUREHi All, here I shared my view on #niftyfuture level for 10/11/2022 Support and Resistance. for educational purpose only, not for trade recommended.

BankNifty POC Levels and Trading Range Update for 22.06.2022Important SR levels Update based on volume profile analysis for NSE:BANKNIFTY
33500 important resistance for tomorrow.
Resistance levels ===> 33410.70/33629.70/33997.55
Support Levels ===> 32972.80/32753.80/32385.95
Keep Patience and trade with reversal or Breakout strategy near POC level.
Try to understand psychology of market.
Hello Trader. If you like the idea, do not forget to support with a like and follow.
Above is purely my opinion. It doesn't mean that you need to trade accordingly. Please note that I'm not Sebi registered advisor or technical analyst. Trade on your own conviction and please consult your advisor before investing.
#supportandresistance #volumeprofileanalysis #stockmarketindia

Nifty POC Levels and Trading Range Update for 21.06.2022Important SR levels Update based on volume profile analysis for NSE:NIFTY
Resistance levels ===> 15717.85/15796.85/15930.3
Support levels ===> 15559.75/15480.75/15347.30
Keep Patience and trade with reversal or Breakout strategy near POC level.
Try to understand psychology of market.
Hello Trader. If you like the idea, do not forget to support with a like and follow.
Above is purely my opinion. It doesn't mean that you need to trade accordingly. Please note that I'm not Sebi registered advisor or technical analyst. Trade on your own conviction and please consult your advisor before investing.
#supportandresistance #volumeprofileanalysis #stockmarketindia

Banknifty POC Levels and Trading Range Update 21.06.2022Important SR levels Update based on volume profile analysis for NSE:BANKNIFTY
Banknifty trading in a Range.
32500 important support for now.
Market to open Flat or slightly Gap Up.
Keep Patience and trade with reversal or Breakout strategy near POC level.
Try to understand psychology of market.
Hello Trader. If you like the idea, do not forget to support with a like and follow.
Above is purely my opinion. It doesn't mean that you need to trade accordingly. Please note that I'm not Sebi registered advisor or technical analyst . Trade on your own conviction and please consult your advisor before investing .
#supportandresistance #volumeprofileanalysis #stockmarketindia

Bearish Structure with Bearish Pole and FlagImportant SR levels Update based on volume profile analysis for NSE:LT
Hello Trader. If you like the idea, do not forget to support with a like and follow.
Above is purely my opinion. It doesn't mean that you need to trade accordingly. Please note that I'm not Sebi registered advisor or technical analyst . Trade on your own conviction and please consult your advisor before investing .
#supportandresistance #volumeprofileanalysis #stockmarketindia #LT

EUR/USD Trading Plan: Key Support, Resistance & Entry PointsThe EUR/USD currency pair is one of the most traded pairs in the world and is often influenced by various factors, including economic indicators, geopolitical events, and monetary policies from the European Central Bank (ECB) and the Federal Reserve (Fed). As of March 10, 2025, the pair has been showing volatility due to recent economic data releases, interest rate expectations, and market sentiment.
Daily Chart Analysis:
• Trend: The daily trend shows a bullish outlook, with the EUR/USD maintaining above the 200-day moving average.
• Key Levels:
o Support: 1.0900
o Resistance: 1.1050
4-Hour Chart Analysis:
o Trend: The 4-hour chart indicates a recent bullish correction after a small pullback.
o Key Levels:
Support: 1.0930)
Resistance: 1.1040
1-Hour Chart Analysis:
o Trend: Short-term gauges a consolidation phase.
o Key Levels:
Support: 1.0920
Resistance: 1.0990
Key Support and Resistance Levels
• Support Levels:
o 1.0900: Strong psychological level and previous resistance.
o 1.0850: Fibonacci level that provides additional support.
• Resistance Levels:
o 1.1050: Recent swing high, seen as major resistance.
o 1.1100: Upper bound of the recent trading range.
Breakout Points
• A breakout above 1.1050 could signal further bullish momentum, targeting 1.1100 and potentially higher levels, depending on broader market conditions.
• A breakdown below 1.0900 would indicate bearish sentiment, possibly retesting lower support levels at 1.0850.
Trade Setup
Trade Idea
Bullish Setup: Buy EUR/USD
• Entry Point: 1.0955 (confirmation above key resistance on the 1-hour or 4-hour)
• Stop Loss: 1.0920 (below the recent support level)
• Take Profit: 1.1050 (targeting the established resistance)
✅ #forex
✅ #forextrading
✅ #forexanalysis
✅ #forexsignals
✅ #fxtrading
✅ #trading
✅ #eurusd
✅ #eurusdforecast
✅ #eurusdanalysis
✅ #eurusdtrading
✅ #eurusdsetup
✅ #eurusdsignal
✅ #technicalanalysis
✅ #priceaction
✅ #supportandresistance
✅ #trendanalysis
✅ #chartpatterns
✅ #elliottwave
✅ #swingtrading
✅ #daytrading
✅ #scalping
✅ #riskmanagement
✅ #tradingpsychology
✅ #tradingview
✅ #forexcommunity
✅ #marketanalysis

Stock Analysis: Rico Auto🚗 Multi-Year Breakout Alert!
Rico Auto has shown significant strength with a multi-year breakout, surpassing its 2005 all-time high. Let’s break it down:
Historical Resistance: The stock tested its 2005 all-time high two times:
In 2017, it reversed from these levels.
In 2023, it made another attempt but failed to break through.
February 2024 Breakout: This time, the stock finally broke the strong resistance with good volume in February 2024. This breakout suggests a potential long-term trend shift.
Current Retest: The stock has now returned to retest this key breakout level, which is now acting as support.
However, there’s one thing to watch out for:
📉 EMA Overview:
50 EMA: The stock is currently trading below the 50 EMA.
200 EMA: It is also below the 200 EMA, indicating the long-term trend is still bearish.
🎯 What to Watch:
A successful hold at the current support level could lead to an upward move.
But the stock will need to reclaim the 50 and 200 EMAs to signal stronger bullish momentum.
Keep an eye on volume and price action for a clear breakout or breakdown from these levels.
Always conduct your own research and analysis before making any investment decisions. 🚨
#StockBreakout #RicoAuto #TechnicalAnalysis #SupportAndResistance #EMAAnalysis

#Nifty future 15Min #SupportandResistance for 29/12/2022Hi All, here I shared my view on #nifty future Supports and Resistances level for 29/12/2022. for educational purpose only, not for trade recommended.

#Nifty 15Min #SupportandResistance for 21/11/2022 #NIFTYFUTUREHi All, here I shared my view on #niftyfuture Support and Resistance level for 21/11/2022. for educational purpose only, not for trade recommended.

#Nifty 15Min #SupportandResistance for 17/11/2022 #NIFTYFUTUREHi All, here I shared my view on #niftyfuture Support and Resistance level for 17/11/2022. for educational purpose only, not for trade recommended.

Cup and Handle Pattern in Hourly TFLevels and Ideas given in the Chart.
Keep Patience and trade with reversal or Breakout strategy near POC level.
Try to understand psychology of market.
If you like the idea, do not forget to support with a like and follow.
Above is purely my opinion. It doesn't mean that you need to trade accordingly. Please note that I'm not Sebi registered advisor or technical analyst. Trade on your own conviction and please consult your advisor before investing.
#supportandresistance #volumeprofileanalysis #stockmarketindia #banknifty

Banknifty POC Levels and Trading Range Update 28.06.2022Important POC level Updates for NSE:BANKNIFTY .
Expecting a trending Rally or Drop before expiry. If happens so target levels are given in the chart.
High Volume Node levels have been plotted.
Keep Patience and trade with reversal or Breakout strategy near POC level.
Try to understand psychology of market.
If you like the idea, do not forget to support with a like and follow.
Above is purely my opinion. It doesn't mean that you need to trade accordingly. Please note that I'm not Sebi registered advisor or technical analyst. Trade on your own conviction and please consult your advisor before investing.
#supportandresistance #volumeprofileanalysis #stockmarketindia #banknifty

Bearish Shark Pattern CD Leg to Complete for ReversalHello Traders. I have observed Bearish Shark Pattern in NSE:TCS Daily Time frame.
NSE:TCS is going to be bullish up to Potential Reversal Zone i.e. 3695-3750.
We'll have to see Buy trade till the price reaches this zone. Then Sell trade on Price action basis after reversal is confirmed.
High Volume Node levels have been plotted. They are synced with Monthly POC.
Keep Patience and trade with reversal or Breakout strategy near POC level.
Try to understand psychology of market.
If you like the idea, do not forget to support with a like and follow.
Above is purely my opinion. It doesn't mean that you need to trade accordingly. Please note that I'm not Sebi registered advisor or technical analyst. Trade on your own conviction and please consult your advisor before investing.
#supportandresistance #volumeprofileanalysis #stockmarketindia

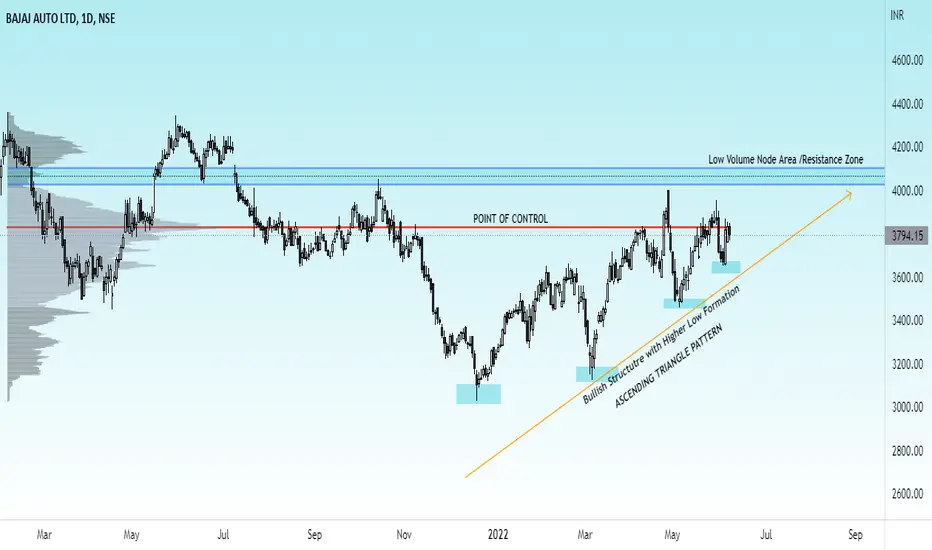
Triangle Pattern Breakout ImpendingImportant SR levels Update based on volume profile analysis for NSE:BAJAJ_AUTO
Hello Trader. If you like the idea, do not forget to support with a like and follow.
Above is purely my opinion. It doesn't mean that you need to trade accordingly. Please note that I'm not Sebi registered advisor or technical analyst . Trade on your own conviction and please consult your advisor before investing .
#supportandresistance #volumeprofileanalysis #stockmarketindia #bajajauto
Trend Reversal with Double Top Pattern & Candlestick formationsImportant SR levels Update based on volume profile analysis for NSE:RELIANCE
Hello Trader. If you like the idea, do not forget to support with a like and follow.
Above is purely my opinion. It doesn't mean that you need to trade accordingly. Please note that I'm not Sebi registered advisor or technical analyst . Trade on your own conviction and please consult your advisor before investing .
#supportandresistance #volumeprofileanalysis #stockmarketindia #reliance

Trendline Breakdown in BhartiartlImportant SR levels Update based on volume profile analysis for NSE:BHARTIARTL
Hello Trader. If you like the idea, do not forget to support with a like and follow.
Above is purely my opinion. It doesn't mean that you need to trade accordingly. Please note that I'm not Sebi registered advisor or technical analyst . Trade on your own conviction and please consult your advisor before investing .
#supportandresistance #volumeprofileanalysis #stockmarketindia
