Search in ideas for "SUPPORTANDRESISTANCE"

BNF LONGBNF LONG setup in 15mins TF. If it sustains above 45000, we can expect to rally until 45900 in near future


Bank nifty Weekly Analysis The chart is self-explanatory and shared chart for educational purposes.
It was trading above the MA line & sustaining a strong support level. So high probability moves upward direction

Bitcoin Bull Market has started!The Bitcoin Bull Market has started.
Confirmation of that to me is in this chart.
The previous ATH of 7.15 was faked out to the upside, took the weekly liquidity to the downside, and has now resumed the uptrend.
The immediate ltf upside is at 9. But this chart looks to be heading to ATH.

Mighty Nifty - Oct 23Pattern : Consolidation.
Range : Medium.
Trend strength : Normal.
Buy Above : 19540.
Stop Loss : 19510.
Targets : 19580, 19620 and 19650.
Sell below : 19460.
Stop Loss : 19490.
Targets : 19430, 19400 and 19360.
Check the live market updates.
Hit the like button to Rock !! Show some energy !!
Note : This is my pre market analysis and my trading journal. Not a suggestion to buy or sell.
You are responsible for whatever you do.

Dow Jones Industrial Average Index Projections For 19-Oct-2023
The plotted levels on the attached chart is based on W.D Gann and Astronomical calculations. This idea is only for educational purpose.

Resistance Breakout - NewGen SoftwarePlease look into the chart for a detailed understanding.
Consider these for short-term & swing trades with 2% profit.
For BTST trades consider booking
target for 1% - 2%
For long-term trades look out for resistance drawn above closing.
Please consider these ideas for educational purpose
Please note that, if there are some big targets, those are drawn thinking for long term.

BANKNIFTY Levels for 17th Oct, 2023BANKNIFTY Levels for today
Current Trading Price : 44225
Resistance: 44260
Proposed upside targets if the resistance is broken: 44357, 44466, 44520
Support: 44215
Proposed downside targets if the support is broken: 44125, 44058, 43964
Please consider trades only if the 15m candle sustains at the given levels.
SL (Stop loss) for each trade will be the previous RED candle for BUY trades and previous GREEN candle for the SELL trades.
Note: This idea is only for learning and educational purpose.
Please like if it was helpful to you!

NIFTY Levels for 17th Oct, 2023NIFTY Levels for today
Current Trading Price : 19731
Resistance: 19752
Proposed upside targets if the resistance is broken: 19783, 19834, 19883
Support: 19713
Proposed downside targets if the support is broken: 19671, 19636, 19595
Please consider trades only if the 15m candle sustains at the given levels.
SL (Stop loss) for each trade will be the previous RED candle for BUY trades and previous GREEN candle for the SELL trades.
Note: This idea is only for learning and educational purpose.
Please like if it was helpful to you!


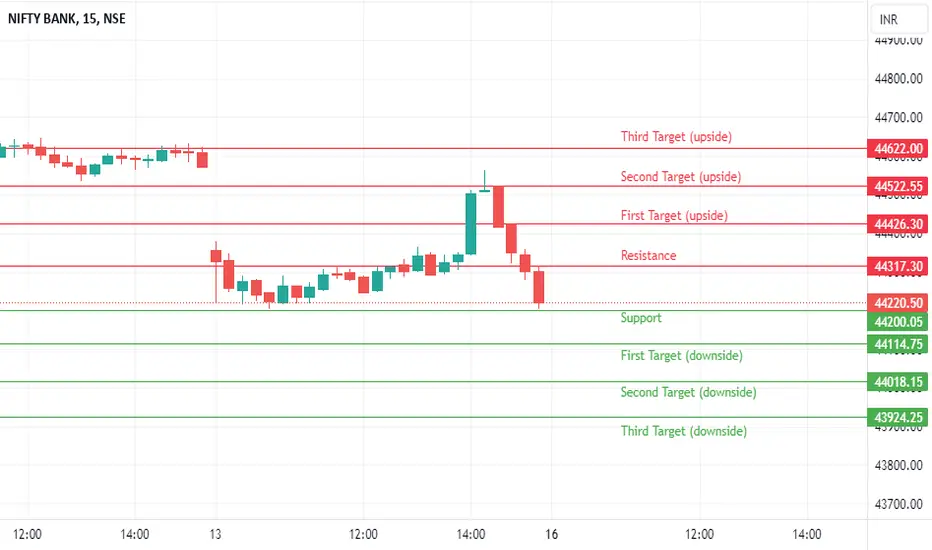
Banknifty Levels for 16th Oct, 2023BANKNIFTY Levels for today
Current Trading Price : 44287
Resistance: 44317
Proposed upside targets if the resistance is broken: 44426, 44522, 44622
Support: 44220
Proposed downside targets if the support is broken: 44114, 44018, 43924
Please consider trades only if the 15m candle sustains at the given levels.
SL (Stop loss) for each trade will be the previous RED candle for BUY trades and previous GREEN candle for the SELL trades.
Note: This idea is only for learning and educational purpose.
Please like if it was helpful to you!
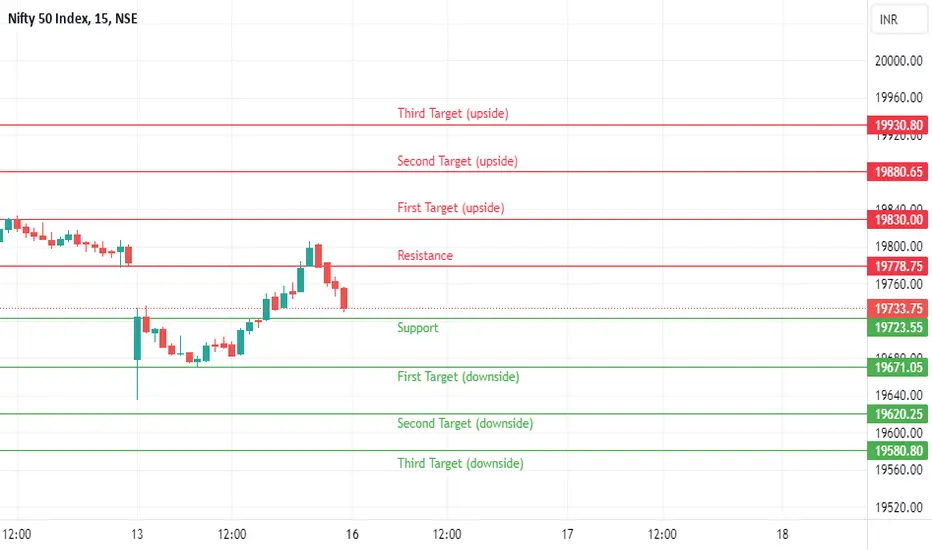
NIFTY Levels for 16th Oct, 2023NIFTY Levels for today
Current Trading Price : 19751
Resistance: 19778
Proposed upside targets if the resistance is broken: 19830, 19880, 19930
Support: 19723
Proposed downside targets if the support is broken: 19671, 19620, 19580
Please consider trades only if the 15m candle sustains at the given levels.
SL (Stop loss) for each trade will be the previous RED candle for BUY trades and previous GREEN candle for the SELL trades.
Note: This idea is only for learning and educational purpose.
Please like if it was helpful to you!
Education price action analysis - Infyweekly 20 EMA 1415
Rolling VWAP 1445
ADX & DI > 25
MACD in buy zone
RSI = no trend..
If in such a trend stock crosses RVWAP.. it should go to next resistance level i.e. 1520/-

Education price action analysis - NIFSELNifty select Future is trading in a range..
Inside bars are getting created..
Upper 9200
Lower 8950
Whichever side it will break and give weekly close
there are good chances of move..
Suddenly volume also increased

Mighty Nifty - Oct 12Pattern : Support/Resistance.
Range : Medium
Trend strength : Good.
Buy Above : 19810.
Stop Loss : 19780.
Targets : 19840, 19880 and 19920.
Sell below : 19750.
Stop Loss : 19780.
Targets : 19720, 19680, and 19640.
Expected expiry day range is 19750 to 19950. Check the live market updates.
Hit the like button to Rock !! Show some energy !!
Note : This is my pre market analysis and my trading journal. Not a suggestion to buy or sell.
You are responsible for whatever you do.

Bank Nifty - Oct 11Pattern : Double top.
Range : Medium
Trend strength : Normal
Buy Above : 44420.
Stop Loss : 44340.
Targets : 44500, 44580, 44700 and 44840.
Sell below : 44260.
Stop Loss : 44340.
Targets : 44180, 44080, 43960, 43840 and 43760.
Expected expiry day range is 43900 to 44700.
Check the live market updates.
Hit the like button to rock !!
Note : This is my pre market analysis and my trading journal. Not a suggestion to buy or sell.
You are responsible for whatever you do.

United spirits fut in consolidation strong pull back from previous swing low of 980 expecting to move towards 1100 level in next 2 weeks with closing bases support 1000

Nifty Futures Swing Trade IdeaHi all - Swing trade opportunity for Nifty 50 in 1h timeframe.
Key Highlights:
1. Long enter after breakout of 19494 on good volume and break the resistance from the gap. It will also trigger shorts unwinding.
2. Bouncing off long term support
3. Good risk to reward but maintain strict stop loss as markets are volatile

mcx Crude oil after a bull run from june 23 lows of 5500 to 7800 levels in September .can see correction in coming month towards 6700-6500 levels .if futures fails to close above 8000 level in next few weeks .so on any rise towards 7800 go short important resistance 8000 on closing bases .

Bank Nifty - Oct 4Pattern : Support
Range : Medium
Trend strength : Normal
Buy Above : 44420.
Stop Loss : 44340.
Targets : 44500, 44580, 44720, 44800 and 44920.
Sell below : 44260.
Stop Loss : 44340.
Targets : 44180, 44080, 44000, 43920 and 43840.
Expected expiry day range is 43900 to 44800.
Check the live market updates.
Hit the like button to rock !!
Note : This is my pre market analysis and my trading journal. Not a suggestion to buy or sell.
You are responsible for whatever you do.

Copper Swing Opportunity Hi All - good opportunity to go long on Copper Futures for short term in 1h chart.
Key Highlights:
1. Bouncing off support zone with good volume
2. Showing good strength
3. Good risk and reward

Education price action analysis - JindalSteelStock is trading in range..
707 upper side
678 lower side
When stock broke a range.. it gives an impluse move..
lets see how the hypothesis played..
