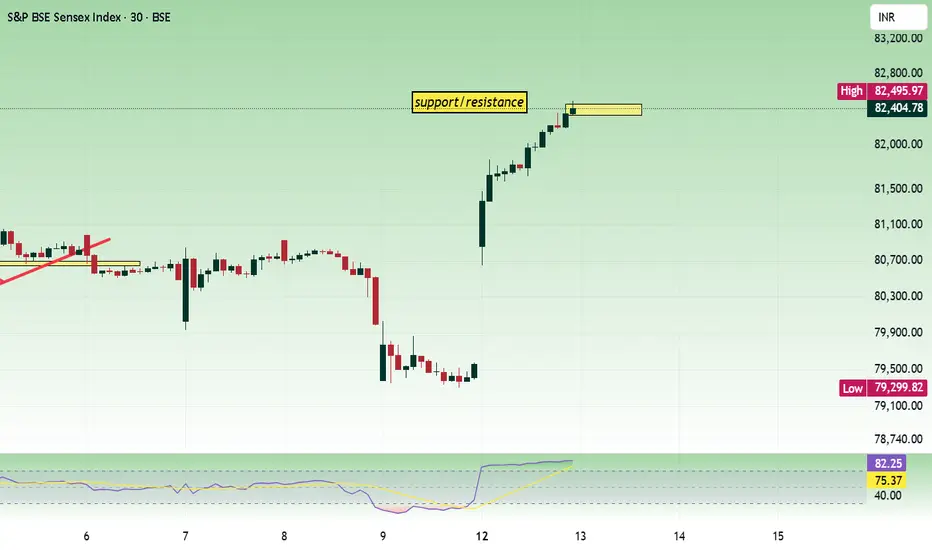
Sensex May 13 expiry day analysisPrice opened gap up and moved up slowly, but with stability. 82500 should sustain to move up further.
Buy above 82540 with the stop loss of 82400 for the targets 82620, 82740, 82850, 82960, 83040 and 83160.
Sell below 82300 with the stop loss of 82400 for the targets 82200, 82060, 81940, 81800 and 81660.
Always do your own analysis before taking any trade.
Search in ideas for "SUPPORTANDRESISTANCE"
#Cyient cash - Looks good around 1200-1220-1230#Cyient cash - Positional call
12 May 2025
Looks good around 1200-1220-1230
Stoploss at 1160
Tgt 1320/1400
Cmp 1254

#Persistent cash - Looks good around 5650-5700#Persistent cash - Long call
12 May 2025
Looks good around 5650-5700-5750
Stoploss 5200
Tgt 6400/7000
Cmp 5833

#Sbin cash - Looks good above 787.10#Sbin cash - Positional call
11 May 2025
Looks good above 787.10
Stoploss 775
Tgt 804-805
Resistance at 805 ..
sustain above 805 tgt 830
Cmp 779

#LT Cash :: Looks good above 3480 levels#LT Cash - Positional call
11 May 2025
Looks good above 3480
Stoploss 3420
Tgt 3540/3600
Cmp 3444

#Siemens cash - Looks good above 3010 #Siemens cash - Positional call
07 May 2025
Looks good above 3010
Stoploss 2900
Tgt 3200/3400/3600
Cmp 2967

#Pantanjali cash - Looks good support 1850#Pantanjali cash - At Support levels
05 May 2025
Looks good support around 1850
reversal level is 1950 for longs target 2100
Cmp 1875

#Dmart cash - At Rising trendline support #Dmart cash -At support
04 May 2025
Dmart at Rising trendline
support at 3950-4000
cmp 4059.20

Nifty - Weekly Review May 5 to May 9Price has formed a strong support at 24250 zone and as long as price sustains above 24200, it is bullish.
Buy above 24240 with the stop loss of 24200 for the targets 24280, 24320, 24380, 24460, 24520, 24580, 24660 and 24720.
Sell below 24140 with the stop loss of 24180 for the targets 24100, 24060, 24020, 23960, 23900, 23820, 23780 and 23720.
Daily chart shows price is moving in a narrow range.
Always do your own analysis, before taking any trade.

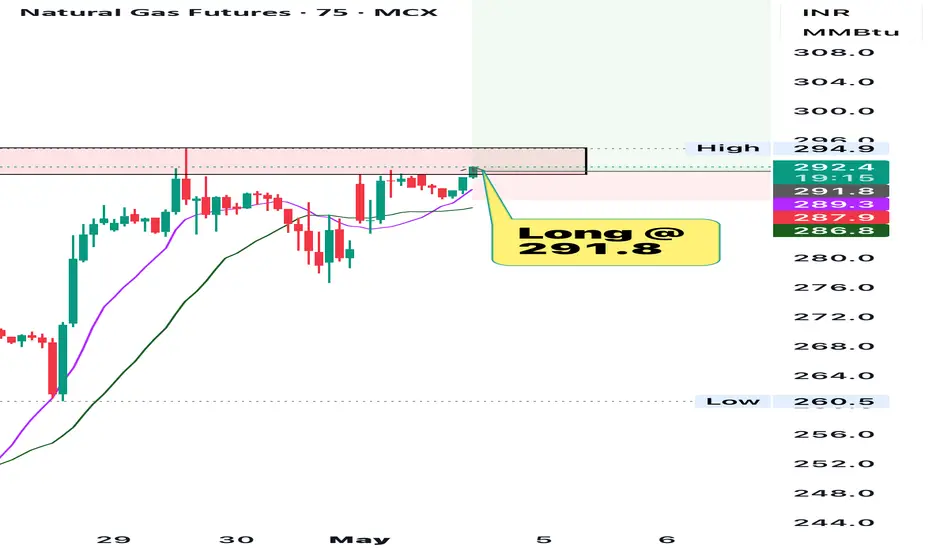
Naturalgas long tradeMCX:NATURALGAS1! Naturalgas long trade just before breakout, this is uptrend continuation trade
#Icicibank cash - Resistance at 1440 and support 1390#Icicibank cash - levels
30-April 2025
Looks
Resistance at 1435-1440
Support at 1390-1400
Cmp 1424.30

#Sonablw cash - Looks good above 501.10#SonaBlw Precision cash -
Positional call
29 April 2025
Looks good above 501.10
Stoploss 480
Tgt 524/544-550
Cmp 491.80


#Hal cash : Looks good around 4350-4360#Hal cash -Positional call
28 April 2025
Looks good around 4350-4360
Stoploss 4250
Tgt 4550/4740/5000
Cmp 4426

Nifty - Weekly Review Apr 28 - May 2Price is testing the important zone 24000. Sustaining above 24100 is important to move up further.
Buy above 24040 with the stop loss of 24000 for the targets 24080, 24120, 24160,24220, 24300, 24380 and 24420.
Sell below 23960 with the stop loss of 24000 for the targets 23920, 23880, 23800, 23760 and 23680.
Always do your own analysis before taking any trade.

#Sunpharma cash : Looks strong above 1821#Sunpharma cash -Positional call
24.April 2025
Looks good or strong above 1821
Stoploss 1780
Tgt 1880-1900
Sustain above 1900 then 1950-1960
Cmp 1803.90

#Divislab cash -Positional long above 6310#Divislab cash -Positional call
Time frame - 3-6 month
24.04.2025
Looks good above 6310 level
& Buy till 6000-6050
Stoploss 5800
Tgt 6950-7100
Cmp 6215.5

#Tataexlsi cash - Looks good Resistance 5700-5750#Tataexlsi cash -Positional call
23 April 2025
Looks good resistance @5700-5750
Once above 5750 target 6400
Cmp 5665

Nifty - Apr 24 analysisPrice has formed a range in between 24120 to 24360. 24120 is acting as a strong support.
If price opened gap up, it have to sustain above 24400.
If opening is flat, buy above 24320 with the stop loss of 24280 for the targets 24360, 24400, 24440, 24480 and 24520.
24500 is an important zone to decide the direction.
Sell below 24240 with the stop loss of 24280 for the targets 24200, 24160, 24120(support zone), 24080 and 24040.
Always do your own analysis before taking any trade.

Sensex - Apr 22 expiry day analysisPrice gave movement in the morning session and consolidated in the afternoon session. 79600 zone is acting as resistance.
Buy above 79520 with the stop loss of 79440 for the targets 79600, 79680, 79800, 79920, 80020 and 80120.
Sell below 79300 with the stop loss of 79400 for the targets 79200, 79120, 79020, 78880, 78760 and 78640.
Always do your own analysis before taking any trade.

#Lici cash -Positional call - Looks good above 826.10#Lici cash -Positional call
21 April 2025
Looks good above 826.10
Stoploss 800
Tgt 866-870/920
Cmp 817.50

#Sbin cash : Looks good above 801.10 and 785#SBIN cash -Positional call
20 April 2025
Head and shoulder pattern
Looks good above 801.10 and dips 782-785
Stoploss 760
Tgt 840/870
Cmp 797

Nifty - Apr 17 expiry day analysis23300 zone acted as support and price gave break out once bulls gained strength and gave a nice break out today. Now price is consolidating at 23400 zone.
Buy above 23420 with the stop loss of 23380 for the targets 23460, 23500, 23540, 23600 and 23640.
Sell below 23300 with the stop loss of 23340 for the targets 23260, 23220, 23180 and 23120.
Always do your own analysis before taking any trade.
