#Jio finance cash : Looks good around 230-235#Jio finance cash
15 April 2025
Looks good around 230-235
Stoploss 222
Tgt 254-255
Sustain n close above 255
will lead much higher
cmp 238.60
Search in ideas for "SUPPORTANDRESISTANCE"

#Hfcl cash : Positive Rsi Divergence in play#Hfcl cash -Positional call
15 April 2025
Add 50% above 83.50
& more above 85.50
Stoploss 76
Tgt 90-92/104
Cmp 82.50

A good consolidation and breakout #DeepakfertiliserNSE:DEEPAKFERT
A good consolidation and breakout....
A logical thing is all fertilizer sector is bullish reason is monsoon is expected in normal time and this will boost the corps and a good rise in fertilizer sectors.

#Maruti cash -Long call above 11550 #Maruti cash -Positional call
10 April 2025
Looks good above 11550
Stoploss 11480
Tgt 11620/11680-11700
Cmp 11480

Sensex - Apr 8 expiry analysisPrice is opening gap down daily and our analysis needs different approach.
Let us see the important support resistance zones to trade.
Support levels 71300 - 71340, 72020 - 72060 and 73000.
How to use this level?
If price open above these levels, then buy above 73060 with the stop loss of 72960 for the targets 73160, 73240, 73360, 73480, 73660 and 73740.
If price open gap down below any of these levels, plan as per the price action.
Always do your own analysis before taking any trade.

Nifty - Ping Pong 22800Price is nearing another support zone 22800. This zone can change the direction too. Near by resistance is 23000.
Buy above 23000 with the stop loss of 22960 for the targets 23040, 23080, 23140, 23180 and 23220.
Sell below 22880 with the stop loss of 22920 for the targets 22840, 22800, 22760, 22720, 22660 and 22620.
Always do your own analysis before taking any trade.

Sensex - Weekly review Apr 7 to Apr 11Price is falling for the past few days and 75200 is an important zone in deciding direction.
Buy above 75400 with the stop loss of 75300 for the targets 74500, 75620, 75700, 75820, 75960, 76040, 76200 and 76320.
If price opens gap down 75000 will act as resistance and price may fall from that zone.
Resistance levels are 75400, 75200 and 75000. Understanding how price is reacting at these levels is important to trade better.
Sell below 75200 with the stop loss of 75100, 74980, 74860, 74700, 74580, 74460, 74300, 74220, 74100 and 73960.
Always do your own analysis before taking any trade.

NIFTY 50 HeikenashiKey support Levels for NIFTY 50 using the 1D Heikin Ashi candle tool.
The First Key level being 22314.70
The Second Key level being 21964.60
Also get glimpses of double top formation although it is not an exact match.

#Patanjali cash : Looks good above 1886#Patanjali cash - Positional call
03 -04-2025
Looks good above 1886
and dips around 1860
(buy dips only if crosses 1886)
Stoploss 1820
Tgt 1980-2000/2200
Cmp 1878

#Bajajfinserv cash -Positional sell below 1910#Bajajfinserv cash -Positional call
01. April 2025
Looks good sell below 1910
Stoploss 1940
Tgt 1876/1840
Cmp 1937

Nifty - Testing an important zonePrice tested the important support/resistance zone 23200 - 23300 and closed below it today. In January, price tested this zone for many days before deciding the direction. I am expecting the price will try to move above the zone. If it sustains above 22300, we can expect some relief rally. If price stays below 23200 zone, then we can expect the move towards 23000 and then to 22800. We have triple bottom support at 22800 zone.
Always do your own analysis before taking any trade.

Sensex - Apr 1 expiry analysisPrice is moving in the range of 77100 to 77800 for the past few days. Price is bullish as long as it sustains above 77100.
Buy above 77120 with the stop loss of 77040 for the targets 77200, 77320, 77400, 77520, 77640, 77800, 77920 and 78040.
Sell below 76960 with the stop loss of 77040 for the targets 76880, 76780, 76700, 76560, 76480, 76380 and 76300.
Always do your analysis before taking any trade.

#Pbfintech Ltd cash - Sell only below 1570 levels#PB Fintech Ltd cash -Positional call
31 March 2028
Looks good sell below 1570
Stoploss at 1620
Target 1520/1470
Cmp 1590

Pottential Retest Support to be formed around 3105$Gold is on sprint to rise high and achieve newer heights. for those who could not enter the rally wait for 3105 levels to breach once and on bounce back re entry can be taken.
If buyers retain control, the next target on the topside is seen at the $3,150 threshold.
Fresh buying opportunities would emerge above that level, opening doors for a fresh uptrend toward the $3,200 round figure.
Technical sell in the Gold price also cannot be ruled out as buyers have already achieved the ascending triangle target, measured at $3,080, last Friday.
Additionally, the 14-day Relative Strength Index (RSI) is trending in the highly overbought region above 75, warranting caution for buyers.
If a correction unfolds, the immediate support is seen at the intraday low of $3,077, below which the $3,050 psychological barrier will be tested.
If the selling momentum intensifies, the March 26 low of $3,012 could come to buyers’ rescue.

Nifty - Weekly review Apr 1 to Apr 4Last week price was testing 23400 zone and sustaining above it. However it has formed resistance at 23600 zone and unable to break it in the last trading sessions. When price is moving within the range 23400 to 23600,there will be tough competition between bulls and bears.
Buy above 23540 with the stop loss of 23500 for the targets 23580, 23620, 23680, 23720 and 23780.
Sell below 23400 with the stop loss of 23440 for the targets 23360, 23320, 23260, 23220, 23180 and 23120.
Always do your own analysis before taking any trade.

Nifty - Expiry analysisPrice broke 23500 today. We are having support at 23400 - 23440 zone. Price have to sustain above this to be bullish.
Buy above 23440 with the stop loss of 23400 for the targets 23480, 23520, 23560, 23620 and 23660.
Sell below 23360 with the stop loss of 23400 for the targets 23320, 23280, 23240, 23200, 23140 and 23100.
Always do your own analysis before taking any trade.

#Grasim cash -Looks good above 2621#Grasim cash -Positional call
26.March 2025
Looks good above 2621
Stoploss 2580
Tgt 2660/2700
Cmp 2581.60

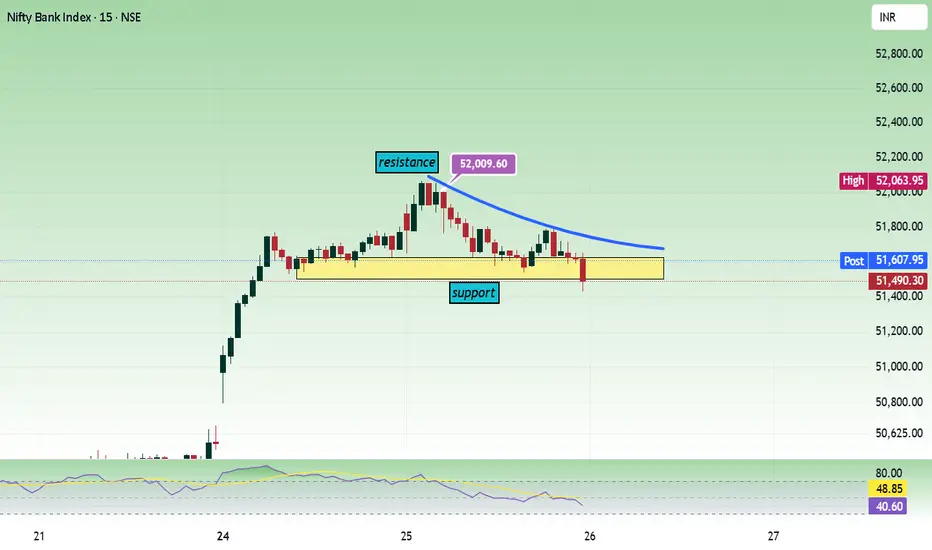
Bank Nifty - Expiry analysisPrice faced resistance at 52000 zone, fall down and now it is testing 51500 support zone. Sustaining above this support is important to be bullish.
Buy above 51540 with the stop loss of 51460 for the targets 51620, 51700, 51820, 51900, 51980, 52060 and 52200.
Sell below 51380 with the stop loss of 51460 for the targets 51300, 51220, 51140, 51040, 50960 and 50820.
Always do your analysis before taking any trade.
Sensex - Expiry day analysisWe had a trending movement today in morning session and consolidation in afternoon session. Now price is testing the important zone 78000. Near by support is at 77600.
Buy above 78040 with the stop loss of 77940 for the targets 78120, 78200, 78320, 78400, 78520, and 78660.
Sell below 77800 with the stop loss of 77900 for the targets 77720, 77600, 77520, 77400, 77320 and 77200.
Always do your own analysis before taking any trade.

#Dixon cash : Looks good if sustain above 14730 levels#Dixon Tech cash - Positional call
24. March 2025
Looks good once sustain above 14730
if any dips 14600-14650
(after crossing 1430 levels)
Target 15200-15250/15750/16400
(Strong resistance 14700-14720)
Cmp 14608

Amara Raja Energy & Mobility LimitedStock is testing multi year resistance.
Possibility of reversal from these levels.
Target - 1700
Sl - 910

Nifty - Expiry day analysisWe had a very narrow range movement, which can give break out or big move once the range is broken. Near by resistance is 23000.
Buy above 22920 with the stop loss of 22880 for the targets 22960, 23000, 23040, 23080 and 23140.
Sell below 22840 with the stop loss of 22880 for the targets 22800, 22760, 22720 and 22660.
Always do your own analysis before taking any trade.

#Icicibank cash : Looks good around 1230-1236#Icicibank cash -Positional call
11 March 2025
Looks good around 1230-1236
Stoploss 1218
Target 1278-1280/1340
(Add more above 1260.10 levels)
CMP 1245.40
