Effect Of GFK Consumer Sentiment Index On EURUSDEURUSD dropped by almost 0.06% as inflation fears increased due to Fed's latest statements.
Possible effects for traders
Today, Germany will release the second assessment of Q4 GDP and the GFK Consumer Sentiment Index. Another important event is the U.S. PCE report for January. Overall, the Fed seems ready to continue further rate hikes, supporting the U.S. dollar.
The EURUSD fell due to high demand for the U.S. dollar and returned to the levels of the year's beginning. The pair remained below 1.06000 within the Asian session, opening a potential for a downside correction to 1.05200. Still, today's economic reports may push EURUSD towards 1.07000.
Search in ideas for "SentiMENT INDEX"

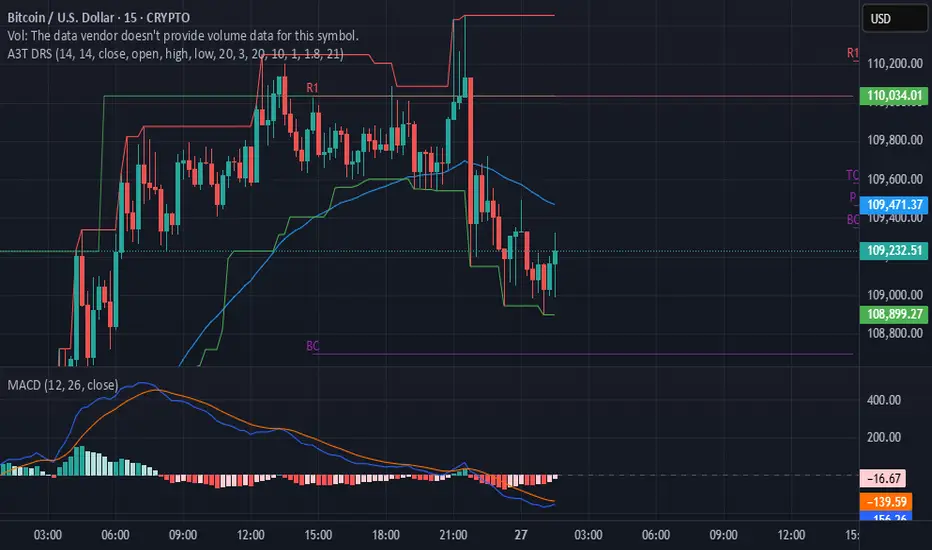
summary of the current Bitcoin sentiment:💰 Price: Around $109,000 (as of May 26, 2025)
📊 Sentiment Index: Greed (73) – Investors are confident and actively buying
📈 Market Trend: Bullish – BTC recently crossed $110,000, showing strong momentum
🏦 Institutional Inflows: ETFs like BlackRock’s IBIT seeing massive investments
⚖️ Regulation: Positive U.S. moves (pro-crypto laws, bipartisan support) boosting confidence
🌍 Macro Support: Weak U.S. dollar and global easing tensions supporting crypto demand
IF u guyes want to support me just follow me for updates
⚠️ Note: Sentiment is high, but the crypto market remains risky and volatile
Let me know if you want predictions or strategy tips too.
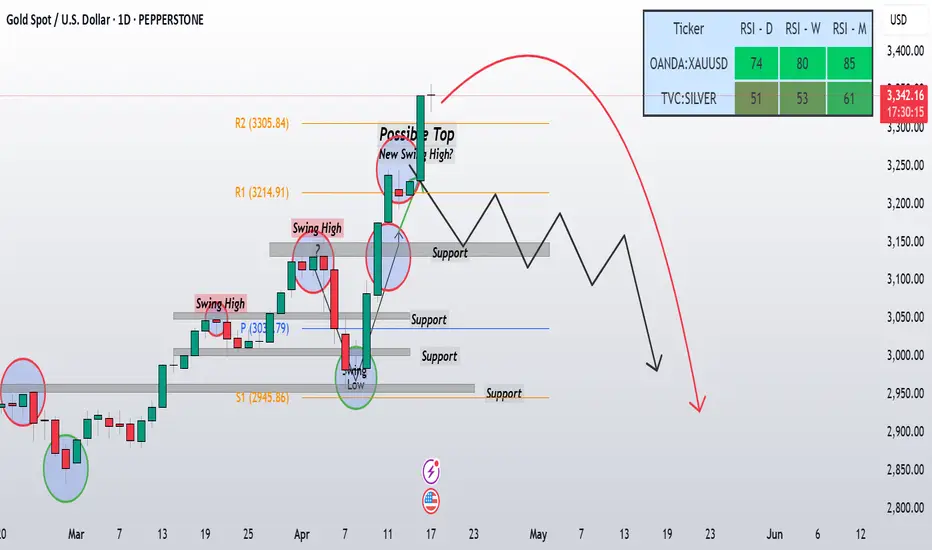
Extreme Sentiment in Metals: Gold & Silver Correction Ahead?In my previous update for this week , Despite my expectation of a correction beginning this week, Gold closed with a 3% gain yesterday, showing amazing strength . The daily chart still reflects an overbought RSI on monthly (85) and weekly (80) timeframes, reinforcing my view that a correction phase is imminent.
While Gold has soared, Silver has lagged, failing to reclaim its late March high. I expect Silver to follow gold during this correction, potentially pushing the Gold/Silver ratio higher to a target of 110-114. The recent upside move in Silver formed an ending diagonal with a powerful throw-over, suggesting exhaustion. For Silver to confirm an uptrend and invalidate the corrective count, it must break above 33.45.
Sentiment levels are at extremes, with the Daily Sentiment Index hitting 83 for Gold and 87 for Silver, indicating overbought conditions that often precede reversals. A major concern is the Dollar Index (DXY), which looks set to make a lower low after forming an triangle on the 1-hour chart. When DXY turns up, metals are likely to face heavy pressure. I believe better entry points for bullish metals positions will emerge after this correction, especially as DXY bottoming process nears.
Despite Gold recent strength, my view remains unchanged —both metals are due for a correction. Gold rally off the April 7 low appears corrective (wave iv) compared to the impulsive wave iii sell-off, and Silver ending diagonal adds to the bearish case.
The lack of daily close confirmation for a correction in Gold hasn’t altered my stance, but I’m watching closely. The DXY anticipated rally could be the catalyst to push metals lower. I’m targeting Gold support at 3,150-3,168 and then 3000 for this correction and Silver critical level at 30.50 as key areas to monitor.
EUR/USD to Tackle Fed Fear and Eye $1.08 on Easing Bank CrisisIt is a relatively busy day ahead for the EUR/USD. ZEW Economic Sentiment figures for Germany and the Eurozone will draw interest today. Following the collapse of Silicon Valley Bank and Signature Bank (SBNY), economic sentiment figures are likely to weaken.
Economists forecast the German Economic Sentiment Index to fall from 28.1 to 17.1 in March, with the Eurozone Economic Sentiment Index to slide from 29.7 to 16.0.
This morning, the EUR/USD was down 0.03% to $1.07144. A mixed start to the day saw the EUR/USD rise to an early high of $1.07260 before falling to a low of $1.07096.
The EUR/USD needs to avoid the $1.0693 pivot to target the First Major Resistance Level (R1) at $1.0755. A move through the Monday high of $1.07308 would signal a bullish session. However, the EUR/USD would need hawkish ECB chatter and better-than-expected ZEW Economic Sentiment numbers to support a breakout session.
In the case of an extended rally, the bulls will likely test the Second Major Resistance Level (R2) at $1.0793 and resistance at $1.08. The Third Major Resistance Level (R3) sits at $1.0892.
A fall through the pivot would bring the First Major Support Level (S1) at $1.0655 into play. However, barring a risk-off-fueled sell-off, the EUR/USD pair should avoid sub-$1.06 and the Second Major Support Level (S2) at $1.0593. The Third Major Support Level (S3) sits at $1.0494.
Looking at the EMAs and the 4-hourly chart, the EMAs send bullish signals. The EUR/USD sits above the 50-day EMA ($1.06562). The 50-day EMA pulled away from the 200-day EMA, with the 100-day EMA converging on the 200-day EMA, delivering bullish signals.
A hold above the 50-day EMA ($1.06562) would support a breakout from R1 ($1.0755) to give the bulls a run at R2 ($1.0793) and $1.08. However, a fall through the 50-day EMA ($1.06562) would bring S1 ($1.0655) and the 200-day ($1.06533) and 100-day ($1.06517) EMAs into play. A fall through the 50-day EMA would send a bearish signal.

What 1-hour chart says?
Fundamental Development:-
Consumer confidence higher among crypto owners than normies
Consumer confidence is considerably higher among crypto owners than the average American adult, with crypto owners sitting 16.4 points higher on the consumer sentiment index. A July 7 report from research firm Morning Consult shows that although average United States (U.S.) adult consumer sentiment has dropped 13.5% since mid-January, confidence amongst crypto owners has held up relatively better, falling only 8.1% over the same period. The research firm said that the discrepancy is partially explained by the fact that the average crypto owner is “more likely to be wealthier, younger and male” than the average U.S. adult. “In recent months, age has been one of the biggest drivers of differences in consumer confidence, as fixed incomes, health risks and memories of past episodes of high inflation in the United States lead older Americans to be more pessimistic,” .The report states that Millennial men who earn at least $100,000 per year are the most likely people to own crypto, though Gen Z adults also show fairly high levels of crypto ownership. Baby boomers and women remain the least likely to hold.
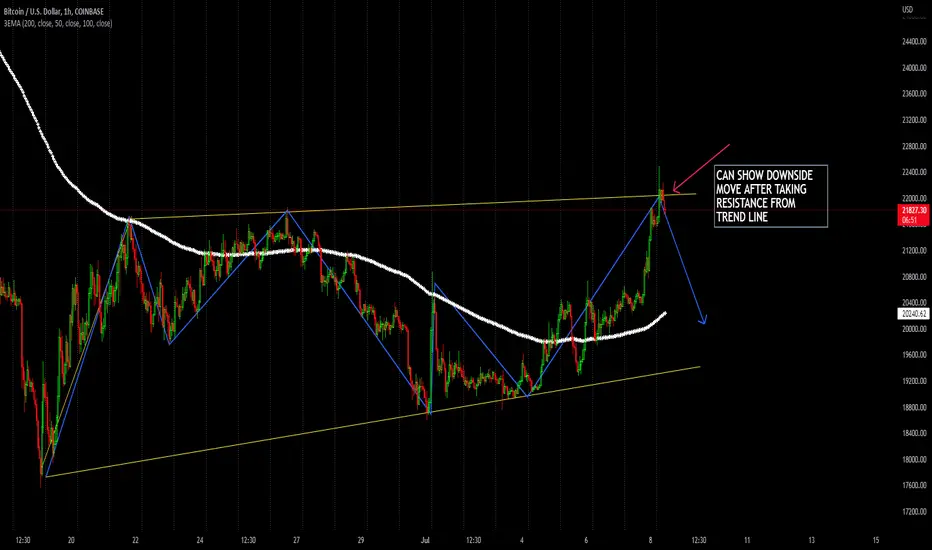
Short Term Technical View: On daily time frame BTC is trading below 200&50 simple moving averages and trading between $21,600-$22,400 ranges.BTC is made low 21,600 and now consolidating within a range. Yesterday it made high near $21,800 and then it continue to climbed up then made big candle with long wick which is showing that today BTCUSD can show downside move. Bitcoin is struggling to gain momentum above $22,500.
Alternative Scenario: If Bitcoin fails to clear the $22,500 resistance zone, it could start another decline. An immediate support on the downside is near the $20,800 level.
GBPJPY appears oversoldThe Congestion Opportunities Strategy has just bought GBPJPY at 144.226. The system recommends entering this trade at any price between 143.942 and 144.51. The signal was issued because the 28-hour Relative Strength Index indicates that the GBPJPY may be oversold, while the Speculative Sentiment Index reading of 1.48 indicates that trader sentiment is not at extremes.The 14-period Average True Range on a daily chart is 1.137, so the stop loss has been set at 143.089. This stop loss order is a trailing stop that will move up as the market moves up. There is no profit target for this strategy. We expect to be closed by the stop loss.Congestion Opportunities is a range trading strategy that aims to sell overbought currency pairs and to buy oversold currency pairs. The strategy will only trade when the Speculative Sentiment Index for that currency pair is between -1.5 and +1.5. Limiting range trading in this way has shown in the past to significantly raise the probability of successful range trades.
Signal ID: 64221
Time Issued: Monday, 11 March 2019 00:00:44 GMT
Status: open
Entry: 143.942 - 144.51
Limit: N/A
Stop Loss: 143.089
CFDs are complex instruments and come with a high risk of losing money rapidly due to leverage. 76.88% of retail investor accounts lose money when trading CFDs with this provider. You should consider whether you understand how CFDs work and whether you can afford to take the high risk of losing your money.

Bulls already positioned in the market This week the market moved exactly the way we studied in last week’s commentary.
We saw everything – Bullish moves, Sell-on-Rise, and even a Shakeout.
If you’ve been following my commentary daily, by now you must have realized that the market can be predicted with good accuracy. You can know when to trade and make money and when not to trade so you can avoid unnecessary losses.
The only condition is – you must have a strong will to learn.
If you keep thinking the market is “too difficult to understand”, it will always feel difficult. Change your perspective. Once you know what to look for, everything starts making sense right in front of your eyes.
Now let’s talk about the market.
Just as we planned, this week played out exactly the same. That means the environment is very good.
On Friday, Nifty held strong in the first half but then slipped in the second half. It couldn’t hold above 24800, which was an important resistance. Until Nifty closes above 24800, we will continue to see volatility and shakeouts.
Remember – volatility and shakeouts usually mean institutional players and big money are quietly building positions. They create this “noise” so you can’t see their footprints.
You don’t have to fear this volatility. Instead, find stocks where positions are being built. Focus on sectors showing relative strength or absorbing volatility while charts are showing demand building up.
One such sector is #Finance. I’ll be sharing good swing setups from this space in the swing group today.
Now, let’s analyze Nifty for the coming week:
1. On Friday, buyers’ volume was 6 million higher than sellers.
2. Nifty broke 24650 support and then closed above it – meaning both bulls and bears’ liquidity got absorbed = Shakeout.
3. Resistance of 24950 got broken = path cleared for upside.
4. Sentiment index closed higher compared to last week.
5. Nifty’s Pivot is at 24731 and the index already closed above it.
6. Pivot Percentile is just 0.04 = sharp momentum ahead.
7. Nifty OI buildup is positive = options liquidity is coming in.
So, overall, almost all points are positive. But the key level remains 24800. Until we get a strong closing above it, we shouldn’t build aggressive longs. Even last week, despite positive GST news, we couldn’t close above this level. That’s why Sell-on-Rise is still possible.
However, if today the index opens gap-up above 24777 and breaks 24800, then we can see a sharp move to 25025.
BankNifty also shows positive OI buildup. If it breaks 54500 resistance, then in the next 1–2 weeks we can see a move up to 56600.
For now, focus more on Financials and Auto Parts sector. I’ll share specific stocks in the swing group.
That’s it for today. Take care and have a profitable week ahead.
📊 Levels at a glance:
NSE:NIFTY Pivot: 24731
Support: 24650 / 24700
Resistance: 24800 → 25025 (if breakout)
Pivot Percentile: 0.04 (indicates sharp move)
Bias: Bullish but cautious till 24800 breaks
NSE:BANKNIFTY Support: 53500
BankNifty Resistance: 54500 → 56600 (if breakout)
BankNifty PP: 0.17% (scope of sharp move)
Sectors on Radar: Financials, Auto Parts
That's all for today. Take care. Have a profitable day ahead.

Gold: Bulls seek $2,647 breakout and US data validationGold prices continue to recover after the US inflation data, despite staying within a two-week bearish trend. Early Friday, buyers look forward to the first readings of the University of Michigan Consumer Sentiment Index and Consumer Inflation Expectations for October, along with the September Producer Price Index (PPI).
Bulls brace for fresh record high
Whether it's the US Dollar's muted reaction to better-than-forecast Consumer Price Index (CPI), optimism around potential stimulus from China, or expectations of softer US data, gold prices aim for a fresh all-time high. Technically, the recent breakout above the 100-SMA, bullish MACD signals, and a positive RSI (14) reinforce the upward momentum.
Technical levels to watch
Among the key technical levels, $2,647 gains immediate attention as it comprises the top of the bearish channel, a break of which will defy the fortnight-long bearish chart pattern. Following that, the precious metal’s quick jump toward the all-time high surrounding $2,685 can’t be ruled out. Moreover, a clear breakout past $2,685 would signal strong momentum for gold buyers, potentially paving the way for a rise beyond the $2,700 mark.
On the downside, the 100-SMA at $2,636 provides immediate support for gold prices, alongside an upward-sloping trend line from early August near the $2,600 mark. If XAUUSD falls below $2,600, the focus will shift to the bottom of the bearish channel and the 200-SMA, which are near $2,595 and $2,580, respectively. Notably, if prices break below $2,580, gold could enter a short-term bearish trend, potentially targeting the $2,540-$2,530 range.
Upside looks promising
With expectations of lower Fed rates and potential softness in upcoming US data, combined with bullish technical indicators, gold prices seem poised for upward movement. This bullish outlook could change only if the US statistics challenge the likelihood of two more rate cuts from the Federal Reserve, which would negatively impact the US Dollar—an outcome that appears unlikely.

XLMUSDT breaking out Flag Patter 5th WaveTechnical Analysis:
1. Backtesting within 7 days shows no clear patterns for MACD, RSI, BOLL, and KDJ indicators.
2. Backtesting within 30 days also does not show any clear patterns for MACD, RSI, BOLL, and KDJ indicators.
3. The current BOLL support price is $0.1201 and the resistance price is $0.1231.
Fundamental Analysis:
1. Stellar (XLM) is an open network that aims to facilitate the movement and storage of money.
2. The native token of the Stellar network is called lumens.
3. Stellar aims to boost financial inclusion and enable financial firms to connect with each other through blockchain technology.
4. The total token supply is 50,001,802,942 XLM, with a circulating supply of 23,404,278,684 XLM.
5. The current market cap of Stellar is $3,506,513,084.
6. The current price of XLM is $0.12226, with a 24-hour price change of +2.34% and a 7-day price change of +6.21%.
7. The trading volume for today is $3,232,809.16.
Market Sentiment:
1. The Market Sentiment Index is 82, indicating extreme greed.
Based on the technical analysis, there are no clear patterns indicating a specific trend for XLM within the past 7 days or 30 days. However, the current BOLL support and resistance prices can be used as reference levels.
Considering the fundamental analysis, Stellar aims to revolutionize the financial industry and enable cost-effective cross-border asset trading. The market sentiment is currently indicating extreme greed.
Please note that this analysis is based on the provided data and does not take into account any external factors or future events that may impact the price of XLM.
Risk Disclosure: Predictions are for reference only, not investment advice. Investing involves risks; please make decisions cautiously

XAUUSD Daily Analysis On Friday, the highly-anticipated US Nonfarm Payrolls (NFP) rose by 199K in November from the previous reading of 150K. Additionally, the Unemployment Rate declined to 3.7% from 3.9% in the previous reading. Average Hourly Earnings held steady at 4.0%, matching market expectations.
Finally, the preliminary University of Michigan Consumer Sentiment Index for December came in at 69.4 versus 61.3 prior. In response to the data, the US Dollar Index (DXY) rose to 104.25 and the US Treasury yields edged higher, with the 10-year yield climbing from 4.15% to 4.28%.
The Fed will announce the interest rate decision on Wednesday.... its last meeting of the year. The markets anticipate no change in rates for its December meeting and think the dot plot will come down. Nonetheless, the market lowered its expectations for the first-rate cuts from March to May after stronger employment data
The firmer US Dollar (USD) and the concern about China’s deflation create a headwind for the gold price. On Saturday, the National Bureau of Statistics of China revealed that the nation’s Consumer Price Index (CPI) dropped 0.5% YoY in November from a 0.2% decline in October, worse than the market expectation of 0.2%. The Producer Price Index (PPI) declined 3.0% YoY in November from a 2.6% decline in October, below the market consensus of a 2.8% decline in the reported period.
Looking ahead, market players will monitor the US Consumer Price Index (CPI) on Tuesday. The spotlight will be the Federal Open Market Committee (FOMC) meeting, held on Tuesday and Wednesday. On Technical side price is currently trading under Daily , Weekly and Monthly pivot which is good for bears on Intraday and bulls need good confirmation from lower support levels (1978 :fib 0.50 Level) or daily candle need to be close above daily pivot average

Accumulate and then hit 3500 soonPlan XAU next week: 16 June - 20 June 2025
Related Information:
Recently, US President Trump told Axios that Israel’s attack could help him reach an agreement with Iran. He urged Iran to make a deal, adding, 'There has already been great death and destruction, but there is still time to bring this slaughter to an end, with the next planned attacks expected to be even more brutal.'
The University of Michigan (UoM) Consumer Sentiment report for June showed that households are becoming more optimistic about the economy. The Sentiment Index increased from 52.2 to 60.5, while inflation expectations declined for both the one-year and five-year outlooks—from 6.6% to 5.1%, and from 4.2% to 4.1%, respectively.
personal opinion:
Gold prices will tend to accumulate at the beginning of the week around 3400, news of Middle East tensions will push gold prices back to 3500 by the middle of next week.
Important price zone to consider :
sell point: 3500, 3536
buy point: 3410, 3376
Sustainable trading to beat the market

DOW JONES - Future Cautious Rebound May Precede Fresh DowntrendNote: Cautious Rebound May Precede Fresh Downtrend
Timeframes Observed: Daily & Weekly
Date: 8th April 2025
🔍 Technical Chart Analysis Overview:
The index has posted a short-term rebound from a key oversold zone, with today’s candle closing as a bullish inside bar (or substitute with actual candle type if known: e.g., "small-bodied bullish candle with long upper wick") on the daily timeframe.
This bounce aligns with the 38.2% Fibonacci retracement level, plotted from the recent swing high to the latest swing low. However, price has failed to close above the 20-day EMA, indicating weak follow-through momentum.
On the weekly timeframe, the trend remains under pressure. The recent uptick resembles a bearish flag or corrective structure, with volume tapering off — a classic sign of distribution within a downtrend.
📌 Key Observations:
RSI on both daily and weekly charts is recovering from oversold territory but remains below 45, suggesting momentum is not supportive of a sustained rally.
MACD histogram continues to print below the zero line, reinforcing a bearish bias.
Volume analysis indicates the rebound lacks conviction, with lower-than-average buying pressure during the pullback.
🗓️ Macro Catalyst Watch (Next 7 Trading Sessions):
Upcoming releases:
U.S. CPI Inflation Data
Consumer Sentiment Index
FOMC Commentary / Fed Rate Expectations
These may act as high-impact triggers, potentially dragging the market toward the next Fibonacci level at 61.8% retracement, or even to prior swing lows, if data disappoints.
⚠️ Conclusion & Strategy Note:
While the market is exhibiting a temporary rebound, this appears to be a technical retracement within a larger bearish structure. We maintain a cautious stance and do not recommend aggressive long positions at current levels.
🔽 Preferred Tactical Bias:
Watch for rejection near resistance zones (20 EMA, 50% Fib level).
For HFTs Short opportunities may arise on confirmation of a bearish reversal candle or failure to hold above today's high & people may get stuck.
Maintain risk-defined positions ahead of macro data events.

USDJPY rebounds from 157.80-75 support confluence, US data eyedUSDJPY pares the biggest daily loss in 10 weeks early Friday as traders await more clues for easing price pressure in the US, namely preliminary readings of the University of Michigan’s (UoM) Consumer Sentiment Index (CSI) and Consumer Inflation Expectations for July. It should be noted that a one-year low of the US Consumer Price Index (CPI) drowned the Yen pair the previous day while mixed Japan statistics and the market’s consolidation favored the quote’s latest recovery. That said, a convergence of the 50-SMA and bottom line of a 2.5-month-old rising wedge bearish chart formation, around 157.80-75, recently triggered the pair’s rebound as RSI took a U-turn from the below-50 zone. However, bearish MACD signals could join the 160.20-30 region comprising highs and lows marked since April to challenge the bulls before directing them to the fresh high since 1986, which in turn highlights the aforementioned wedge’s top line surrounding 162.25.
On the flip side, the USDJPY pair’s inability to defend the latest rebound will shift focus back to the 157.80-75 key support. Following that, an upward-sloping trend line support from late December 2023, close to 157.30 at the latest, will be the last defense of the buyers. In a case where the Yen pair remains bearish past 157.30, its subsequent fall to the previous monthly low near 154.50 and then to May’s bottom surrounding 151.85 can’t be ruled out. That said, the 150.00 psychological magnet will be the final post for the sellers to conquer ahead of gaining the throne.
To sum up, USDJPY remains in a bullish trajectory despite the previous day’s heavy fall. The downside move needs validation from 157.30 and the US/Japan fundamentals.

NIFTY: SIP SIP Hurray!It is nearly a month of absence from writing, markets continue to do what the charts dictate.
The divergence that continued to appear in various spaces finally started yielding, we printed the evening star (marked by the arrow). We are almost flat for the year save 300 points on the nifty, not absorbing the nominal returns forget about the costs of buying.
The damage is more in the small and mid-caps. While the headlines and narratives say SIP continue to hit highs, the rush for the ownership has limitations, too much of anything is injurious to the markets. While bear markets have often moved in V shape (not a mandatory, if one does not know ask Japanese investors).
With Elections on the cards, there is little incentive for the markets or the fund managers to aggressively push one way or the other, save the year end targets that is churned and shunned.
Asian Central Bankers in action, move over the west welcome the east. BOJ decision later in the day assumes greater significance, NIKKI publishes end of the low interest rates, one has to wait and see the details. Then comes the RBA Rate decision.
China without much of the fiscal moves improved some of the economic numbers, the currency gets some realignment. We don't see too many calls or expectations of rate cuts. Select commodities are on their zone of confidence.
Gold and Silver move out of the recent ranges, while they try and penetrate for further gains. Crude is all set to spoil the party. Willingness for cuts, attacks on Russian spaces, (call for Putin peace moves gets unnoticed), less gloomy economic landscape are all the reasons.
US Housing starts, Europe sentiment index, Canada Inflation are the focus in Europe and US sessions. The Yield continue to elevate, ahead of FOMC there is little to expect than the pressers.
For our Index, 21230 holds while 20850 attracts, break of to dictate, bears hold the edge than the bulls, a direct attack below 21900 on hourly close basis pushes the space towards the 21500 area. Short below 21230 above that wait for the ability to close.

SKLUSDT looking bullish above breakoutSKLUSDT refers to the trading pair between SKALE Network's native token (SKL) and the stablecoin Tether (USDT) on a cryptocurrency exchange. SKALE Network is a blockchain platform that aims to provide high-performance decentralized applications (dApps) and smart contracts. The SKL token is used within the SKALE Network for various purposes such as staking, payments for network services, and governance.
Trading pairs like SKLUSDT allow users to trade SKL tokens directly for USDT, providing liquidity and facilitating price discovery on exchanges that support this pair. Investors and traders can use this pair to speculate on the price of SKL relative to the stability of USDT or to hedge their positions.
Technical Analysis:
1. Backtesting within the last 7 days and 30 days shows that there are no specific patterns observed in the MACD, RSI, BOLL, and KDJ indicators. This indicates a lack of clear trend or momentum signals during these periods.
Fundamental Analysis:
1. SKALE (SKL) is a cryptocurrency launched in 2020 and operates on the Ethereum platform.
2. The current supply of SKL is 5,447,166,667 tokens, with 5,156,686,004 tokens in circulation.
3. The market capitalization of SKL is $419,969,192.29.
4. The current price of SKL is $0.08106, with a 24-hour price change of +1.41% and a 7-day price change of +13.1%.
5. The trading volume in the last 24 hours is $396,604.08.
6. The BOLL support price is $0.07864, and the BOLL resistance price is $0.08417.
Market Sentiment:
The Market Sentiment Index is at 74, indicating "Greed" sentiment.
Based on the technical analysis, there are no specific patterns observed in the indicators within the last 7 days and 30 days. Therefore, it is difficult to determine a clear trend or direction for SKLUSDT.
Considering the fundamental analysis, SKL has a relatively low market capitalization and trading volume. The recent price change has been positive, indicating some potential interest in the token.
It is important to note that the provided data does not include specific news content. Therefore, it is recommended to gather additional news and information about SKL from reliable sources to make a more informed decision.
Risk Disclosure: Predictions are for reference only, not investment advice. Investing involves risks; please make decisions cautiously.

XEEUSDT Long above breakoutBased on the data provided, here is a 1-month analysis of ECash (XEC):
From 2023-12-30 to 2024-01-29, the price of XEC decreased by 17.99%. The open price was $0.00003746, and the close price was $0.00003072. The BOLL support price was $0.0000288, and the BOLL resistance price was $0.0000347.
During this period, there were two notable technical indicator patterns:
1. On 2024-01-03, the MACD indicator showed a Death Cross pattern, and the price decreased by 10.38%.
2. On 2024-01-26, the KDJ indicator showed a Golden Cross pattern, and the price increased by 3.71%.
In terms of current technical indicator patterns, within the past 7 days, there are no significant patterns observed for MACD, RSI, BOLL, and KDJ. Similarly, within the past 30 days, the MACD indicator has shown a bearish pattern (Death Cross) six times, with a 50% accuracy rate. However, there are no significant patterns observed for RSI, BOLL, and KDJ.
Considering the market sentiment index, which is currently at 55 (Neutral), there is no extreme fear or greed sentiment prevailing in the market.
In terms of news, on 2024-01-11, the SEC approved the listing of 11 Bitcoin ETFs, which led to increased interest in Ethereum and its ecosystem tokens. This may have influenced the market dynamics during the analyzed period.

STORJUSDTBased on the available data, the current price of STORJ is $0.637 with a 24-hour price change of +4.37% and a 7-day price change of +12.89%. The token's total supply is 424,999,998, and the circulation supply is 385,770,354.
In terms of technical indicators, within the past 7 days, the MACD pattern is bullish with a Golden Cross occurring 10 times. However, the accuracy of the MACD signal is 40%. The BOLL pattern is bearish with a Lower Band Touch occurring 7 times, and the accuracy of the BOLL signal is 42.86%. The RSI and KDJ indicators do not show any specific patterns within this timeframe.
Over the past 30 days, the MACD pattern is bearish with a Death Cross occurring 9 times. The accuracy of the MACD signal is 55.56%. The BOLL pattern is also bearish with a Lower Band Touch occurring once, but the accuracy of the BOLL signal is 0%. The RSI and KDJ indicators do not show any specific patterns within this timeframe.
The funding analysis indicates that Major Whale Traders have a bullish position direction, with a long/short ratio of 3.57.
According to the Market Sentiment Index, the sentiment is currently at 55, which represents a neutral sentiment.
Based on the provided news, there is no specific information regarding STORJ. However, if you have any specific questions or require further analysis, please let me know.
Risk Disclosure: Predictions are for reference only, not investment advice. Investing involves risks; please make decisions cautiously.

Daily Macro, Market Mood Swings, & the Stories Behind the NoiseThe Stale Jobs Report Nobody Asked For
The much-delayed US September jobs report finally arrived yesterday —only to reveal that its insights are about as fresh as leftovers forgotten in the office fridge. Not only are the numbers too “stale” to be useful, but even if we pretend they’re not, the report still refuses to shed meaningful light on where the labor market actually stands. In short: lots of data, very little enlightenment, and definitely no peace treaty for the Federal Reserve’s ongoing internal policy debate.
Shutdown Fog and the Market Mood Swing
Adding to the confusion, the BLS has now said the November NFP print won’t drop until after the December FOMC meeting. Combine that with a government-shutdown haze apparently scheduled to lift sometime in 2026, and markets did what markets do best—panic elegantly. US equities went from hopeful green to tragic red faster than you can say “data dependency.”
Fed Officials: United in Caution, Divided in Direction
With just weeks until the Fed’s final meeting of the year, policymakers are broadcasting a delightful mix of caution, hesitation, and the occasional rate-cut cheerleading. Goolsbee, Hammack, and Cook are all expressing varying shades of “let’s not rush this,” while Waller is enthusiastically waving the December-cut flag. The collective mood reinforces Powell’s recent reminder that a December cut is “not a foregone conclusion,” and judging by the chatter, the “no” camp seems to be gaining momentum.
The Dollar Puts on Its Superhero Cape
Meanwhile, the US Dollar is out here having a fantastic week. Fuelled by fading expectations of a December Fed rate cut—and boosted by a surprisingly strong September NFP reading showing 119K new jobs—the Greenback marched to six-month highs. The DXY even broke past the 100 mark, flexing its muscles despite falling Treasury yields
A Data-Packed Day Ahead
If all that wasn’t enough, today’s global data calendar is busier than a central banker at a press conference. We’ve got PMI prints from the Eurozone, UK, and US; UK retail sales; ECB President Lagarde holding court; and a parade of Fed speakers including Williams, Barr, Jefferson, and Logan. Throw in the U-Michigan Consumer Sentiment Index, and you’ve got a full economic buffet—with plenty of opportunities for markets to overreact yet again.

A daily Market WrapMarket Mood: Mildly Moody
US equities hit a speed bump as the dollar tripped for the second day running. Treasury yields, which had shot up recently, cooled off slightly—though the 10-year looks like it’s eyeing another climb. Precious metals made a modest comeback, thanks to the softer dollar, but not enough to justify breaking out the champagne (maybe a half-smile at best). Oil, meanwhile, slid to a two-week low, and Asia decided to keep things boring with flat equities and currencies
America’s Political Soap Opera: Shutdown, Season 2
US assets are looking fragile, and the biggest villain is the government shutdown, now so long it deserves its own Netflix series. With Republicans and Democrats locked in a staring contest, government functions are grinding to a halt and the economic fallout is starting to bite.
To add to the drama, Democrats scored sweeping wins in local elections, and President Trump is blaming the shutdown for the Republican stumble. The big question: will this political stalemate finally turn into a compromise, or will Washington keep playing chicken with the economy?
Corporate Reality Check: Layoffs Ahead?
In a less-than-cheerful headline, US firms announced the highest number of job cuts for any October in over 20 years. The culprits: AI efficiency drives, cautious consumers, tighter corporate budgets, and rising costs.
Economists warn this could flip the labor market from today’s “low hire, low fire” equilibrium to a much scarier “low hire, high fire” one—basically, fewer jobs and more pink slips.
Central Banks: The Brits Blink First
Across the pond, the Bank of England played it safe, keeping rates unchanged in a tight 5–4 vote. The Bank noted that inflation has “peaked,” subtly hinting at future cuts. In plain English: the BoE is done fighting inflation and may soon start fighting recession fears.
The move wasn’t a surprise, but the dovish tone was softer than expected—like a stern teacher suddenly saying, “Alright, you’ve learned your lesson.”
On Deck: US Data & Fed Chatter
Today’s economic lineup features the University of Michigan’s Consumer Sentiment Index and the New York Fed’s Consumer Inflation Expectations survey—two handy barometers for how optimistic (or not) Americans are feeling about prices and paychecks.
Adding to the noise, Fed officials Williams, Jefferson, and Miran are scheduled to speak. Expect markets to hang on every word, as if one of them might accidentally say “rate cut.”
India Watch: Trade Talks & Banking Tweaks
Back home, Commerce Minister Piyush Goyal said that India–US trade negotiations are “going very well”, though several “sensitive and serious” issues remain. Translation: progress, but not quite popcorn-worthy yet.
Meanwhile, the RBI kept its steady hand on the rupee, continuing its interventions to avoid any wild FX swings. The RBI also reaffirmed its cap on voting rights for large bank shareholders, a reminder that no matter how big you are, in Indian banking, you still don’t get to call all the shots.

huge increase, positive gold marketXAU / USD trend forecast JUNE 13, 2025
⚠️On the trade front, US Commerce Secretary Howard Lutnick announced on Wednesday that the United States and China had reached a preliminary framework agreement. However, the deal still requires formal approval from both President Donald Trump and Chinese President Xi Jinping.
Looking ahead this week, market participants will turn their attention to the University of Michigan’s (UoM) Consumer Sentiment Index for June. In the following week, the spotlight will shift to the Federal Reserve’s monetary policy meeting scheduled for June 17–18.
⚠️ Gold price reacted strongly when war broke out, Iran vs Israel conflict. The market is FOMO bullish, actively heading towards 3490
🚨/// BUY XAU : zone 3423-3420
SL: 3415
TP: 50 - 100 - 300pips ( 3450 )
Safe and profitable trading

Gold -> How Long Will the Adjustment Last? Emphasis on $2,600Hello, dear friends!
Gold (XAU/USD) extended its recovery early this week, reaching the critical $2,600 mark and ending a six-day losing streak after a false breakout and a retest of $2,546. This rally has been fueled by escalating geopolitical tensions as the U.S. authorized Ukraine to use long-range weapons to strike Russia.
However, the market remains under significant pressure. The USD and bond yields continue to rise, while the Federal Reserve maintains a hawkish stance. Economic struggles in Europe are weakening the euro, driving demand for the USD and further weighing on gold.
This week, the gold market is expected to remain subdued with limited major economic data releases. Key areas to watch include U.S. housing data, the University of Michigan Consumer Sentiment Index, and comments from Federal Reserve officials.
Gold is currently testing the critical resistance zone at $2,600–$2,589. A false breakout here could trigger strong selling, reinforcing bearish momentum. Conversely, a modest pullback followed by a decline to $2,546 would solidify a clearer downtrend. Keep a close watch!

Rising wedge portrays EURUSD buyer’s exhaustion ahead of US dataEURUSD is bouncing back after a big drop, as traders wait for the University of Michigan’s Consumer Sentiment Index and Inflation Expectations for August. This bounce reverses the previous day’s decline from the highest level of 2024 and moves off the bottom of a four-week bearish chart pattern called rising wedge. The RSI indicates that the recent price increase might continue, but the MACD suggests weakening buyer interest. For sellers to take control, they need to break below the wedge’s bottom line at around 1.0960 and the 50-SMA support at 1.0946. If they succeed, they might face challenges at the 200-SMA and an upward trend line near 1.0875 and 1.0830, respectively. After that, the price could drop toward the wedge’s theoretical target of around 1.0700.
On the other hand, the 1.1000 level is attracting buyers, with the recent high of 1.1050 in sight. The top line of the wedge near 1.1055 could also act as resistance. Future resistance points include December and July 2023 highs near 1.1140 and 1.1275, and the 1.1200 level might provide a resting point for buyers.
Overall, the EURUSD pair is struggling to gain momentum in a bearish pattern ahead of US economic data. Sellers need confirmation from both technical and fundamental factors to take control.

EURUSD bulls keep control ahead of ECB Minutes, US dataEURUSD pares the biggest daily gains of the week while posting mild losses early Friday. Even so, the Euro pair remains on the way to posting a four-week uptrend as traders prepare for the European Central Bank (ECB) Monetary Policy Meeting Accounts, also known as the ECB Minutes, as well as the preliminary readings of the US UoM Consumer Sentiment Index and Inflation Expectations. It should be noted that upbeat RSI and MACD conditions keep the buyers hopeful but a downward-sloping resistance line from early March, close to 1.0790 at the latest, guards the immediate upside of the pair. Apart from the oscillators like RSI and MACD, the looming “Golden Cross”, a bullish moving average crossover, also keep the buyers hopeful. However, a clear upside of the 5.5-month-old descending resistance line, near 1.0825 as we write, becomes necessary for the bulls to retake control. In that case, the gradual run-up toward March’s high of 1.0980 and then to the 1.1000 threshold can’t be ruled out.
Meanwhile, a pullback move remains uninteresting beyond the 50-SMA support of 1.0735. Following that, the lows marked in April and February, respectively around 1.0725 and 1.0695, could test the EURUSD bears before directing them to the yearly low marked in April around 1.0600. It’s worth noting that the Euro pair’s sustained weakness past 1.0600 makes it vulnerable to challenge the previous yearly bottom surrounding 1.0450-45 but the same needs validation from the strong US fundamentals, as well as downbeat EU catalysts.
Overall, EURUSD bulls are likely to retake control after staying off the grid for some time.
However, the fundamentals need to back the pair’s bullish technical details to support the upside bias.
