Good buying spot with proper IDMAs it has taken IDM, it is ready upside moment. And as xrp is moving it will also move up

XLM - From the legendary storyFrom the legendary story
XLM has completed the correction wave, and is accumulating wave 1 to make 3 jumps to conquer the new ATH at the $1.4 mark. This price target is easily broken by long waves in the near term. Famous for its stubbornness and slow growth, this will be a trading code that challe

XLMUSDT breaking out Flag Patter 5th WaveTechnical Analysis:
1. Backtesting within 7 days shows no clear patterns for MACD, RSI, BOLL, and KDJ indicators.
2. Backtesting within 30 days also does not show any clear patterns for MACD, RSI, BOLL, and KDJ indicators.
3. The current BOLL support price is $0.1201 and the resistance price is $0.1

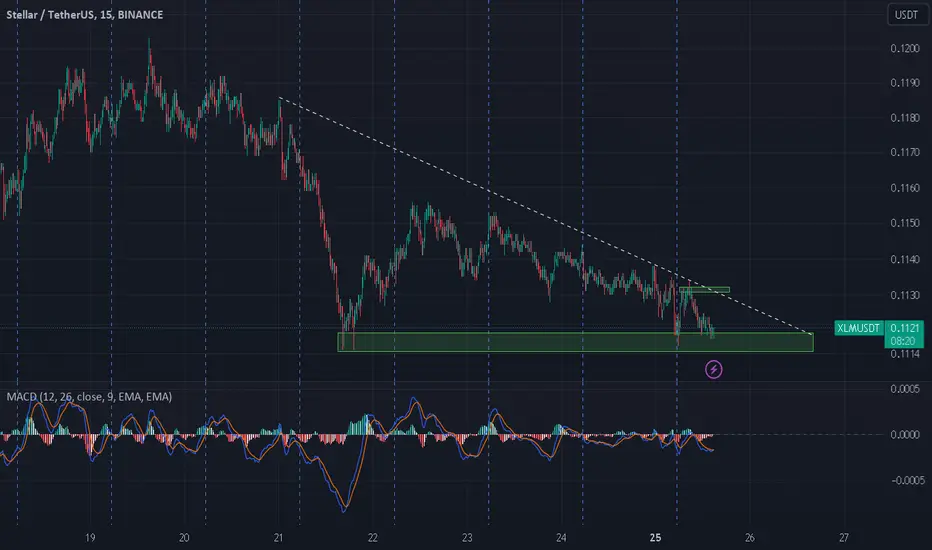
XLMUSDT : SUPPORT ZONE 💰#XLM.USDT reached the Daily support zone again but bears are strong yet,we expect will dump more in future..📉
XLM/USDT- Potential Bounce Supported by Strong Confluence ?
In this XLM/USDT technical analysis, we'll explore the key factors supporting a potential bullish bounce for Stellar Lumens (XLM) against the US Dollar (USDT).
Buying/Support Area - 0.1300:
The XLM/USDT pair has established a robust buying/support area at the 0.1300 level. This level has historic

XLMUSDT Long Trade Setup!!Hello Everyone, If you are reading my chart for the first time then follow for more simplified charts on spot, margin, and futures.
Let's take a quick update on XLMUSDT. It looks like breaking out in 4Hr TF perfectly. Now, we can take a long entry on the retest for a short term trade but also we can

XlmThis Breakout Can Give You Minimum 5x Profit
Believe Me These Breakouts Are Life Changing Opportunities
Simply Wait For Breakout Buy After Breakout Hold For Few Weeks And Your Money Has Multiplied Get Easy Money

💡Don't miss the great buy opportunity in XLMUSD @StellarOrg
Trading suggestion:
". There is a possibility of temporary retracement to the suggested support line (0.1330).
. if so, traders can set orders based on Price Action and expect to reach short-term targets."
Technical analysis:
. XLMUSDT is in a range bound, and the beginning of an uptrend is e

💡Don't miss the great buy opportunity in XLMUSD @StellarOrgTrading suggestion:
". There is a possibility of temporary retracement to the suggested support line (0.1995).
. if so, traders can set orders based on Price Action and expect to reach short-term targets."
Technical analysis:
. XLMUSD is in a range bound, and the beginning of an uptrend is expec

What a Chart!!!This is the daily chart of stellar, as you can see in the chart after a heavy consolidation near the support region stellar is near the trendline resistance any breakout above the marked trendline can take stellar to the moon..!!!!

See all ideas
Displays a symbol's price movements over previous years to identify recurring trends.