SMARTLINKSMARTLINK:- Stock is about to give breakout after almost 2 years, is consolidating near resistance
Hello traders,
As always, simple and neat charts so everyone can understand and not make it too complicated.
rest details mentioned in the chart.
will be posting more such ideas like this. Until that, like share and follow :)
check my other ideas to get to know about all the successful trades based on price action.
Thanks,
Ajay.
keep learning and keep earning.
Search in ideas for "Smart"

Smart Money Concept anticipationIf the previous Monthly Liquidity is swept then the NSE:ADANIPORTS will be bearish for intermediate term as there's a huge liquidity pool residing below the level of 650 to 600.
Otherwise, it's Bullish.
#smartmoneyconcept #adaniports #advancedpriceaction #ictconcepts

MATRIX portfolio ADA/USDT : Smart-money levels No description needed.
I just spot where the value should be or where are the levels smart-money and institutionals traders and investors look for buy entry's, according to Fibonacci retracements.
NOT FINANCIAL ADVICE
MORPHEUS.

LINKUSDT | The Calm Before Expansion – Smart Money Reloading Hello Traders,
Let’s dive into Chainlink (LINK/USDT) — a pair that just delivered a classic liquidity manipulation setup followed by early signs of accumulation within a deep discount zone.
📊 Market Structure Overview
Over the past weeks, LINK has been trading inside a clean distribution–accumulation cycle.
After multiple failed attempts to sustain above $23–$24, the market engineered a strong downside sweep — hitting $15.70, the exact zone where previous breakout imbalances existed.
This deep move below the range low was not random. It served one purpose:
👉 to collect liquidity and trigger stop losses from late buyers before Smart Money re-enters.
Now, price has started rejecting the lows with visible buying pressure and a strong reaction candle emerging near the demand area.
This early shift in momentum hints that LINK is transitioning from the markdown phase into reaccumulation.
🧭 Technical Insights
The LuxAlgo Nadaraya-Watson Envelope shows price extending beyond the lower deviation band — a strong mean-reversion signal.
Every previous time LINK produced a Bear Wick in this context, a bullish impulse followed shortly after.
The structure break confirmation will come once we reclaim $19.00 on the daily — that’s the first sign that buyers are taking control again.
📈 Upside Projections
If the structure holds above the $16–$17 base, and liquidity remains protected, expect a measured leg toward:
Target 1: $19.00 – structure reclaim
Target 2: $21.40 – previous support turned resistance
Target 3: $24.00 – top of the prior distribution range
Extended Target: $27.20 – full bullish expansion zone
This would complete a three-phase Smart Money cycle:
Manipulation (Liquidity Grab)
Accumulation (Sideways Base)
Expansion (Trend Continuation Up)
📉 Bearish Scenario
If LINK fails to hold above $15.50, we could see a short-term flush toward $14.00, but this remains less probable while momentum and liquidity signatures stay bullish.
💡 Mentor’s Insight
The recent breakdown scared most retail participants — but that’s exactly where Smart Money positions for the next wave.
When emotions peak, liquidity shifts.
When fear dominates, value investors accumulate.
LINK has consistently shown strong recovery ability after liquidity sweeps. The current structure mirrors those earlier setups.
📌 Summary
Outlook Bias Key Support Key Resistance Target Zone
Mid-term Bullish $15.70 – $17.00 $21.40 – $24.00 $27.20
🧠 Final Thoughts
The current LINK setup embodies the Smart Money Concept:
Sell-side liquidity swept, discount reached, reaction initiated.
If the structure continues to build strength above $17, the next impulsive move could lift LINK back to $27+ in the coming sessions.
📢 Patience and precision entries matter more than prediction.

XAUUSD Liquidity Trap: Sell High, Buy SmartGold is not about chasing price today — it’s about patience and precision. After the recent push into premium, short-term structure shows a CHOCH, signaling a potential liquidity grab before the next real move.
Karina’s focus: sell reactions at supply, buy only at key demand zones — no FOMO in the middle 💛
📊 Market Overview
Price is trading below a reaction sell zone, showing hesitation after the impulse.
Smart money behavior suggests a pullback to rebalance liquidity before continuation.
Bias remains reactive, not predictive — let price come to us.
🔑 Key Levels to Watch
Reaction Sell Zone: 4624.847
Supply / Sell Zone: 4597.636
Intraday Pivot: 4563.361
Buy Scalp Zone: 4548 – 4544 (SL 4538)
Main Buy Zone: 4514 – 4510 (SL 4504)
Bullish Continuation Base: 4480.159
🧭 Trading Scenarios
🔴 Scenario 1: Sell the Premium (Short-term / Scalp)
Wait for price to revisit 4597 – 4624
Look for rejection, bearish reaction, or minor structure shift
Targets: 4563 → 4548/4544
🟢 Scenario 2: Buy from Demand (Reversal Play)
Buy scalp at 4548 – 4544 if reaction confirms
Main buy opportunity at 4514 – 4510
If liquidity is swept deeper, 4480 is the key base for bullish continuation
📝 Karina’s Notes
The best trades today are reaction-based, not emotional.
No confirmation = no trade. Standing aside is also a position ✨
Let liquidity do the work — we just follow the footprints.
If you want real-time updates and clean execution plans,
👉 Follow Karina on TradingView so you don’t miss the next setup 💫

EURUSD Liquidity Sweep | Smart Money ReversalEURUSD has completed a downside liquidity sweep after an extended bearish phase.
Price is now reacting from a discount zone and internal demand, signaling potential smart money accumulation.
🔍 Key Insight
Sell-side liquidity has been taken, but bearish continuation is weak.
This behavior often appears before a bullish rotation or trend pause.
📊 Market Structure Narrative
• Bearish MSS completed
• Liquidity grabbed below range lows
• Demand holding → upside probability increases
📌 Outlook
If demand remains protected, price may expand toward higher levels.
No rush — confirmation beats anticipation.

Bitcoin Smart Money SellingBitcoin Smart Money Selling
After a strong upside expansion, Bitcoin is showing loss of acceptance at higher prices. Momentum is slowing, follow-through is weak, and each push higher is getting rejected — classic signs of distribution near the highs.
The final upside move appears to have trapped late buyers, while smart money distributes into strength. When this behavior appears, price often returns back into value before the next real directional move.
➡️ Unless price quickly regains strong acceptance above recent highs, downside volatility remains favored.

XAUUSD Smart Money Distributing, Not AccumulatingAfter a clean bullish run, Gold is now showing clear signs of distribution as price reacts inside higher-timeframe premium sell zones. This is no longer a market to chase buying positions — structure and liquidity say otherwise.
Market Context
Price has completed a Break of Structure (BOS) to the upside, followed by failure to hold premium highs. Current price action shows weak bullish follow-through, hinting that smart money is offloading positions, not adding.
This environment favors patience and reactive trading, not prediction.
Key Technical Observations
• Strong rejection from 4512 – 4516 React Sell Zone
• Distribution confirmed below OB Sell 4486 – 4490
• Lower high forming into Sell Scalp 4463 – 4465
• Unfilled liquidity remains below, aligning with the GAP zone
The market is currently compressing, which often precedes a deeper liquidity sweep.
Trading Scenarios
🔻 Bearish Scenario (Preferred)
As long as price remains below 4490, downside continuation is favored. Targets align toward 4437 – 4400, with extended drawdown potential into the GAP area near 4334.
🔁 Alternative Scenario
If price reclaims and holds above 4516, bearish bias is invalidated and structure must be reassessed.
Karina’s Notes 🤍
This is a reactive zone, not a signal to force trades. Let price come to liquidity — that’s where high-probability decisions are made.
Less emotion.
More structure.
Always patience.
If you find value in clean structure, liquidity logic, and disciplined execution — a follow means we’re aligned 🤍

Bitcoin Correction = Smart Money Opportunity, ready for 3% move!Bitcoin (BTCUSDT) has been consolidating inside a well-defined descending channel , reflecting a healthy correction phase after the recent rally. While many traders panic in these phases, experienced players know that corrections are temporary, structures define direction.
Notice how price is approaching a key zone between 117K–116K, which aligns perfectly with both the lower channel boundary and the prior breakout retest zone. This area acts as a high-probability reversal zone , where strong hands are likely waiting for confirmation candles to re-enter the trend.
Psychologically, the 120K round level remains crucial. Expect volatility near this zone, as retail traders get trapped while smart money positions itself quietly before the breakout.
Once the breakout sustains above 121K, short-term traders could target levels around 122.5K–123K , while positional traders may aim for much higher structural targets.
Rahul’s Tip:
Never fear a pullback when structure stays intact, institutions use these dips to accumulate while the public exits too early. Stay patient, let the structure play out.
Analysis By @TraderRahulPal (TradingView Moderator)
If this breakdown and re-entry logic helped you, don’t forget to like and follow for regular updates.
Disclaimer: This analysis is for educational purposes only and should not be taken as financial advice. Please do your own research or consult your financial advisor before investing.

XAUUSD SD + OTE Long Trade (Smart Money Logic)This is my recent LONG trade on OANDA:XAUUSD on the 15 min chart.
When everyone was waiting to SHORT , I was waiting patiently in my LONG position.
Entry :
$3378 - Order Block + FVG + 0.5 Optimal Trade Entry level
Exit :
1st Target - $3400 (Standard Deviation Target 1 + 3400 psychological level)
2nd Target - $3418 (Standard Deviation Target 2)
NOTE: Smart Money DOES NOT HUNT stoplosses , they trigger their positions slightly below where they find maximum liquidity, because their positions are WAY TOO HUGE and need all the anti-orders (buy/sell stops) basically buy side or sell side liquidity so that they can fill in their orders. They are literally there to HELP YOU push the price up or down, you just need to place your stoplosses right! not too tight not too far off which may cause market structure shifts. SLs need to be absolutely perfect
Trade Explanation :
OANDA:XAUUSD should have used the 1D Bearish Order Block and we should have seen a fall or at least a decent enough retracement, but only 1 thing saved us, that is 15 min Bullish INDUCMENT and 1H BIAS . I never entered in a short trade!
I hope everyone saw these liquidity pools at the bottom and waited for them to get swept, but yeah, not always will liquidity be hunted right? Pools are areas with the most number of orders + stops. So aren't they supposed to be a good thing? :)
So, yes, DAILY bias is good, but again, LTF bias is also very necessary. Markets won't always respect the DAILY bias. Else, they would always be stuck in a sideways momentum right?
Think about it!
Also, do let me know in the comments what you feel about this trade and also share your analysis!


MATRIX portfolio BAT/USDT : Smart money levelsNo description needed.
I just spot where the value should be or where are the levels smart-money and institutionals traders and investors look for buy entry's, according to Fibonacci retracements.
NOT FINANCIAL ADVICE
MORPHEUS.

MATRIX portfolio AVGO/USD : Smart money levelsNo description needed.
I just spot where the value should be or where are the levels smart-money and institutionals traders and investors look for buy entry's, according to Fibonacci retracements.
NOT FINANCIAL ADVICE
MORPHEUS.

MATRIX portfolio AMT/USD : Smart money levelsNo description needed.
I just spot where the value should be or where are the levels smart-money and institutionals traders and investors look for buy entry's, according to Fibonacci retracements.
NOT FINANCIAL ADVICE
MORPHEUS.


SMART MONEY CONCEPTS EUR JPYSMART MONEY CONCEPTS
cryptocurrency #crypto #blockchain #forex #btc #ethereum #money #trading #bitcoinmining #investment #business #forextrader #investing #bitcoinnews #bitcoins #entrepreneur #invest #trader #binaryoptions #bitcointrading

Smart money concepts view short
bos 1 hr
price mitigation to origin poi
enrty - optimum trade entry 50 % of POI

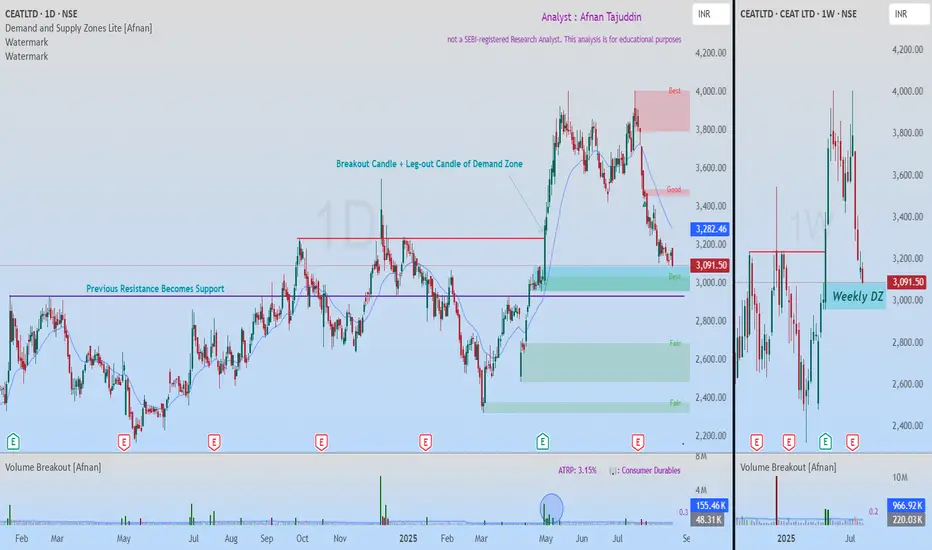
Smart Money Footprint Visible: Ceat Testing Powerful Demand ZoneBack on 24th July , I shared an idea on Ceat. That call didn’t play out and the Stop Loss (SL) got hit . No surprises there—SLs are simply the cost of doing business in this market. hitting SL is part of trading . The key is discipline – once SL is hit, we must exit without hesitation.
Now, Ceat seems to be offering us another opportunity . Let’s break it down.
📊 Why This Demand Zone Stands Out
The stock is approaching a very strong demand zone visible clearly on the weekly & Daily timeframe .
The leg-out candle that created this demand zone was powerful – it broke past previous resistance with a strong bullish move .
Follow-through from that breakout candle even took the stock to all-time highs . This tells us it’s not just an ordinary zone but one with institutional footprints.
Institutions often leave behind pending buy orders in such zones, or they may look to accumulate more here to defend their earlier positions.
This level first acted as resistance , then flipped into support —a classic price-action rotation.
📉 Volume Behavior 📉
On the breakout candle, volume was massive. But now, as price is pulling back, we can see volume exhaustion . To me, that signals a lack of real selling pressure. When supply dries up, it leaves the door open for demand to kick back in.
🔎 Confluences Adding Strength 🔎
Weekly demand zone lining up with a daily demand zone .
Traditional support level overlapping at the same price area.
Volume analysis confirming lack of strong selling.
🎯 Trading Plan 🎯
SL should be placed just below the support level to manage risk.
First target should be the nearest supply zone .
Till first target, the Risk-to-Reward (RR) ratio is about 1:3 , which makes it attractive.
If SL gets hit, simply exit the trade . No second thoughts.
What I find compelling here is the overlap: weekly demand, daily demand, and a long-tested support line all converging. That kind of alignment doesn’t come around every day. The probability of a bounce looks strong—but at the end of the day, risk management is what separates setups from disasters .
“Trading is not about being right every time. It’s about managing risk smartly and surviving long enough to catch the big moves.”
💡 The market will always offer another opportunity—our job is to stay disciplined, manage risk, and be ready when it comes. 🚀📈
⚠️ This analysis is purely for educational purposes only and is not a trading or investment recommendation . I am not a SEBI registered analyst .
Smart Money Play: Watching HDFC Bank’s Bullish ZoneTrading Idea: HDFC Bank (NSE: HDFCBANK)
Price is currently trading around ₹976 after a recent pullback.
Key Observations:
Break of Structure (BOS) confirms bullish market structure.
Liquidity sweep around recent highs.
Daily Fair Value Gap (FVG) spotted between ₹910–₹930.
Bullish Order Block at ₹800–₹830 acting as strong higher timeframe support.
Plan:
Expecting a retracement into the Daily FVG zone (₹910–₹930).
If price reacts bullishly here, potential upside rally towards ₹1,040+.
Confirmation: Look for bullish reversal candles or demand zone rejections inside FVG.
Risk Management:
Aggressive entry: near FVG zone (₹910–₹930).
Conservative entry: only after bullish confirmation.
Stop-loss: below ₹890.
Targets: First TP at ₹990, extended TP at ₹1,040.
Bias: Bullish (after retracement).
Disclaimer: This is not financial advice. For educational purposes only. Please do your own research or consult with a financial advisor before making any investment decisions.

Smartlink Weekly Swing OpportunityAscending triangle is formed in the weekly timeframe. Trendline is perfectly aligning the wicks.
Watch out for the resistance area.
Buy above 134


