ETH/USDT Etherium is forming a rising wedge pattern. According to this rising wedge pattern it could reach the upper support zone near about 1680-1700 usdt. Also this week the FOMC meeting could negetively impact this, and we could see the breakdown of the rising wedge pattern till the lower support zone near about 1200 usdt. Untill do your trade according to the price action or wait for the confirmation.
Search in ideas for "USDT"

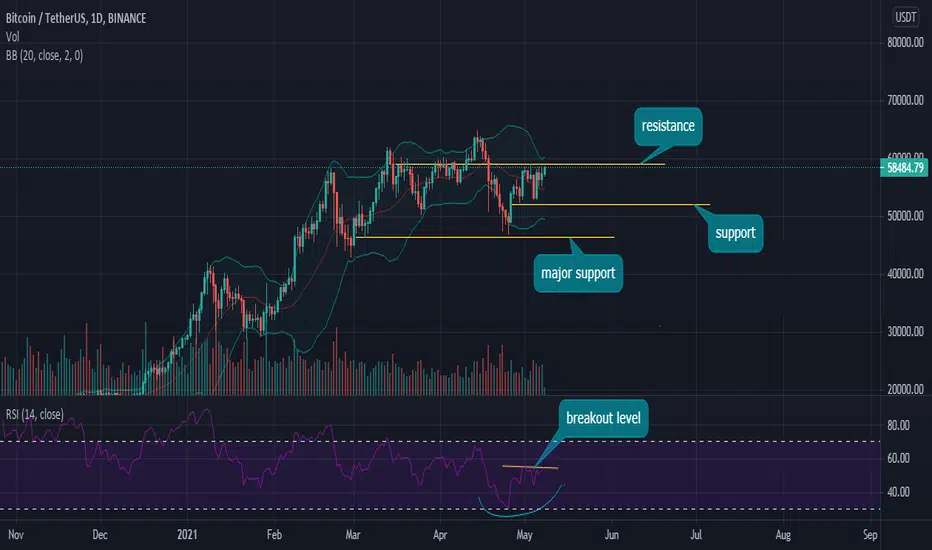
BTC/USDT: forming bullish swing rejection pattern on RSI BTC/USDT #rank=1
As we all now few days for BTC where not good we saw corrections and several pullbacks which brought little bearishness to the market. Due to unstable nature of BTC other ALTS also got disturbed too and all these event created panic in the market. But as for now BTC looks like it is recovering and being stable.
Presently, BTC is facing a resistance at $58.5k-$59k which can be clearly seen in the chart,i.e. price moves up touches that level and falls back again. So for BTC to start a strong upward trend again it has to break that resistance level . According to me a breakout coming very soon.
Because,
BTC is forming a bullish swing rejection on the RSI indicator which can be clearly seen on the RSI indicator chart, bullish swing rejection as name suggest is bullish pattern. RSI has formed the breakout level of the swing rejection and once the breakout level is breached BTC chart will also break the resistance and move further. For higher highs.
You all can also follow me on the Twitter..!!
Show your Support.
Thank you.
💡 Don't miss the great buy opportunity in ATOM/USDTTrading suggestion:
. There is a possibility of temporary retracement to suggested support line (20.9). if so, traders can set orders based on Price Action and expect to reach short-term targets.
Technical analysis:
. ATOMUSDT COSMOS/USDTis in a range bound and the beginning of uptrend is expected.
.The price is above the 21-Day WEMA which acts as a dynamic support.
. The RSI is at 44.
Take Profits:
TP1= @ 22.93
TP2= @ 23.65
TP3= @ 25.15
TP4= @ 26.50
TP5= @ 29.05
SL= Break below S2
❤️ If you find this helpful and want more FREE forecasts in TradingView
. . . . . Please show your support back,
. . . . . . . . Hit the 👍 LIKE button,
. . . . . . . . . . . Drop some feedback below in the comment!
❤️ Your Support is very much 🙏 appreciated! ❤️
💎 Want us to help you become a better Forex trader ?
Now, It's your turn !
Be sure to leave a comment let us know how do you see this opportunity and forecast.
Trade well, ❤️
ForecastCity English Support Team ❤️

Bullish on USDTHBUS Dollar to Thai Baht (USDTHB) is showing bullish divergence on the daily chart. I am looking at a Long with the initial target of 30.4 from here.

BTC/USDT Crossroads:Short Term Bearish Signals & What Lies Ahead💎 Paradisers, let's dive into BTC/USDT. The asset has recently slipped below its supportive trendline and is currently hovering near the demand zone of 25,792 on the weekly chart. My anticipation is that we might witness some stabilization in this region for a few days or perhaps a week before the price determines its subsequent trajectory. Presently, the scales tip towards a bearish sentiment, primarily due to the bearish divergence spotted on the RSI, signaling a potential trend reversal. Yet, it's essential to stay attuned to the price action.
💎 If BTC/USDT plunges past the 24,214 demand threshold, we might be steering towards the subsequent demand zone at 21,753. Intriguingly, this aligns with the Fibonacci's 0.618 level, often dubbed the 'golden zone'. Any bullish signs here could suggest a potential uptrend. However, if this zone crumbles, our sights are set on the 16,603 mark, a formidable demand zone and an optimal juncture for long-term accumulation.
💎The market might exhibit a lateral movement, potentially shaking out the less tenacious traders. Given the room for further decline in both the RSI and price, Stay vigilant and keep soaring, ParadiseSquad!

YGG/USDT's 'Cup and Handle' Setup: Get Ready for a Bullish Ride!💎 Paradisers, turn your attention to YGG/USDT. On the hourly chart, it's crafting a 'Cup and Handle' pattern. This formation suggests a sequence of Higher Highs (HH) and Higher Lows (HL).
💎 If YGG/USDT manages to breakout the 0.2847 resistance level, it'll be a nod to the HH formation, hinting at a bullish trajectory. What's on our radar? Potential climbs to resistance zones at 0.3233 and possibly up to 0.3447. However, tread cautiously. If the price dips below the handle's low, especially past the 0.2310 mark level (aligned with the FIBO 0.5), our pattern might lose its validity.
💎Stay vigilant and keep soaring, ParadiseSquad!

Read or Regret - Head and Shoulders Pattern Alert for OP/USDT 💎 Paradisers, let's zoom into OP/USDT. On the 1-hour chart, a head and shoulder pattern is taking shape. However, there's a twist: the right shoulder is a tad shorter than the left one. This suggests we might need to see some consolidation before any potential breakdown of the demand and neckline zone at 1.394.
💎 If OP/USDT does break below this zone, our sights are set on potential descents to the demand levels at 1.279 and possibly 1.168. But remember, if the price climbs and surpasses the right shoulder's peak, specifically the 1.575 mark, this pattern might no longer hold water.
💎Stay vigilant and keep those charts close, ParadiseSquad!

EGLD/USDT Alert: Wedge Pattern Sparks Bullish Momentum!💎 Hey Paradisers, let's explore EGLD/USDT. Zooming in on the daily chart, a falling wedge pattern has emerged over time. Right now, it's getting closer to a strong support trendline, and a noticeable bullish MACD divergence is in play.
💎 If EGLD/USDT stabilizes on this support line and breaks the 29.82 level, we might be gearing up for an exciting bullish momentum. Potential targets? Our sights are set on resistance at 33.64 and maybe even 36.31. Interestingly, a bounce from the support could catch rookie short traders off-guard. Those who shorted at the previous low might get trapped, and as the price climbs past their entry points, triggering their stop losses, we could witness a bullish surge.
💎Stay alert and trade smart, ParadiseSquad!

INJ/USDT : Trend Reversal in the Making? Don't Miss This!💎 Paradisers, let's turn our attention to INJ/USDT. On the Daily chart, it's carving out a head and shoulder pattern, signaling a potential trend reversal. Notably, the right shoulder is smaller than its left shoulder, indicating a shift towards forming lower highs.
💎 If INJ/USDT slide below the demand mark of 7.490, it would pave the way for a series of lower lows. This movement could amplify confidence in a bearish direction, potentially steering the price towards demand zones at 6.829, 6.201, and 5.681. However, if the price ascends beyond the right shoulder's peak at 8.378, this pattern might lose its validity. Trade carefully and stay sharp, ParadiseSquad!

AAVE/USDT Price Alert: Traders Beware of Upcoming Bullish Surge!💎 Paradisers, let's take a closer look at AAVE/USDT. Historically, it's demonstrated three traps within a rising wedge pattern, leading to significant moves. Currently, after breaking its lower trendline, it's making a comeback upwards. This could potentially ensnare traders who went short after the lower trendline breakdown of rising wedge pattern.
💎 Moreover, AAVE/USDT has surpassed its resistive trendline, hinting at bullish momentum. If it manages to climb above the supply level at 66.38, we might witness a bullish surge. This is because short traders' stop-losses would likely be triggered here, propelling the price further. Our eyes are set on potential ascents to supply levels at 67.01 and 67.98. Stay sharp and informed, ParadiseSquad!

CHZ/USDT Triangle Teases Explosive Move - Get Ready!💎 Paradisers, take a moment to observe CHZ/USDT. On the 1-hour chart, it's sketching out a triangle pattern. Currently, it's hovering beneath the resistance and demand zone ranging from 0.0766 to 0.0755. Notably, the resistance is reinforced by the 200 EMA, which could exert downward pressure on the price. Extended consolidation often leads to a more pronounced move in the eventual breakout or breakdown direction. This is because during such phases, retail traders often accumulate positions and overtrade, placing their stop losses close to the resistance and demand zones. This dynamic can amplify the move post-breakout or breakdown.
💎 If CHZ/USDT manages to surge past the 0.0766 resistance, we might set our sights on targets at 0.0771 and further to 0.0780. On the flip side, a bearish scenario would require a breach below the 0.0755 demand zone. Should this level be compromised, we could anticipate a move towards the next demand zone at 0.0745. Stay vigilant and strategize wisely, ParadiseSquad!

MATIC/USDT forming W pattern WIth MACD bullish divergenceMATIC/USDT
💎 ParadiseSquad, let's turn our attention to MATIC/USDT. Currently, it's consolidating beneath the demand and supply zone on the 1-hour timeframe. Interestingly, it seems to have trapped breakout traders who entered at the breakdown of the demand zone.
💎 If these traders have placed their stop losses above the supply zone, a break above this zone could trigger a bullish move. The MACD is also indicating a bullish divergence, further supporting this potential upward shift.
💎 We're looking for a breakout above the supply zone at 0.6857. If this occurs, we could see targets reaching up to the next supply zones at 0.6982 - 0.7039. However, if it continues to consolidate under this area for an extended period, it may reduce the likelihood of our analysis playing out, and it might be better to stand aside.
💎 The 200 EMA is also close to the supply zone, which could make it challenging to break through the supply zone. However, once it does, we could see a significant upward movement. As always, stay alert and happy trading, ladies and gentlemen!

AGIX/USDT forming W Pattern at 1 Hourl TFAGIX/USDT
💎 Ladies and Gentlemen of ParadiseClub, let's turn our attention to AGIX/USDT. It's currently crafting a 'W' pattern, and the MACD is indicating a bullish divergence. After a sharp decline, it's begun to bounce off the demand zone, shaping this 'W' pattern.
💎 The 200 EMA is also hovering near the supply zone, reinforcing it as a robust supply area. Scalpers might consider a short position here, but if it breaks through the supply zone and the 200 EMA level at 0.21347, we could anticipate a move up to the next supply area at 0.2237.
💎 It's important to note that a retest is crucial after the breakout. As always, stay vigilant and enjoy your trading journey, Paradisers!

Beta usdt for investmenthere is my chart for beta usdt. as we can see beta usdt is following curve pattern since its ath and imo this is the bottom of the curve

BTC/USDT 4HOUR TECHNICAL ANALYSISWelcome to this quick update, everyone.
If you are reading my updates for the first time do follow me to get more complex charts in a very simplified way.
I also post altcoin setups on Spot, Margin, and Futures.
I have tried my best to bring the best possible outcome in this chart .
BTC is trading around $62.600 the support is $60000 and $59000 OR 21 ma and resistances level is $63600.
Breaking down below $60k will be a red alarm for the market and a break out above the 630000 will be all good for the market.
If its breaks the 21ma and $60000 support level then the chart will be invalid.
What's your thought on this?
Do hit the like button if you like this update and share your views in the comment section.
Thank you
#PEACE

EGLD/USDTA simple but elegant pattern formation of BULLISH Ascending Triangle can be seen in EGLD/USDT. The price can really light up and surge to the upside lvls as mentioned in th chart (*in green*) but if failed then the price can be dragged down the the lvls as mentioned in the chart (*in red*). Although, BTC/USDT is showing a lower side if it happens to hold the current lvls then it can help move the price of ALT's to the upside.
Targets :- 162 -> 175 -> 188 -> 200++
SL :- 135
DISCALIMER : I am not a Financial Advisor, this chart is just for educational purposes only (DYOR).
BINANCE:EGLDUSDT

DYDX/USDT Chart Analysis: Bearish Setup with Potential Downside💎 Paradisers, cast your eyes on DYDX/USDT. The daily chart reveals an 'M' pattern emerging within the supply zone, amplifying the chances of a bearish shift. Adding to this, the supportive trendline has been breached.
💎 For a clearer bearish confirmation, watch out for a descent below the 1.915 demand level. If this occur, we might be looking at potential descents to 1.763 and perhaps even 1.506. However, for those with a bullish perspective, a climb above the 2.274 supply zone would be the signal to watch.
💎Stay sharp and chart-smart, ParadiseSquad!

Spotting Reversal Potential: GMX/USDT Daily Chart Analysis💎 Paradisers, let's take a closer look at GMX/USDT. On the daily chart, a head and shoulder pattern is emerging, hinting at a potential price reversal. Here's the breakdown: the left shoulder indicates higher highs, the head continues this trend, but the right shoulder? It's showing a lower high, signaling a possible shift.
💎 For this pattern to truly manifest, we'll need to see a breakdown of the neckline, confirming the trend of lower highs and lower lows. Specifically, a dip below the demand zone of 38.07 could pave the way for targets at 25.77 and even 15.92. However, a word of caution: if the price climbs above the right shoulder's peak, specifically the 63.07 mark, this pattern could be off the table. Why? Because that would mean a new higher high, disrupting the pattern's integrity.
💎Stay sharp and keep those charts handy, ParadiseSquad!

XRP/USDT's Rising Wedge: Trade Alert for Potential Gains or Dips
💎 Paradisers, let's zoom into XRP/USDT. The asset has been tracing a rising wedge pattern for a while, adhering to both resistive and supportive trendlines. Interestingly, it's played a couple of traps during this phase and is currently hovering near the supportive trendline.
💎 If we witness an upward momentum from this point, potential bullish targets could be set at resistance markers of 1.344 and 1.374. On the flip side, a bearish scenario would need a dip below the demand zone at 1.231. If this breakdown occur, our sights would be set on the subsequent demand zones at 1.156 and 1.101.
💎Trade with caution and stay informed, ParadiseSquad!

Explosive Head and Shoulder Pattern Forming On SHIB/USDT💎Paradisers, turn your attention to SHIB/USDT. The 1-hour chart shows a head and shoulder pattern forming. After achieving higher highs, the price began to carve out lower lows, laying the foundation for this pattern. If it drops below the neckline and the important demand area at 0.00000931, it would validate the lower low trajectory. We might then see a move down to the next demand area near the 200 EMA at 0.00000907.
💎 If the price breaks above 0.00000975 the right shoulder, It could invalidate this pattern.
💎This 200 EMA could act as a gravitational pull, might attract the bears. Stay alert and plan your strategies carefully, ParadiseSquad!

FLOKI/USDT's Hourly Head and Shoulder Pattern Sparks Excitement!💎Hey Paradisers, let's focus on FLOKI/USDT. Looking at the 1-hour chart, we can see a head and shoulder pattern forming, with a notable emphasis around the 200 EMA. The right shoulder appears smaller than the left, suggesting the bears are in control.
💎There's a chance the price might drop below the demand zone and the pattern's neckline at 0.00002210, possibly leading to a bearish movement. What's on our radar? The price could potentially decline towards the demand zones, with the first target at 0.00002912 and a deeper target at 0.00002177. However, if the price surges above the right shoulder, it could disrupt this pattern. Stay tuned, Paradisers, for more updates and happy trading!

BAT TOKEN (BAT/USDT) LONG !BAT token is trading near the resistance and on daily TF we can see the momentum divergence.Im expecting BAT will break the resistance and move up to the next resistance.We can buy above 0.4567 USDT.

ETH USDT 1D Falling Wedge Pattern A Falling Wedge Pattern has been Formed in Etherum 1 Day Time Frame. It is considered as bullish Pattern. The target will be the gap between two trend lines. Lets wait for daily closing before entering. The approx target will be around 3150 USDT.
