Trading view Indian Version..EURUSD-Update14--"Life Guard-5pips"Look How Wave gets support & making a low@1.1155 post d-wave as shown in "EURUSD-Update 13--Waiting For Most Exciting Wave"
Here EU took U-turn exactly 5 pips away from our stop loss (life guard -5 pips) & zone mentioned clicks (1.1155--1.1165)...Just made recent High@1.1184...
Current price--1.1180...
In current scenario it shouldn't go below 1.1154 ....& look for a jump in the zone 1.1230--1.1250....We shall be getting 20 pips fall to complete "e-wave" & jump of 60-70 pips rally on upside....total shall be 90--100 pips in the dull day...Vow...Isn't that exciting..
Let us start moving developing our own Indian Trading View Community ---Kindly start putting your updates & follows on-- -"https://in.tradingview.com/"
Regards,
Abhishek H.Singh, CMT
Search in ideas for "Version"

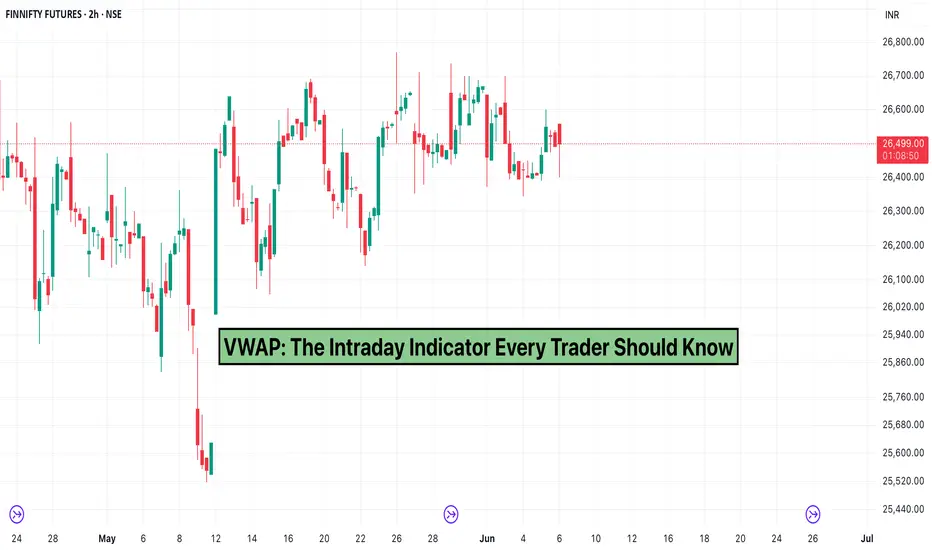
VWAP: The Intraday Indicator Every Trader Should KnowWhen it comes to intraday trading, precision matters. That’s where VWAP—the Volume Weighted Average Price comes in.
Used by retail traders, institutional players, and algo systems alike, VWAP helps you understand the average price of a security throughout the day, weighted by volume. It's one of the most important indicators for intraday decision-making on platforms like TradingView.
What is VWAP?
VWAP is the average price a security has traded at throughout the day, based not just on price but also on volume. It gives more importance to price levels with higher volume, making it a reliable benchmark for assessing price fairness and trend direction.
Why VWAP Matters
Intraday Trend Gauge: Traders use VWAP to identify whether the price is trading above or below its average.
Support & Resistance: VWAP often acts as dynamic support or resistance during the trading day.
Institutional Benchmark: Many institutional traders use VWAP to ensure they’re getting good execution on large orders.
How to Use VWAP in Your Trading
Above VWAP: Bullish bias. Consider long trades when price holds above VWAP.
Below VWAP: Bearish bias. Look for short setups when price stays below VWAP.
Pullback Entries: Traders often use VWAP for entries on pullbacks during a trending day.
VWAP on TradingView
To use VWAP on TradingView:
Open any intraday chart.
Search for the VWAP indicator in the Indicators tab.
Apply it to your chart—no custom settings needed for the basic version.
You can also experiment with anchored VWAPs or custom scripts that fit your strategy better.
Conclusion
VWAP is more than just a line it’s a real-time gauge of value and trend. It helps traders stay on the right side of momentum while managing entries and exits more effectively.
Whether you’re scalping or holding intraday positions, understanding VWAP can add a powerful edge to your trading setup.
The Invisible Path of Every TraderNSE:NIFTY NSE:BANKNIFTY BSE:SENSEX NSE:CNXFINANCE
At the core of trading is not just analysis or execution—it’s identity.
Every trade you take, every emotion you ignore, and every habit you repeat silently shapes the kind of trader—and person—you are becoming. And this is where the Mind Indicator enters: not as a tool to predict markets, but as a compass that keeps you aligned with your intended identity.
---
1. The Statement: Two Selves, One Path
> “Either you become the person you want to become, or you become the person you’re not even aware of.”
This powerful idea reveals a hidden truth:
If you're not actively steering who you're becoming, you're drifting toward someone you may not even recognize—driven by emotion, ego, and unconscious habits.
In trading, this truth is amplified under pressure, risk, and uncertainty.
---
2. How It Relates to the Mind Indicator
The Mind Indicator represents your internal state: emotions, impulses, stress, belief patterns, and cognitive clarity. It tells you:
Are you trading with intention?
Or are you reacting from a state of fear, greed, or identity insecurity?
This invisible indicator reveals whether you’re acting as your ideal trader self, or if you’ve slipped into the version of you that acts without awareness—chasing, hesitating, overtrading, or self-sabotaging.
Without watching this internal dial, you default to patterns you don’t even know you have.
---
3. Becoming the Trader You Want to Be
To become the person you want to be in trading:
You need a clear internal reference point (your best self: calm, focused, rational).
You need the self-awareness to recognize when you’ve drifted.
And you need to confront your real-time state, even when it’s uncomfortable.
The Mind Indicator helps you stay on track—not by telling you what trade to take, but by reminding you who’s about to take it.
---
4. Becoming the Trader You’re Not Aware Of
This is what happens when the mind is unwatched:
You chase signals with no patience.
You cut winners short from fear.
You revenge trade to reclaim ego.
You over-size to force success.
You avoid logging trades because the truth feels too sharp.
This version of you isn’t the result of bad strategy—it’s the result of unexamined emotion.
You become someone else… and don’t even realize it until the damage is done.
---
5. The Choice Is Constant
The quote doesn’t describe a one-time fork in the road.
It’s an ongoing process. Every trade is a vote:
For the person you want to become.
Or for the version of you that's ruled by emotion, bias, and blind spots.
And that’s what makes the Mind Indicator so powerful—not because it gives you signals, but because it keeps you aligned with your true identity and intention.
---
No Resolution, Just a Reflection
There’s no single technique, no hack, no checklist that replaces this awareness.
The real work isn’t in controlling the market.
It’s in observing your own internal market.
And deciding, moment by moment, trade by trade—
Who do you choose to be today?

Could Bitcoin PA head down to fill CME Gap at 82K-77K usdt
And the answer is "Very possibly"
50 SMA ( RED ) -100 SMA ( BLUE ) - 128 SMA ( GREEN ) - 200 SMA ( YELLOW )
For a start, Lets Look at what the 50 SMA did in the previous range.
PA bounced off that 50, having tested it 4 weeks previously ( see wick down )
I can see no reason why that would not happen again if PA reaches this point.
But we are now seeing the 50 beginning to flatten out after 3 months of PA ranging.
The CME Gap exists since 11 Nov 2024
Price range of Gap is 80720 down to 77535
On the main chart, See how that 50 SMA is currently flattening out just under this range ?
If PA comes down to the 50 SMA for support, it will fill that CME gap.
Notice also how there is a similarity to the pattern of PA from that Range in 2024, though it seems we are experiencing a contracted version.
As mentioned in previous posts, this range is also different in that we are under a 618 Fib Ext.
Little Support below.
This does not mean we will not bounce, indeed, I think we will but ultimately, I can see PA visiting that CME Gap, even if it is just a flash Wick down.
It is a superb opportunity to buy BTC at a lower price

Markets are falling & here are a few reasons.There are a lot of versions for our falling markets. Let's evaluate a few of those -
1. Poor performance of companies -
This reason may be justified for dip in market during the last-to-last quarter but not for most recent one since the results have just started dripping in.
2. FII selling -
May be true but again DIIs are almost matching their sell no.s
3. Mello sentiments from Indian retailer -
Nah! At least the mutual fund data for December doesn't say so. Investors have reduced their positions in debt mutual funds and invested double of what they did in Nov in equity mutual funds.
So what possibly can the reasons be? What this video which exactly tell this.

BTC 6hr View!!According to data provided by Arkham Intelligence, financial giant BlackRock has overtaken Grayscale in the Bitcoin ETF race for the first time.
As noted by the firm, BlackRock’s ETFs, IBIT and ETHA, have now surpassed Grayscale's products, including the firm's scaled-down "mini" versions of its ETF. The two major ETF players are currently at $21.217 billion and $21.202 billion.
Now, the Larry Fink-helmed firm boasts the largest ETF holdings of any provider.
As reported by U.Today, BlackRock's groundbreaking trailblazing IBIT is now expected to become the largest single holder of the leading cryptocurrency, surpassing none other than Satoshi Nakamoto.
On Thursday, Bitcoin ETFs recorded $11.1 million worth of inflows. This came after these products broke their inflow streak on Wednesday with $81.4 million worth of outflows.

Orderflow Surge Indicator 8 July 2024The Order Flow Surge Indicator is a technical analysis tool used by traders to gauge market activity and potential price movement by analyzing the flow of buy and sell orders in the market. Here's a brief overview:
Purpose: The indicator helps identify surges in buying or selling pressure, which can signal potential price reversals or continuations. It aims to give traders an edge by showing real-time data on market participants' actions.
Components:
Buy Orders: Tracks the volume and frequency of buy orders.
Sell Orders: Tracks the volume and frequency of sell orders.
Net Order Flow: The difference between buy and sell orders, indicating overall market sentiment.
Usage:
Trend Identification: Significant surges in buy orders might suggest an upward trend, while surges in sell orders could indicate a downward trend.
Reversal Signals: Sudden shifts in order flow can signal potential reversals. For example, a market experiencing heavy selling followed by a surge in buying might be poised for a reversal.
Volume Analysis: High volume during surges can indicate stronger signals and higher reliability of the trend or reversal.
Interpretation:
Positive Surge: Indicates increased buying activity, potentially leading to price increases.
Negative Surge: Indicates increased selling activity, potentially leading to price decreases.
Divergence: When the price moves in the opposite direction of the order flow surge, it might indicate weakening momentum.
Implementation:
The indicator can be implemented on trading platforms that support custom indicators or advanced order flow analysis tools. Platforms like NinjaTrader, TradingView, and others may offer built-in or community-developed versions of the Order Flow Surge Indicator.

Orderflow Surge IndicatorThe Order Flow Surge Indicator is a technical analysis tool used by traders to gauge market activity and potential price movement by analyzing the flow of buy and sell orders in the market. Here's a brief overview:
Purpose: The indicator helps identify surges in buying or selling pressure, which can signal potential price reversals or continuations. It aims to give traders an edge by showing real-time data on market participants' actions.
Components:
Buy Orders: Tracks the volume and frequency of buy orders.
Sell Orders: Tracks the volume and frequency of sell orders.
Net Order Flow: The difference between buy and sell orders, indicating overall market sentiment.
Usage:
Trend Identification: Significant surges in buy orders might suggest an upward trend, while surges in sell orders could indicate a downward trend.
Reversal Signals: Sudden shifts in order flow can signal potential reversals. For example, a market experiencing heavy selling followed by a surge in buying might be poised for a reversal.
Volume Analysis: High volume during surges can indicate stronger signals and higher reliability of the trend or reversal.
Interpretation:
Positive Surge: Indicates increased buying activity, potentially leading to price increases.
Negative Surge: Indicates increased selling activity, potentially leading to price decreases.
Divergence: When the price moves in the opposite direction of the order flow surge, it might indicate weakening momentum.
Implementation:
The indicator can be implemented on trading platforms that support custom indicators or advanced order flow analysis tools. Platforms like NinjaTrader, TradingView, and others may offer built-in or community-developed versions of the Order Flow Surge Indicator.

Virtual versions Chart 📈 Looking Amazing Probably Cup And Handle Format Pattern Very Powerful Chart Which Can Boom In Few Days 😁 Stay Safe , Invest At Your Own Risk

Tata Motors Chart Analysis and Targets 1 Year Return - 43.2%, 5 Year Return -140.3%
Tata Motors reported a consolidated profit of Rs 3,202.80 crore for the quarter ending on June 30, 2023, a significant turnaround from the loss of Rs 5,006.60 crore reported in the same quarter last year.
According to the company's filing on the BSE, the consolidated revenue for the quarter reached Rs 1,02,236 crore, reflecting a notable increase of 42.1%.
Tata Motors has actively embraced the era of electric mobility in the 2020s, with initiatives including the launch of electric versions of existing models and a strong focus on developing electric vehicle technology.
The company made 57% more money from its British division, Jaguar Land Rover (JLR).
Tata Motors Stock Given Breakout and Trading at All-Time High.
Where To Enter In Tata Motors Stock - Wait for Retraisment and Buy Near Support Zone As per marked on Chart
Short-term Targets - 710, 810
Long Term Target - 910
If You want any Stock Chart analysis let me know , Please share if you like our idea

Bharat Electronics Ltd. (BEL)The chart formation is worth a watch in BEL.
Key levels to watch are 250 and 260 for strong confirmation on the uptrend.
Do always keep a stop loss for your trade, preferably between 5-8%.
Also read my previous analysis on BEL...
Note: Personal analysis. Not an advise to buy/sell
For those looking to subscribe to the pro versions of Tradingview can also use my referral link below...
www.tradingview.com

TTK Prestige trading at Demand ZoneNSE:TTKPRESTIG
TTK Prestige is among the leading brands in the kitchen equipment space, especially in the pressure cooker segment. It is the No. 1 Brand in Pressure cookers, No. 1 Brand in Cookware, No. 1 Brand in Value-added Gas Stoves, No. 1 Brand in Induction Cooktops, India’s only company to offer the complete Induction Cooking solution and it is the No 1 Brand in Rice Cookers.
Fundamentals: -
1. The product profile is diversified, with 31% of the revenue coming from pressure cookers, 15% from cookware, 14% from gas stoves, 12% from mixer-grinders, and the remainder from other kitchen and home appliances and cleaning solutions. 98% of the revenue comes from domestic sales.
2. Distribution Network
The company has more than 545 Prestige Xclusive stores in over 305 cities. 24 Regional Sales Centre and 350+ Authorized Service Centre. The number of outlets as of FY20 was 588. The network now covers 26 States and 345 Towns. The company during FY20 opened two Prestige Lifestyle Stores in Bengaluru.
3. New launch
The company launched an innovative and revolutionary range of Pressure Cookers under the Svachh platform during the second half of FY 20. The company is progressing on a new category of Cleaning Solutions. The operating subsidiary Horwood Homewares Limited introduced new products and a new category SMIDGE range. The Company launched 146 SKUs in FY20 and is geared to launch 100 new SKUs in the market during FY 20-21. TTK Prestige Limited is launching a new category - Stainless Steel Casseroles in two versions viz. Royale and Prime. Totally 7 SKUs of different sizes are being offered at the launch stage.
4. Capex
As per Long-Range Plan intend to do ₹ 200 Cr Capex over three years, the Company has spent about ₹70 Cr in FY20.
5. It is trading at a PE multiple of 36, less than 10year average PE of 42.
6. Average ROE for the last 3 and 5 years more than 15.
7. TTM Sales growth at 31% and TTM Profit growth at 88%.
8. Debt to equity at 0.06 (less than 1 is good), Interest Coverage at 61.7 (greater than 3 is good), Current ratio at 2.96 (greater than 1.5 is good).
9. Dividend Yield of 0.64% (consistent dividend payer since 2006)
The stock is currently trading at a demand zone where 3 resistances and 1 support meet. If anyone consider it for buying, put only 3% of your capital right now, buy with another 3% if it falls another 40% and invest the rest 4% (don't invest more than 10% of your entire capital in one stock) when the share closes at a 52 week high.

How long will the joke prolong? - Dogecoin's potentialDo you believe that we have a chance to go to the moon? Well, we might! It is all thanks to the proponents of Dogecoin or DOGE. It is a Cryptocurrency that began as a random joke but is one of the top coins today.
We are going to the moon. And that sums up pretty much everything you need to know about Dogecoin. In a way, this statement can be correct. There is nothing much to think about Dogecoin. People who are fans of the coin just buy and hold it; basically, they do not sell it off until there is a considerable change. Until they become rich, that is.
However, the question remains. Is it that simple? Read on to find out more.
Dogecoin’s history
You may never believe it, but it is the truth. This Cryptocurrency was started as a joke. However, Bitcoin, also known as the original Cryptocurrency, was a technical innovation and super-impressive. The whole concept of exchanging digital money at a small fee without the necessity of permission from anyone was mind-boggling on its own.
It is essential to remember that Bitcoin was also open source. Hence, anyone to copy it and create the coins, and many did it too. You could see different clones like Litecoin and Peercoin popping up everywhere. And in the same trend, we have Dogecoin joining the honors.
Billy Markus and Jackson Palmer, two software engineers, created Dogecoin in December 2013. It is similar to Bitcoin but mostly closer to Litecoin, which is just another copy of the former. The coin features the symbol of the Shiba Inu dog and acts as a synonym for dog and moon-related metaphors in every silly manner.
Popularity
Dogecoin enjoyed a punctual following right from day 1. It was usually the ones who loved to make fun of Bitcoins and liked the concept of crypto coins. Then you could see people who loved dogs showing interest in the same. Dogecoin attracted anyone who wanted to participate without the seriousness of the cryptocurrency.
No analyst understands the pattern. The Co-founder Palmer also took his hands away in 2018. He concluded that the skyrocketing price of Dogecoin simply indicated that the market was overheated.
Palmer said, "I think it says a lot about the state of the cryptocurrency space in general that a currency with a dog on it which hasn’t released a software update in over two years has a $1B+ market cap," in January 2018. Technically, the market crashed just a few days after that.
However, Dogecoin is still standing to this day. It is primarily because; the currency does not require any exceptional or active management. Additionally, Dogecoin is becoming more significant than it originally was due to the remarkable recovery of crypto space in 2020.
Dogecoin’s technicality
Do you think Dogecoin is technically sound? Not in the true sense. In a sense, it is alright because this coin is just a copy of Litecoin that is technically appropriate. Dogecoin is an online network safe and cryptographic that allows users to send a DOGE to another user in a permissionless manner.
It works okay, but it is not as safe and decentralized as Bitcoin. Right from the start, Dogecoin was not a very clever move. Of course, there are many differences, and it enjoys a shorter block time compared to Litecoin. However, the supply is not limited like Bitcoin’s. We have close to 129 billion DOGE, and a lot more are minted.
The most significant difference is that Bitcoin and Litecoin are managed better with regularly updating to handle bugs and limitations. Occasionally, Dogecoin gets updated, but there are times when it takes years for a new version. This coin is nothing but Bitcoin’s silly cousin who doesn’t take anything seriously. It doesn’t worry about the future at all. The coin just counts clouds when you are busy cleaning the house. Dogecoin doesn’t care nor worry.
Elon Musk’s muse
Elon Musk has a reputation for liking silly random stuff, and since Dogecoin is pretty silly. And hence, please do connect the dots. The Tesla and SpaceX CEO showcases his admiration for Dogecoin on various platforms, especially Twitter. His tweets pushed the Dogecoin’s value to greater heights, and on one particular occasion, the price raised more than 100 percent just after his post.
Elon Musk explained why he likes this coin in a Clubhouse Interview. He said, “Arguably the most entertaining outcome, the most ironic outcome would be that Dogecoin becomes the currency of Earth of the future.”
In actual business, Musk is a much greater fan of Bitcoin. Quite recently, Tesla even bought close to $1.5 billion worth of the currency. While Twitter and memes are on one side, reality and the balance sheet of Tesla are pretty something else, at least for now.
It is essential to note that Elon Musk is not the only big-shot advertising Doge. We have other biggies like Rapper Snoop Dog, and Kiss singer Gene Simmons is also on board.
So should you invest in Dogecoin?
Dogecoin isn’t very available like Bitcoin on crypto markets and exchanges. Coinbase and Gemini do not even have an option for purchasing Doge. However, other major exchanges like Binance offer their support for Dogecoin purchases.
It is similar to owning any other Cryptocurrency when you buy a DogeCoin on exchange. You can do two things: either you can keep the coins on the exchange or put them into your wallet software. Dogecoin.com is an official wallet from the project’s website.
Do you think Dogecoin will hit $1?
It can be very tempting to invest in the currency as the price is soaring. But it is wise to stop for a moment before taking the plunge. Although Dogecoin has a big fanbase and the support of the world’s wealthiest people, it is essential to remember that the project isn’t exciting technically. It does not come close to other top cryptocurrencies like Bitcoin and Ethereum.
It is a company’s stock that produces almost nothing and holds some sofas in an empty office. However, it has a super cool logo with a dog face, and people are attracted to it for some reason. Therefore, the stock price can go up, yes, but it can also go very down, even to zero.
At one point, the price of the DOGE is at $0.26, but around a year ago, it was just $0.002, with a 13,000 percentage of the price increase. Approximately 129 billion coins are circulating with a market value of close to 34.5 billion dollars. The influencers will say that the deal will go up to $1 at some point. And then, the market cap will increase to $126 billion. Anything is possible, but how far can the joke travel?
Final thoughts
It all simply comes down to this. In case you are a professional or a seasoned trader, then you know what you are doing. So it might be a good chance to trade with DOGE. However, if you are not, then it is a risk, and you are simply gambling. It is not advisable to gamble with any money that you cannot afford to lose.

My Favorite Indicators for IntradayThe Indicators which I Use for Trading Intraday is,
Pivot Points High Low (HH/HL/LH/LL)
SuperTrend
ATR Smoothed (By dysrupt)_BuySell version.
These are all the Indicators which i use for trading Intraday on, FOREX, Crypto, Stocks
The Indicators Mentioned above are Tremendously powerful for booking Profits.
1 minute TimeFrame is best, for taking Profits Early.
The Indicators mentioned above has a 100% Accuracy Rate.
Thanks for using your Valuable time. Leave a like which helps me to do better. Follow me for Daily Signals,
Get updates on, FOREX, Stocks, INDICES, Crypto, #--CFD's to be expected soon.

Voltas EW analysis - FlatOm Namah Shivay
Voltas EW marking were very tricky. A lot of different versions are coming.
Om Namah Shivay

Bitcoin 4hr analysis 12-23-2020Good morning again ladies and gentlemen and welcome to my daily analysis of Bitcoin. Today I have the 4hr time frame pulled up and I can see we are starting this day off right. The bulls just wont relent and we are knocking on 24k's door once again. Nice work bulls! There are still approximately one more week left in 2020 and I would love to see us end the year with a bang. With numerous outside factors considered Bitcoin is really showing the world that it is a viable investment that can and should be a part of everyones portfolio in my opinion. No more calling Bitcoin "tulips"... That went out the door when Paypal and Grayscale started scooping up Bitcoin by the bucket full. I literally could go on all day and Im tempted to do just that... But I have a chart to analyze. So lets get to it.
I see a trend forming and we are really respecting the borders of the trend in question. That is why they say the trend is your friend. Learning to identify trends like this is essential... If you can identify trends early you can get some decent trades off. I love trading trends and patterns myself. Pretty self explanatory but I will explain with a shortened version. When the candles hit the top of the trend I will USDT. If it hits the bottom buy back into BTC. Am I always a millionaire at the end of all this? Nope. Sometimes its hardly worth the efforts. As an evolving trader I am learning when I should avoid messing with a long. If the reward isnt worth the risk you should absolutely refrain from entering a position. But if you do want to trade a pattern (triangles etc) or a trend like we see on the chart at the moment, identification is key. Then execution is a must. Learning to set a stop and walking that stop up the trend will lead to profit. I know that this strategy works well for me.
I mentioned this yesterday but the support on the 4hr time frame shows plenty of support below us. The part I have my eye on is the 4hr 50 MA (orange line) along with the top border of the 4hr ichimoku cloud. These 2 indicators are combined and that will likely give traders more confidence. That confidence can lead to a new ATH perhaps. We are so close. Bitcoin has been spoiling us this year. Bitcoin consolidates for a few days and people are already ready to give up LOL. I know I am spoiled by Bitcoin.
People ask me why I dont mess with stocks and the main reasoning behind that is Bitcoin is all I really need. Anything else is just another chart I have to learn and that takes time. Im familiar with Bitcoin and the habits it has. Alts are the same for me. I used to mess with them often but for the last year or so I stuck strictly with Bitcoin. I know some alts could have made me rich simply from a buy and hold. But those alts arent easy to find. Bitcoin is not hard to find and the market has plenty of liquidity which is also very important to me. So that is the main reason I stick to trading Bitcoin.
Over the last 1.5 hours we have seen a 1k rise in the price of BTC. Nice pump to wake up to. 1000 dollar swings are pretty common at these levels. I remember back 6 months ago a 1000 dollar swing was a huge deal. The higher we go the more likely a 1000 dollar swing will be par for the course. Think of it this way.. a 10% swing is common in crypto. A 10% swing would see a $2380 move. That is quite a bit. I am really absorbing all the info I can at these levels and all of you should as well. This data is absolutely crucial. Support and resistance is being carved daily. That is the data we need to pay attention to. As a trader nothing has really changed for me at these levels as far as my strategy goes. I still am religious about setting a stop loss. I still walk that stop loss up the chart following the candles. I also stay ready to buy that dip. Setting alerts with certain apps is a good way to know when the price is moving. I have a lot of alerts that help me stay on top of my trading.
4hr bollinger bands are tightening up. That means volatility is on the horizon. I would love to promise you that the break out will result in 25k Bitcoin but I am not clairvoyant. I dont have a crystal ball. I only have logic. And logic tells me that risk management is the name of the game... Or the name of my game. I am adamant about that stop loss. You see if the bottom falls out before I decide to sell that stop loss is all that stands between me and a loss. I like this method. Walking up the stop loss in a safe effective manner allows me to stay in the trade as long as I want and keep gathering profit. Whats not to love about that?
There has been a bit of fud flowing around social media this A.M. about XRP and how the SEC filed suit against the coin. It caused a massive dump. I know we all enjoy poking fun at XRP but the real deal is I dont like seeing anyone lose their hard earned money. I hate when external forces affect the charts negatively. When its good it doesnt bug me. Like hearing Paypal was buying BTC was great external news that wasnt really technical. But that doesnt mean it didnt have an effect on the charts. XRP will be okay in the long run I imagine but for now things could get worse before they get better. Only time will tell. I dont usually talk XRP but I just wanted to bring it up as many of my followers do mess with XRP. I will stick with my Bitcoin for now and let the chips fall where they may. With the new stimulus seemingly in limbo this could equate into volatility. I just have that feeling...
First no stimulus money for US citizens, then it went to 600 USD per person. Now our fearless leader is putting his foot down and saying they need to increase the amount to 2k per person. I have no clue how this is going to end but you better believe Im watching and paying attention. The way this turns out could have big repercussions on the charts. I think if there were no stimulus coming traders may be more apt to remove BTC from their holdings to meet tax liability. But with stimulus money on the horizon it may keep these investors from removing that BTC. Especially if they got 2k per person. At this point its all speculation but that is a lot of what I do. The stimulus could effect BTC in more ways than just taxes like I mentioned. By printing these checks again it will cause another bout of inflation. That is just how it works. They will create money out of thin air and that will in turn dilute the supply we already have. Meaning that 1000 dollars in your bank account is more like 900 after the inflation. This will undoubtedly have an effect on the price of BTC as well. It may go up in terms of USD and we all love seeing that. But that doesnt mean BTC is gaining value. Rather it means the US dollar is losing value. This has a lot to do with this recent pump and could fuel another tear up the charts. Even putting 30k into play. Who would have thought I would even bring 30k up in 2020 LOL. Anyways I hope you all have a great day! Make good choices folks! And always remember... WTFDIK???
TLDR: 23650. Need I say more?

Basics of Dow theory trading strategy forecasts:What is Dow theory?
The Dow theory is a financial theory that says the market is in an up-trend if one of its averages (i.e. industrial or transportation) advances above a previous important high and is accompanied or followed by a similar advance in the other average. For example, if the Dow Jones Industrial Average (DJIA) climbs to an intermediate high, the Dow Jones Transportation Average (DJTA) is expected to follow suit within a reasonable period of time.
What Is Support?
Support refers to the price level that an asset does not fall below for a period of time. An asset's support level is created by buyers entering the market whenever the asset dips to a lower price. In technical analysis, the simple support level can be charted by drawing a line along the lowest lows for the time period being considered. The support line can be flat or slanted up or down with the overall price trend. Other technical indicators and charting techniques can be used to identify more advanced versions of support.
What Is Resistance?
Resistance, or a resistance level, is the price at which the price of an asset meets pressure on its way up by the emergence of a growing number of sellers who wish to sell at that price. Resistance levels can be short-lived if new information comes to light that changes the overall market’s attitude toward the asset, or they can be long-lasting. In terms of technical analysis, the simple resistance level can be charted by drawing a line along the highest highs for the time period being considered. Resistance can be contrasted with support.
what is support become become resistance?
when price breaks the resistance and after it will be create a support that same level this situation was called by support become resistance.
what is resistance become support?
when price breaks the support and after it will be create a resistance that same level this situation was called by resistance become support.
How To Read The Support Level On Chart?
Share prices which are subject to recurrent oscillations command the attention of investors at all times.
Aiding investors make their move; it is significant for them to read the resistance level on the chart which can bring a chance for them to make a good buy when the prices are balanced to rise higher.
How To Read The Resistance Level On Chart?
In disparity, when the price enters the resistance level, the market is noticeable of traders’ combat with a pressure to sell, when the price of the stock is balanced to fall further, going by its past performance.
Hence, these two factors are important for every investor to base his entry and exit moves in the share market when these determinants go a long way in representing the direction of the price of the stock, whether it will rise or drop.

EURGBP AnalysisUpdating the EURGBP version.
Taking into account an extensive wave 1, I believe that wave 3 will not have the strength to reach 1,618% of Fibo, although this can happen.
For the rest, the same idea as the previous analysis!

Bank Nifty Trading Strategy for 28th Feb'2020.The expiry went as per plan:- No breakout or breakdown, ,range-bound with the premium version. Shorted in the morning, covered in a lower end of the channel. The rest of the day, the group preferred to relax with morning profit.
No Change in the plan as that of today, I will be bullish based on- 1st sign of strength will be above 30435, 2nd confirmation will be above 30630 and final validation will be above 30,758.
## Daily/Weekly/Monthly Resistance:- 31,467, 31650-31750 / 31905 (23.6% retracement of 32613 & 29612).
## Daily/Weekly/ Resistance / Supply Zone :- 31,113-31,183
## Tomorrow Resistance / Supply Zone :- 30946-31010
## Daily/Weekly/ Resistance / Supply Zone :- 30521-31630
## PIVOT:- 30,308-30,345
## ** Monthly Support Zone 29,994-30,208
There are two types of trades:- Range Trading and Breakout Trade.
1. Range Trade:- Buy/SELL in above or below Pivot Zone & GREEN Zones, SL is zone lower point, T 100 to 300 points/resistance zone.
2. Breakout Trade:- Once a pivot/zone is broken, keep SL as lower / upper end of the zone for next zone as the target or target 100 -300 points.

NIFTY for 28th JanuaryDue to lack of time I am posting a smaller version. Corona virus is wrecking havoc across world markets. All european markets are down by more than 2% and DOW JONES INDUSTRIAL AVERAGE is down by 470 points (-1.62%). FIIs were net Sellers today and DIIs bought and sold almost same amount so no particular direction from DIIs. Option chain build up shows 12,200 as strong resistance and 12000 as a logical support, meaning some buying might emerge tomorrow there. But for now I won't go for buying Nifty. If at al want to buy take chance at 12000 with SL of not more than 25 points. On daily charts, Nifty is going to break below secondary channel and is just above 50 DEMA. Some rockets were fired in US embassy area in Iraq last night. So geo-political situation plus outbreak of corona virus will ensure that indicesfind new lows till some encouraging news is seen on these fronts. Selling levels are shown on 15 Min chart with SL and target.
All the best. Happy trading.

Triangle coming to an end. US tax deadline April 17thHello hello,
If you notice in the past, once people start writing obituaries for popular coins it usually is followed by a huge run up.
We have a perfect storm coming up here:
1. Negative market sentiment
2. Tax deadline is coming up
3. The triangle has it's point directly on the day Tax is due.
This is not financial advice, just some observations I've made.
Please give me a like, I'd love to jump into the chat and I'm too cheap to buy the "pro" version.

Why Indian Traders Must Have Trading view as Charting software I have seen Many Brokers in India and Abroad, i have seen discount brokers and full service brokers
But i am expressing my view today after using Trading view i have increased my accuracy to 99 % , Yes i have increased my accuracy , i have seen the worst trading platforms in Indian Brokers , they just do not want to improve their platform and want to die in the same old fashion exe based software
Trading view is giving full plugged tools in order to test your strategy , in order to check weather you are correct or not by using alternative tools or indicators , it also allows you to create your own pine software and add in the trading view , you can check the software created by you with percentage of success , back test every creation in coding , check for best results before applying in real trading
its wonderful software , i have ever tried and used so far
I do not think of brokerage charges if trading view is associated with any Indian stock broker , because its having a very sensitive tools to identify market momentum
Let me give more insights what it has in Pro and other versions ,
01) Market Profile : its one of the tool used to identify order flow in the live market , if you know the buying orders are taking place at certain x value more than any other price range , then you would like to buy at X value , because you want to be always ahead in your trading , Market profile is added and premium tool and using the tool need additional education
02) Volume profile: its one of the tool used to identify where the highest level of volume is traded with best price , again if you want to be in the competition of success you would like to have it in your chart
03) Advance software Called Neural networks , its one of the software which helps to identify the change of price action in the past and possible next level price action with in specified time duration , its an algorithmic software , it works like brain net work
Before you see Nifty Crossing 12500 and then do not run for searching what to do , have education in stock trading , have additional level of understanding in Advanced tools and start using Trading view in full plugged to explore the unexplored features , Make your self as step ahead in the stock market
Good luck
