Symmetrical triangle pattern in bankniftyIn this, price formed a symmetrical triangle pattern. (zoom) hopefully it will upside and we will see another rally :)
Search in ideas for "Zoom"

AWL ascending Triangle !!NSE:AWL
#NSE:AWL formed beautiful ascending triangle.
High chances to zoom once sustain above resistance. Huge targets.

JINDALSTEL 8% Zoom, Next target Updated !!NSE:JINDALSTEL
#NSE:JINDALSTEL #CupandHandle pattern shared...
with a gap down stock done beautiful rally 8.2%.
Even safe entry delivers 3.5%, Expecting 460 levels.

BTCUSDT: Look at the big pictureDon't get fooled by small pumps. Zoom out and look at the big picture. BTCUSDT is forming a bearish channel; the next major support is near $12k.
Like, share, and engage with my ideas.

NIFTY - Intraday Buy Setup NSE:NIFTY
Buy Setup is there with good risk reward . use the oppurtunity to enter the buy with given stoploss below buyers zone . zoom and unzoom the chart for clear picture if u face any issue
\
Happy Hunting
Chintamani.

USDINR - will it appreciate ????DXY above 107 can zoom to 109
INR still resilient compared to DXY
Still i think it will have to do catch up with DXY
Levels marked for trading...
I think 81+ coming on INR soon.

COALINDIA BONSE:COALINDIA
#NSE:COALINDIA BO Resistance, Post sustainability chances to zoom
Levels marked for practice.
Check out the other levels shared.
Happy LEarning


Long with Inverted double bottom in makingIRCTC can retract till 618 Fresh buy can be initiated with 610-618 as SL.
If this reverse from 600-610-618 look out for Double bottom pattern and Zoom till 700 1st target and 900 2nd Target.
Only for Educational purpose.

MULTIPLE DOT IN BANKNIFTYHello every one if your zoom in the chart which was uploaded earlier, you can find a great multiple DOT level achieved this particular one chart.
for you ready reference particular chart attached. happy trading and have profitable week...
we are here to provide you 100% accurate chart and as we achieve the same thanks....

Bitcoin to 34k coming Bitcoin in H4.
I hope you like the content. I wanted to keep this forum where i can share my ideas in detail and why i think so.
Execution of ideas happen in my trading forum which is has so cost price for the real honest neat and clean trades/ content
Ok let's move on , Today gona share Bitcoin in H4
As said before. Have guts , have balls to buy it's real buy and we may see momentum soon. Point to understand here is , more the fear more the blood more the opportunity, you want to grab it or not upto you.
Tech Analysis, if you zoom out and see what bitcoin did is bear fakeout, it broke the trendline downside, but keep the PA in golden pocket. It's now ranging in ultra critical point i.e. Breakout point.
Sentiments for today: I am expecting upside momentum because today's cpr is so clean and wide and there is no agility there. Ya. Price i am expecting as per W shape recovery in H4 approx 34.6k in coming days.
Bullish as long as 28k secured.
Much Love
@thebigbull9

Could zoom past 500After a downtrend the stock has made a double bottom pattern and is ready to move upwards.
Only for education purposes

Just dial on verge of a break out, stay tuned! Just dial looks like is ready to zoom
On verge of a breakout
Got huge volumes
Above 905 can rally

Lemon Tree Hotels IdeaSuggestion Reason:
1. Volume has increased in the last few days. So it should go for the 1.5-year breakout.
2. Increase in the number of people are going for vacations after covid and this will rise in the winter season.
3. 200 EMA Support
4. It can come for retest also if it fails to give breakout with good volume and will make an ascending triangle pattern.
Already marked important levels, zoom out to see details

Just ONE more month and then ZOOMFollow me for more such content ahead...Till then,
HAPPY TRADING :)

Nasdaq 100 InvestmentAn overview of the Nasdaq-100 index (NDX)
The Nasdaq-100 is one of the world’s preeminent large-cap growth indexes. It includes 100 of the largest domestic and international non-financial companies listed on the Nasdaq Stock Market based on market capitalization. It is home to the four companies who have touched the trillion-dollar mark in the US: Apple (AAPL), Amazon (AMZN), Microsoft (MSFT), and Alphabet (GOOG, GOOGL).
The prominence of these companies along with other technology leaders such as Cisco (CSCO), Qualcomm (QCOM), Intel (INTC), NVIDIA (NVDA), Micron (MU), Adobe (ADBE), Advanced Micro Devices (AMD), and Baidu (BIDU) often create an impression of it as a technology index.
While technology is a dominant segment in the index, it is well-balanced by sectors such as consumer services, healthcare, consumer goods, and industrials which constitute the other 50%. Consumer services companies account for almost a quarter of the cap weight, up from 17% a decade ago.
Within healthcare, Nasdaq-100 is home to some of the most prominent biotechnology companies such as Gilead (GILD), Regeneron (REGN), Vertex (VRTX), and Amgen (AMGN). These companies are working on cutting edge research. Recently, Regeneron Pharmaceuticals announced important advances in novel COVID-19 antibody program while Gilead has initiated two Phase 3 clinical studies to evaluate the safety and efficacy of remdesivir (investigational nucleotide analog) in adults diagnosed with COVID-19. China’s health authorities have initiated two clinical trials in patients to determine remdesivir’s potential for treatment for the coronavirus.
If we look at current market trends, companies such as Zoom (ZM) are surging on the work-from-home model while others, such as American Airlines (AAL), and Expedia (EXPE), are struggling due to travel halt.
The index holds consumption-led companies such as Netflix (NFLX), Pepsi (PEP), Costco (COST), and Starbucks (SBUX), some of which are suffering due to supply chain bottlenecks and lockdowns while others are partial beneficiaries of the current chaos.
As we look at the larger picture, the NDX is a diversified mix of sound companies and is better positioned compared to the S&P 500 due to the negligible or complete absence of sectors such as energy and financials. One thing which is unique to this index is its focus on companies which are symbolic of innovation and future growth. Since 2008, the Nasdaq-100 has generated higher growth rates than competing indexes, such as S&P 500 Index and the Russell 1000 Growth Index.

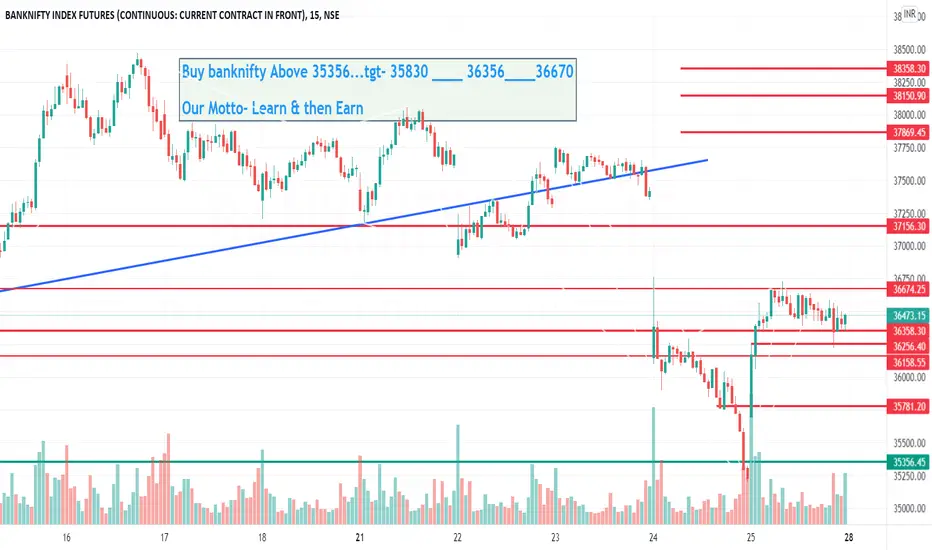
Yes Below 36256, Once Break This Level, & Stay Below This Level #BANKNIFTY_ALERT:_last Closed @ 36476
DEKHO KYA BOLA THA MANE - ABOVE 35356, IF Stay Above this level, WILL ZOOOM TO KISSS- 36156_36356
Yes, Once cross 36356, level, & Stay above this level, will zoom to see sharp short-covering !!
Upto 36674_______37156
Now WHAT TO EXPECT ???
Yes Below 36256, Once Break This Level, & Stay Below This Level
Panic Upto______35780__________35470
YES , OnCE BREAK THEN KEEEP SL 36630 level, !!
36856 WILL ACT AS LAXMAN REKHA YES ONCE CROSS THIS LEVEL, WILL ZOOOOm TO KISS- 37356________37630 level
Yes..No Doubt!!!
YES AROUND- 37870_________38156________38356, in THESE RANGE WE WILL SHORT.!!!
No IF NO BUT !!
NOT INTERESTED TO SELL ANYTHINg @ lower Level,
CRUCIAL SUPPORT @ 34256____________33870
Yes....IN PANIC WILL THINK FOR BUY, FRIDAY ME BUYING KARUNGA , NO SELLING
MONDAY BHI BUY KRUNGA.................. WILL MAKE STRATEGY !!
WaveTalks - AxisBank : Bulls are Waiting!!!50 WEMA (Weekly Exponential Moving Average) could give some bounce upside holding as support/ Once Stock crosses above 816 as confirmation level, It will zoom to 865 & 1000+ Targets in few weeks / months ahead.
A Good Portfolio Stock to be checked.

Just ONE more month and then ZOOMFollow me for more such content ahead...Till then,
HAPPY TRADING :)


opportunity in TATACHEMaccording to trends this result is outcomed. strictly personal analysis required. no tip. i am not sebi registered ... Stocks can zoom upto 1350 easily upto end of march month

Breakout I'm the cardsA parallel downward channel Breakout is on the cards in Exide Industries
May zoom past 200 easily

NIFTY Research Report 2: Elliott Wave And Price Action analysis--------------------------------------------------------------------------------------------
Timeframe: 1- Day
Theory: Elliott Wave
------------------------------------------------------------------------------------------------
Click here to read research report 1:
------------------------------------------------------------------------------------------------
Timeframe: 1- hour
Theory: Elliott Wave
-------------------------------------------------------------------------------------------------
Let's zoom the 5th impulsive wave of wave ((5)) to know the current situation of the Wave cycle.
The ending point of wave 4 is the starting point of wave 5.
After the accomplishment of, triple zigzag, the price has started an impulsive wave, and it has broken the X wave.
X was had holder the correction, and break out of X wave increased public participant in nifty.
Wave formations of the impulsive wave 5 of wave ((5)).
Wave ((i)) is a leading diagonal.
Wave ((ii)) is a zigzag correction, retraced 50% of wave ((i)).
Wave ((iii)) is a five-wave impulse where sub-wave v is near to being completed.
After the completion of wave ((iii)) , the price will start the corrective wave ((iv)). The question is, how to know if the corrective wave started or not?
The best way to find the starting point of the corrective structure is the breakout of the base channel.
If the price breaks the base channel, it may end near the previous wave (iv). I have already mentioned levels in the daily time-frame analysis.
If the price couldn't break down the parallel base channel, it can create a new high, but it will give a short pullback to increase public participants.
-----------------------------------------------------------------------------------------------
Timeframe: 1- hour
Theory: Price Action Analysis
-------------------------------------------------------------------------------------------------
Price has broken out the downtrend channel and started an upward move.
However, the current bullish move looks strong, but the price can't make a new high without proper retracement.
Nifty can't get public participants Without trend pause( correction).
If the price breaks the parallel channel, we can expect the following support level: 18232-17944-17604-17261
Please note that the price is bullish above 18250 .
If the price takes support on the parallel channel, it can go for 18600-18845+ to touch the upper band of the channel.
