NDX, Dr Andrews would be proudI do not track this scrip:NASDAQ but I just wanted to take a look after the recent big gap down and it surprised me how well it seems to be following the basic pitchfork trading theory
The points mentioned on the chart correspond to the following rules:
(0) prices at any point will gravitate towards the median line
(i) price after reaching the median line will reverse OR (ii) zoom with big candles/GAP through the median line
(iii) price will reverse from the lower and upper parallel (support/resistance lines) towards the median line until it doesn't. At some point price will go outside the pitchfork's boundary lines(the prongs), at which point the trend character may be said to be changing.
Search in ideas for "Zoom"

SCI - Strong Stock looking good for an upmoveExport container companies revenues have increased due to hike in prices. SCI has given a breakout from recent high and it can zoom up.

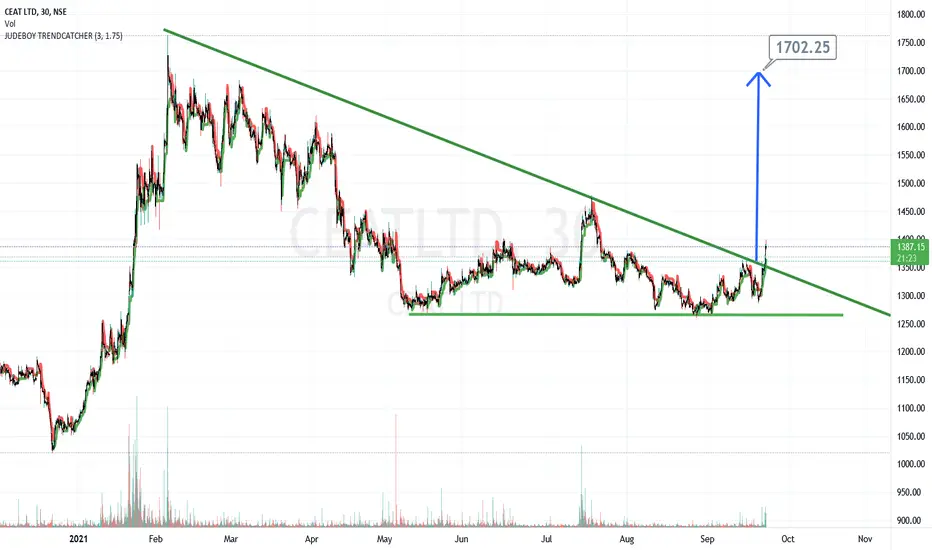
CEAT trye rolling upclear breakout..will zoom up to tgt.....folllow stoploss which is price going back inside triangle

Sequent Scientific | DailyLets Zoom-in to our Weekly chart shared previously and see what's happening in Sequent Scientific.
As mentioned in our previous weekly view, a weekly close below 214 level may result in trend reversal (Downtrend) for this stock.
Now, what can we see on Daily chart?
1)Today's close took support around 214-215 zone.
2)Bullish RSI divergence can be seen. Where Price making LL & RSI making HH.
3)RSI on weekly support (Check on weekly chart).
5)Upside gap yet to be filled.
Indications are at positive side but at the same time maintain cautiousness around 214 zone.
Lets see how things unfolds!!

NIFTY pathfinder for the 3rd week septemberWait for a correction...to the two or either tgts and then buy for a zoom up to the previous high

$HGX DailyA little practice chart from zoom homework. Best Alignment I could do was 219 by 12th Sept. Which I know would be dire straights lol. There are some other notable targets but the way the measurements kept fractalizing was rather intriguing.


ZEEL ascending wedge breakoutZEEL ascending wedge breakout wait for two close above 263 and it will zoom to 400

1 yr charttest Ensure that you zoom/pan such that the oldest date you desire is visible on TradingView before publishing the chart. Too many indicators or too low a time resolution will increase the data points and potentially overload the free server. Avoid this by hosting/running the script on your local machine or scraping multiple times with fewer indicators and manually combine the CSV afterwards.

Simple Trade Setup | Havells | 09-08-2021NSE:HAVELLS
Simple Trade Setup for Havells For date 09-08-2021.
Chart and levels are easy to understand.
Trenline-3 which was working as resistance before now it is working as support. You can zoom out and watch the trendline for your reference.
Do comment your doubt or suggestion.
all the best for the upcoming trading days.

DMART: All targets done!Please check my idea posted about DMART on 21st July. Both targets have been reached. 5% return in 14 days. :)
Jul 21
DMART has been facing rejection from the 3400 level since the mid of June 2021. Despite these multiple rejections,
the lows that it makes are gradually becoming higher. It took support at 3250 on 18.06.21, then again on 29.06.21,
then it formed the next swing low at 3300 on 15.07.21.
___________________________________________________________________________________________________
If we zoom in to the 30 min chart, we can clearly see that the previous times when price reached the 3400 zone, it
was rejected severely, but on the latest occasion on 20.07.21, price has stuck close to that level for a couple of
hours and has closed very near to 3400, at 3397.
___________________________________________________________________________________________________
The formation on the daily chart resembles an ascending triangle and if we look closely, the volume has been
positive and increasing the past few sessions with above average volume on 20.07.21. If DMART does finally break
past this level, a long can be initiated if the price sustains above the "LONG ABOVE" level for 15 minutes, keeping
the following levels in mind:
LONG ABOVE: 3425
STOP LOSS: 3335
TARGET 1: 3515
TARGET 2: 3600
Remember, trade your plan, risk management is key.
Like and follow for more. :)
___________________________________________________________________________________________________
Jul 27
Trade active
Jul 27
Trade closed: target reached: Target 1 has been achieved at 3515 on 27.07.21.
13 minutes ago
Trade closed: target reached: Target 2 has been achieved at 3600 on 04.08.21.
5% return in around 14 days.
:)

#EICHERMOT - Chugg A-Long#Eicher Motors - At it's 200 EMA supports should zoom uphill towards, 2610, 2645 and 2710, just long as it stays above 2485.

STRONG BUYERS HAND IN SUNPHARMA!!!!!!!!!!!!! READY TO ZOOM 12%Holding above 61.8% for a very long-time.

DMART LONG : Multi Time Frame Analysis.DMART has been facing rejection from the 3400 level since the mid of June 2021. Despite these multiple rejections,
the lows that it makes are gradually becoming higher. It took support at 3250 on 18.06.21, then again on 29.06.21,
then it formed the next swing low at 3300 on 15.07.21.
___________________________________________________________________________________________________
If we zoom in to the 30 min chart, we can clearly see that the previous times when price reached the 3400 zone, it
was rejected severely, but on the latest occasion on 20.07.21, price has stuck close to that level for a couple of
hours and has closed very near to 3400, at 3397.
___________________________________________________________________________________________________
The formation on the daily chart resembles an ascending triangle and if we look closely, the volume has been
positive and increasing the past few sessions with above average volume on 20.07.21. If DMART does finally break
past this level, a long can be initiated if the price sustains above the "LONG ABOVE" level for 15 minutes, keeping
the following levels in mind:
LONG ABOVE: 3425
STOP LOSS: 3335
TARGET 1: 3515
TARGET 2: 3600
Remember, trade your plan, risk management is key.
Like and follow for more. :)
___________________________________________________________________________________________________

kansainer took a break out and consolidation is looking bullish The stock named kansainer is currently trading at 599.90 it took a nice channel pattern break out few days back and is into consolidation buy now in small quantities as it can zoom up very quickly if conditions favour
Target1 - 644
Target2 - 671
Stop loss - 580


IOC: Short term & Mid term view- BullishDaily MACD Cut may come on upcoming days and weekly indicators are positive. In Weekly Ichimoku chart, Price took support on conversion line and Conversion line above the base line. Lagging span above the day close. Once it coming out of the cloud, price may zoom up further. Weekly MACD crossover may happen on upcoming months. These parameters may help to reach the targets.
Vijayaraghavan.K,
Kovilpatti, Tuticorin dist.

Wait for the breakoutIt's a very nice setup buy or sell it will depend on the future price action.
When to buy -
If the breakout is on the upper side.
When to sell -
On the price breakout of the counter trendline.
ZOOM IN FOR A BETTER UNDERSTANDING.

JAIN IRRIGATION - Cautiously Risk Hai tho Ishq Hai !!!Very low Overhead supply. It could just zoom off.
Inverted Head and Shoulder Pattern.
Be vigilant with the stop loss.

US OIL READY FOR THE RALLYAfter nearly 4 months of consolidation, US OIL about to break the crucial zone of 67-68 to witness 75 levels. The bullish momentum above that can zoom the price like anything!

Natural Gas about to Zoom! Natural gas sustaining above 230-231 can lead to it going till 265, breaking of that can also make it touch 35o levels as well.
