Confluence and Confirmation in Kotak BankTriangle pattern breakout near confluence area. Can zoom till 1990 levels!
Search in ideas for "Zoom"

BREAKOUT TRADE FOR EDUCATIONAL PURPOSE ONLYBreakout trade : once cross 42 with volume then it will likely to zoom to kiss 50 level in short term.
FOR EDUCATIONAL PURPOSE ONLY. NOT A RECOMMENDATION.

TALBROS AUTO - Ready to Zoom tomorrowPersonally holding from 205...and much awaited breakout given today. Gap up opening expected...
240 plus is minimum for this move

Nifty 11450 in coming months - Is it possible?Hi all,
I have posted a trend analysis i have done on 11D time frame candles, I use it too often as i feel it is good time frame to enforce a sentiment in market and trend.
Looking at trend it seems like currently Nifty is in overbought zone and recently has been supported by support line of 14200-14300. Current 11D candle is still developing though candle body is small with longer tails on top and bottom. With such setup i have also included a 50% retracement line, Do you think Nifty would go down till 11450 before getting stables in longer parallel channel it has followed from years.
Do zoom out to see trend formed in parallel channel over years.


Euro/U.S. Dollar ,Short term viewSupport and Resistance is very clear ,wait for another upcoming candle and take a short term trade.
If you will zoom out the chart so you will see a Head and shoulder pattern is also getting formed.

Delta should go ZOOM !NSE:DELTACORP just finished its correction and will repeat its history of gains!

AS PER PATTERN NIFTY COMING NEGATIVE IN RT-PCR MAY ZOOM A PATTERN IS FORMED IF NOT FALSE LEVELS ARE MARKED,

LEMON TREE HOTEL - History and pattern repeatsAfter the quick zoom after a 3 Volatility Contraction Pattern last time around, here is now another 3VCP if not more.
Low Overhead Supply makes the journey faster to its target.

LICHSGN ON 15 MINS CHARTLic housing has broken its major trendline & its sustaining below 200 MA. Talking about bigger trend we can observe the correction that happened after trendline broke had sustained at Fibonacci 61.8% level. Mostly stock that gives reversal from golden zone tends to continue its trend with good volume but in case of LIC HOUSING the volume has been decreasing thus indicating bears in control.
Also if we zoom in, we can look there’s a good chances of stock to test its support for 3rd time making it major support. We also use Fibonacci trend continuation tool & we found out that the major support and trend continuation Fibonacci level 61.8% is exactly at same price. We believe we can see a good downtrend for Tom and day after tomorrow. Trade safe.

Nifty on major support of trendline - April Month analysisHi guys,
Today's expiry session was very much volatile but one would have managed this volatility if he would have known where are the major supports of trendline in short time frames.
Although today the expiry happened on the major support of Trendline A & B. Both the trendline played as a major support in Nifty. However, If you zoom in it just expired exactly on the trendline. For the past weeks trendline C has also acted as a good resistance and you should keep this in mind once Nifty goes above 15000.
If on the daily time frame, Nifty manages to close below the trendline A & B then we'll see more fall in Nifty to 14000 and below.
Also I have a bearish view in Market as of now as the major bullish trendline is broken. It can go to retest that trendline and then again falls down. So, I am not holding any cash positions for short term, and I will only buy until & Unless trendline C is not broken.

AMBUJACEM ON 15 MINS CHARTAmbuja cement has been trading in a Rangebound market for a long period of time. Zoom in on higher time frame and we can look that every time when the price of the stock comes near resistance, there’s a good reversal happening. Historical data suggest that same might repeat again only if there’s a good volume. Also to check how much this trend can continue we used Fibonacci extension and we plotted that the 61.8% level and resistance level are around same price level. That means the reversal chances are still high.
If stock open flat or with gap down wait for reversals pattern formation for short trades.

INDUSBANK IS 2ND BANKNIFTY TI LOVE IT! GRAB THE OPPORTUNITYhttpsNO NEED TO SAY ANYTHING
WE CAN CLEARLY SEE H&S PATTERN
ALSO IF YOU ZOOM OUT 1D CHART YOU CAN SEE BEARISH FLAG
-SHIVAM MISHR
MGB

BHARTI AIRTEL under range bound moveBHARTI Airtel has fallen more than 10% and started a range bound move......
Usually after a fall if a stock comes under range bound moves it means the stock is
under accumulation stage.
If the stock breaks the upper zone with
volume it will be a fantastic breakout the
Stock may zoom from that breakout level

Nifty - The Bat Unfolds It's Wings!! (Read Fully Before Acting) In continuation to my Nifty update posted on 27th Feb, I'm getting inclined towards Scenario 1 mentioned in the update and the Alternate count mentioned in it, that we could be in Wave 2 (Wave count marked in Red) of a very large Wave A correction (NOT depicted on the chart).
If we zoom into Wave 2 , it's unfolding as an irregular A-B-C pattern (Wave count marked in Orange) and we are currently amidst Wave C up of this pattern. Since as per rule, the 3rd Wave cannot be the smallest, I've labeled Wave (iii) where it is depicted in the chart (Wave count marked in Blue). So, a Wave (v) up may still be left to unfold ( Caution for Day Traders who may be wanting to go Short ), which may push the price up to 15337 which is 1.618 times Wave A (as depicted on the chart in Blue dotted line), thus completing Wave C and the irregular A-B-C pattern and from where Wave 3 down should commence.
Cheers !!
NOTE: This view will be invalidated if the prices cross 15350 with force.

BEML: Nested Inv Head & Shoulders + 1Yr plus Resistance BO! 🔥A small inv H&S in the right shoulder of a bigger H&S. You have to see a little bit with zoom in daily TF itself. Multiple touch TL BO. Volume spikes. Multiple confluence. What else is needed ?

Maruti - Weekly (Long) And Daily (Short) Time Frame AnalysisHi Folks,
Maruti has completed it's 1st and 2nd of the larger degree and also seemingly the 1st of one smaller degree (the "ONE-TWO, one-two" phenomena) of the main 3rd.
The 2nd of one smaller degree seems to be brewing now.
When we zoom into the section of one smaller degree on the daily charts (This daily chart is in the comment section), wave A of the 2nd seems to have got completed at 23.6% (7152) and we may be in the B wave up and the ensuing C wave may move down towards 38.2% retracement (6673), 50% retracement (6162) or even 61.8% retracement (5651) after which it will acquire wings to take it's flight for a 3rd of 3rd!!
Note : This view would be invalidated if the price crosses resistances 7880, 8080, 8330 with force.
Happy Investing !!

UPL: Perfect Fibo retracementsUPL has given a perfect bounce back from 50% fibo levels and taking a support at 32% level now. As the stock has not rallied with index after sudden fall after results. It can zoom again to touch its levels on the chart for 580 - 600 levels.
All levels are mentioned on the chart.
DISC: please consult your financial advisor before making any bet.

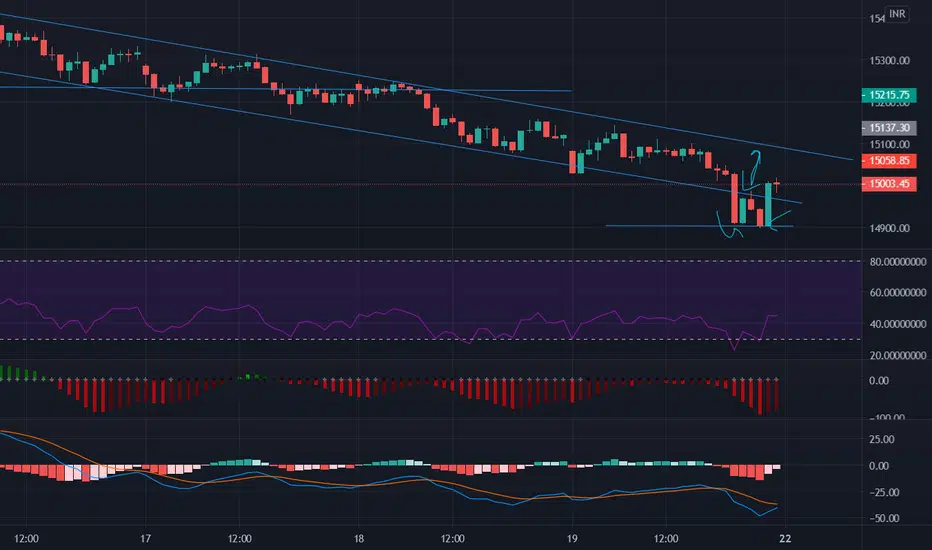
nifty trading in channel with support at 14900 The chart shows two support.
one is in between the parallel line which can keep the momentum for nifty .
the other one is the support at base (marked by two arrows) , please excuse the drawing precision.
We believe nifty will trade in range next week and support may be at the base drawn (please extend chart to 30 min Time frame and zoom out, you will see a very distant support on the same line far off---NIFTY REVERSED EXACTLY 5 TIMES TODAY FROM THIS LINE on 5 min TF).
Once again proved ----RSI is king ...RSI 17 reverse
RSI 26 reverse .
Anything below RSI 28 , one can go long since 8/10 times , the market will reverse from that RSI
Buy Raymond above 336 levelNear 200 EMA
Near to break out
RSI in reversal phase.
Breakout above 336 to be zoom up to 375-400 level
Trend reversal below 310 level.

DOUBLE HEAD AND SHOULDER U MAY GO LONG ON BHEL ABOVE 44.3 FOR TARGET OF 50 ..52...55...59,,STOPLOSS 40 RS.
DOUBLE PATTERN AS U SEE.. ONE IS VISIBLE AND OTHER ONE IS FROM 13 JAN..U MAY DRAW IF U ZOOM IT ,DOUBLE TOP/
CROSSED 50 MOVING AVERAGE...IT HAS TRIED 3 TIMES..RETEST ALREADY DONE TILL 38 ,,,NOW IT MAY BOOM..
ALL INFORMATION ON CHART

Trade Idea #13, CANBANK | Long-term target - 350The reason for 350 Target:
1) The overall setup is bullish
2) The price is trading in a Channel Pattern Monthly TimeFrame , Zoom out to know why I have mentioned the target as 350
3) The bank is taking some reforms and will be one of the top-performing banks in India.
Educational Purposes!

LEMON TREE HOTELA breakout from the triangle would zoom up for nearly 18% while moving in the channel and possibly breaking it too.
