buy wockhardt!CLASSIC accumulation pattern bounce! buy for a target of 350 first,then 550..
very convincing long term buy here too and as i have published before since 200 levels.. looks ready for the big move here after some major consolidation on the weekly.
ZOOM out for longer term targets..
Search in ideas for "Zoom"

What happens NEXT ?Generally Bullish Stock. is it now Over Sold range ? Contradictory messages here . The REVERSE Divergence says Go Bullish . Zig Zag says Go bullish . However the Reverse Channel clearly shows that Volumes are higher at RED candle seeking to push below the Reverse Channel . We have just seen a low volume Spring . usually a low volume spring means its a fake spring. So ? as soon as over head selling will come , Buyers will be overwhelmed and Prices will fall under their own weight .
Anyone out there who can guide me , most welcome. My own Plan is to wait. Wait for next day action. A Gap UP could be a most perfect trap. I will wait for net candle .. wait to see tyhe candles and volumes . Wait atleast 2 hours tomorrow. DONOT worry if prices zoom away.. THEY will usually retrace. We need to be safe rather than sorry here !


ITC : Bullish Divergence on PullbackITC is one stock that is exhibiting 4 strong buy signals:
1. Price Action - The stock has been trading in a price action value area as indicated in the box. Can zoom out to get a better view. See the linked ITC idea on how to exploit it best.
2. Regular Bullish Divergence - There is a clear bullish divergence as indicated on chart.
3. Declining volumes also confirm the divergence.
4. Pullback from 50 DMA - The stock has taken continuous support from the 50 DMA since its uptrend in May and unless its breaking that trend due to a significant correction in the Market over the next week, the pullback offers a good entry point.
So I would be going long on CMP with a SL at 192.
Risk averse may want to take positions above 195 (50 DMA).
Immediate targets would be 196.5, 198, 200, 202.
If it sustains above 202 on the hourly chart - there is a gap to fill opening targets 207, 210.
P.S. I see a lot of traders here posting statutory warnings about how they aren't responsible if the reader loses money by following the idea blindly. Same Pinch!

IOC looks Tradable!IOC rallied to a key resistance area
I shared the 4 hour chart so that you can identify the area.
Zoom into the picture to get a perfect visual!

LT : Upar Jaane ka RaastaLT is back in its value area after a downward dip breaking the trend line. Please See linked ideas for details.
Key levels are marked on chart for the upward movement and positional trades.
The stock saw short covering when it touched 900 leading to an immediate rebound.
The OI Status as on Friday is over 20 Lakh open interests for 950 (5Lakh) to 1000 levels (10Lakh) with 900 being the support (3Lakh).
So there is a definite bullish bias to the stock.
Positional Intraday Ideas:
Go long above 930 for 945, 965, 980 with SL at 910; Trail SL after 945
P.S. You will need to zoom out to see the long term FIB retracement levels for key supports and resistance levels.

Suryaroshni - Morning Star vs Gap Fill All levels drawn on chart.
111 is the major support and 122.5 is the resistance - can zoom out and see the Fib retracement levels.
Positional Trades:
Go Long at 117 for 118.5, 120.5, 122.5 with SL at 114.5
(For the Morning Star hypothesis to be true, it should gap up and open in 116-117 if not higher)
Or
Short below 114.5 for 113, 111 with SL at 115.5 for the Gap to get filled.

DIVISLAB | Trendline Support +RSI divergence convincing for longPlease zoom out and see the chart to see clear picture
1) PCR is 58% with highest Open Interest @ 2300, 2400 levels.
2) Trendline Support with RSI divergence in 30 min, 1 Hour, 2 Hour time frames
CMP : 2161
Target : 2250, 2290
SL : 2135

INFRATEL FOR INTRADAYInfratel has come out of the support and retracing at the previous support perfect area to take a short call
Please zoom into the 15 & 5min chart to understand the price action!

watch for long term Trendline breakoutbuy cesc on trendline breakout above 644,
it is making cup and handle as well can see on zoom

Shocking Bitcoin TA comparison to 2015 Bear marketNamaste guys , I am publishing something unique and shocking ta based on 2015 bear market.
Explanation need bit time to understand comparison.
1) Bitcoin in Descending triangle time in 2015 was around 116D and in 2018 315D i.e around 2.8 times more
2) bitcoin in 1st slower accumulation in 2015 was around 61 D and in 2019 175 D i.e around 2.9 times more
3) Bitcoin then pumped more in both bear market and then formed small descending triangle under big triangle you can zoom in chart to see it.
4) Bitcoin near second descending triangle in 2015 was around 71 Days and in 2021 is around 210 days i.e around 2.9 times
5) today bitcoin is near 200 moving average same as 2015 .
It's about timing and pattern we might be near 1st box or may be near second.
I believe that we are near second box and we can still expect 35 to 40% drop.
What's your thoughts plz comment below B


Bandhan BankTrade with Caution.
If nifty and nifty bank rallies further, Bandhan Bank is going to zoom to 360 levels.
Educational Idea only


Nifty 50 - Where is it going? Elliott Waves AnalysisHey, whassup reader?
I bring you an analysis of Nifty 50 using Eliott waves and found the price to be respecting the waves theory from 1996 till today.
Here's my approach, observations, and some prediction mentioned below for you. Like and comment on what do you think about it.
You can zoom out in the chart to see the wave pattern formation across time.
Approach -
1. Decide a timeframe for validating if the index is respecting Eliott waves theory - Used weekly Timeframe for this
2. Decide a time frame to predict where the price move will happen in the near future based on the behavior of recent corrective wave caused by corona - Used daily time frame for this
Observations -
1. The index respects Eliott wave very well as demonstrated by the Fibonacci levels of the motive and corrective wave. (I cannot put multiple Fibonacci on one chart on top of another so that's one exercise which you can do yourself)
2. The coronavirus marked the end of the second motive wave which pushed nifty prices up from the bottom of the housing bubble in 2008.
3. The correction wave by corona (wave A) was impulsive in nature making prices fall to a bottom of 7.6K
4. Wave A saw retracement by Wave B (50% Fibonacci level of Wave A - is at 9854) taking prices high to the current level which is 9580.
The story gets interesting now.
Is wave B going to get over at 9800 level and Nifty 50 will fall from there again??
How far up the prices can go by wave B of NIFTY 50 before it will get weak again and will be taken over by wave C?
Wave C can make the price fall again till what level? Can nifty go below 7500?
Predictions -
Note: This is completely based on my analysis and understanding of Elliott waves. I will not advise you to trade according to my analysis results.
a. Wave B is not over yet. The price will increase to a minimum of 9854.1 (50% Fibonacci retracement of Wave A by wave B) or a maximum of 10407 (38% fibonacci retracement of wave A by wave B).
b. Given the impulsive correction of wave 5 by the corona induced wave A, a zig zag or complex recovery is expected.
c. Another fall will follow the high of wave B, which will bring the prices below the previous low of 7.5K
d. The fall can be as low as 6041 (1.6 Fibonacci level) of Wave A caused by corona.
My trade setup -
Right now, I will go long till 9854 level/10407 level. If 9854 level is crossed and stock moves high towards 10407 level then I will put a stop loss at 9854 level. At 10407, I will exit the trade and wait for other SR levels to decide my next position.
Thanks for reading it till here. Hope you liked the analysis.
Do let me know what do you think about Nifty 50 prices in the coming months in the comments below.
1 like = 1000 Encouragements. Please like and follow me for more such ideas
Ankit

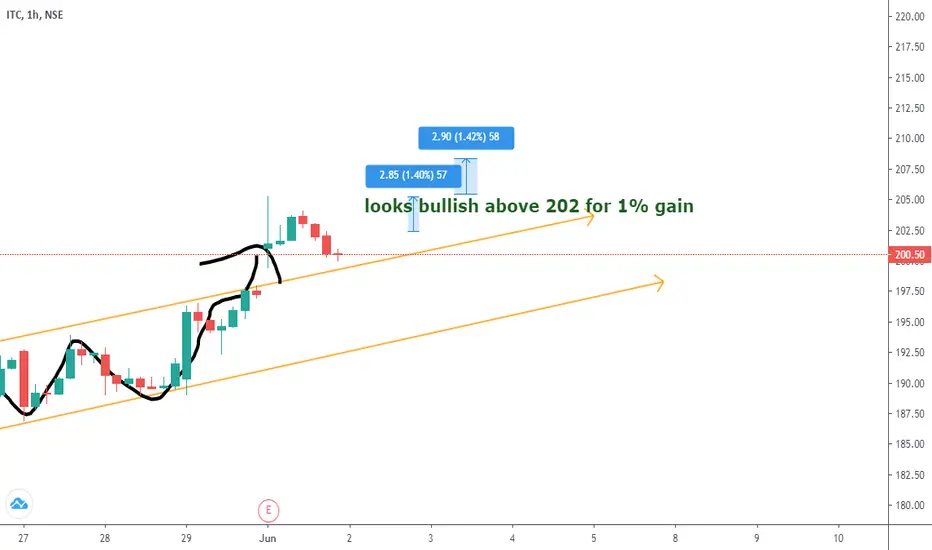
ITC LONG SIGN!!!today ITC did a breakout but couldnt sustain .. so it should be promising above 202 for 1% gain!!
YESTERDAY I POSTED BAJAJ FIN CHART AND YES IT ZOOM TO MY LEVEL AND WENT UPTO 10%.
THOSE WHO WANTS DAILY LIVE UPDATES ON CHARTS CAN TEXT ME !!!
PLEASE DO LIKE !!
ENDURANCE GAIN 40POINTS AFTER THE PERFECT ENTRY!!Endurance given long @11:47 to my students in the range of 690 -69 5. and pasted the reason why this level i took and the entry point as well. at 11:50 am i sent this chart for the reference to my students.
correctly just within 30 min it zoom to unexpected 725+.
Study simple price action techniques and use some procedures before entering into the trade, as trading is just 20 % and 80 %mentality .
kindly text me for learning !! NO shortcut no indicators just pure simple techinques.
please do like and support !!

BTCUSD multi time frame analysis. possible uptrend in 1hr chart.BTCUSD as formed double top and triangle pattern on daily chart and small triangle in 1hr chart. It as broken triangle pattern in 1hr chart and expecting upmove for short term. Please zoom if you if the 1hr triangle is invisible .

Grab the opportunity in HDFC !!!We all know the potential of HDFC and it's growth. Because of the current bearish sentiment of the market stock is trading at a very low price and we could start accumulating some amount of stocks for swing and long term traders.
This analysis especially for Swing and Long term traders only. (Short for intraday only if gap down opening)
From the weekly chart frame the stock was in a clear uptrend and was moving in the uptrend channel.
When we switch to the Daily frame, we can observe the stock is taking support on 2017's Support and Resistance level as well as 24th march 2020s as well.
But when we zoom in the Hourly time frame we can observe the downtrend of the market and now it is trading at the bottom of the Support.
Also on the last two candles formation of upper wick show some positive possibility if there is not a gap down opening.
Pro Tip (For Swing and Long term traders) - I suggest you start accumulating some quantities and if it goes down again buy again because when the market will recover you will never see HDFC trading at this level.

Is Bharti Airtel measuring our patience? / daily chart analysisHello friends , Thank you all for prioritizing my idea. hit the like button and also follow for new update.
let's talk about chart.. we have to conditions after break or while retreat from resistance.
here we can see some Area where No trading activity founded it Is outlined as "Area Zero " and trend-line is breaking every previous Resistance.it has just broken this resistance and made a new one at 606.20
we can find magnet line where the price often touches. we have funded 3 magnet lines M1 , M2 and M3 . every line can be our target.
here if price will break resistance at 606.20 then we can buy because it will be bullish or it will play move in trend channel like this and again touch at magnet Line. price have shown rejection by tail at 361.80 .
....................................................................................................................................................................................
(0) well we should wait for breakout or when failed to make new Resistance. lets zoom in this point
if it will fail to make new Resistance we can see this :
because of some fundamentals , position is buy but we are not running on base of news so we will wait for signal to take position.patience will give us profit.
"news base trading Have high Risks" but we can afford only 1:3 (Risk:Reward)
....................................................................................................................................................................................
it's better to wait for Signal and perfect entry...
Thank you for you ... :)
.

Bounce BackPotential bounce back can occur in Axis Bank. (zoom out and watch precious bounces)
Nifty is going to open a huge gap down. (Be careful)
Want to see my other trades?
-Click on the related idea below.

Weakness and existence of the seller verified? MOTHERSUMI
Aggressive buy seem 90.60
Below to 86, first target 76.4 nearby and 74.55
2nd target 69.8 nearby
I am not familiar with volume and price action analysis but this is my try.
Zoom out:
Please, forgive me if i have mistaking, cause this is my first chart on stocks analysis.

W5T Roller Coaster, Elliot Wave, and BITS indicator 40 tick moveWatch this video how our Roller Coaster indicator picked this nice 40ish tick move on ES on a 1 minute chart. Currently in a wave 4 pullback using our Elliot Wave indicator. Our BITS software picked up the move about 4-5 ticks early and was extra confirmation of taking the trade. What system, process, or indicator are you using to find 40 tick moves on a low volume trading day like today??? Message me if you would like a Zoom meeting to demo this indicator.
