Bitcoin bybit chart analysis November 10Bitcoin bybit chart analysis November 10
Hello
It's a Bitcoinguide.
If you have a "follower"
You can receive comment notifications on real-time travel routes and major sections.
If my analysis is helpful,
Please would like one booster button at the bottom.
Bitcoin 30-minute chart.
It is a two-way neutral strategy.
There is no Nasdaq indicator announcement today,
It was organized in a moderately sideways manner.
*Sky blue finger movement path
Long->Short->Long switching strategy
1. Long position entry area of $36560 / Stop loss when breaking out of the green support line
2. Switching short position at $37,147 / Stop loss when breaking the red resistance line
3. Long position switching at $36073.5 / Stop loss when the green support line breaks away
There has been no 5-minute trend reversal yet.
Check whether the 5-minute bar is touching the resistance line
After touching, the upward trend must continue.
If it falls, a downward wave progresses.
If the green support line is maintained without breaking away,
While Bitcoin is trending sideways,
Altcoin circulation pumping may continue.
My analysis up to this point is simply for reference and use only.
6 principles of trading / Stop loss is essential and safe
I hope you run it.
Thank you for your hard work this week.
Have a nice weekend.
thank you
Search in ideas for "bitcoin"

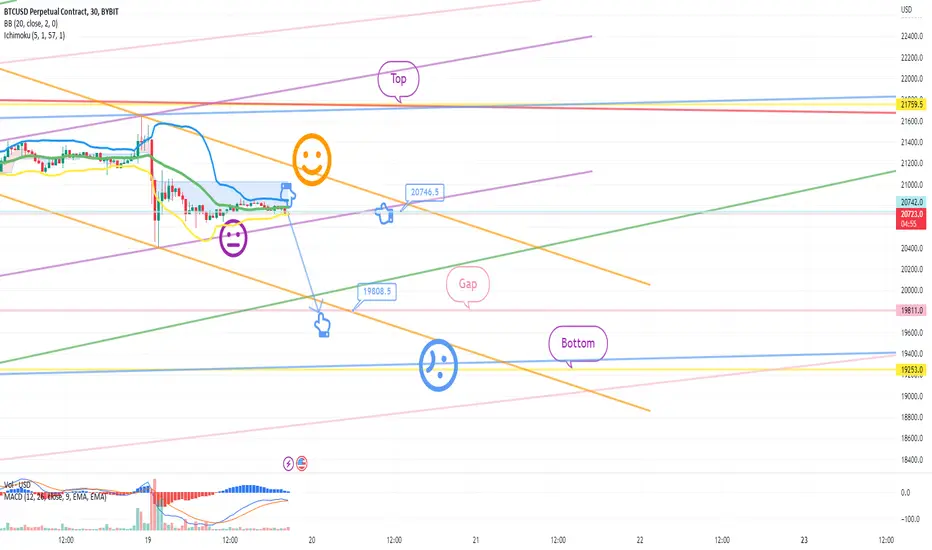
Bitcoin bybit chart analysis January 19
Hello
It's a Bitcoinguide.
If you have a "follower"
You can receive comment notifications on real-time travel routes and major sections.
If my analysis is helpful,
I would like one booster button at the bottom, please.
Bitcoin 30 minute chart.
It is a one-way short position strategy.
To be precise, it is a short -> long switching strategy.
Light blue finger movement path
1. $20729.5 short position entry section / stop loss when orange resistance line completely breaks through
2. Long position switching at 19808.5 USD / stop loss when breaking the light blue support line
The long position target is $20746.5.
My analysis is for reference only, please.
I hope you operate safely with principle trading / stop loss essential
thank you.
Bitcoin Dominance at critical levelBitcoin dominance is at major support. If dominance break below the support zone we will see a good rally in altcoins. The DeFi hype may break the support zone and bring a good altseason. Many altcoins did 3-5x from their all-time low price. The alt rally will attract new investors and that will increase the price of bitcoin also.
The dominance will bounce back from the support zone. Don't forget to book profits

Bitcoin Bybit chart analysis May 14Hello
It's a Bitcoinguide.
If you have a "follower"
You can receive comment notifications on real-time travel routes and major sections.
If my analysis is helpful,
Please would like one booster button at the bottom.
This is the Nasdaq 30-minute chart.
There is no separate indicator announcement today.
I conducted a brief analysis with rough movements.
The 3-hour chart MACD dead cross pressure is in progress,
and from the purple finger at the top to number 1,
it is the best short position entry section of the day,
and from the orange resistance line breakthrough, it is an upward trend.
*The 21.1K red finger at the bottom is a long-term strategy,
and if there is a rebound within the purple support line without touching the entry point,
it will rise vertically.
The short-term pattern may be broken from the 2nd section,
and it is a downward sideways movement to the bottom -> the 3rd section is the 1+4 section.
I applied it to Bitcoin as is.
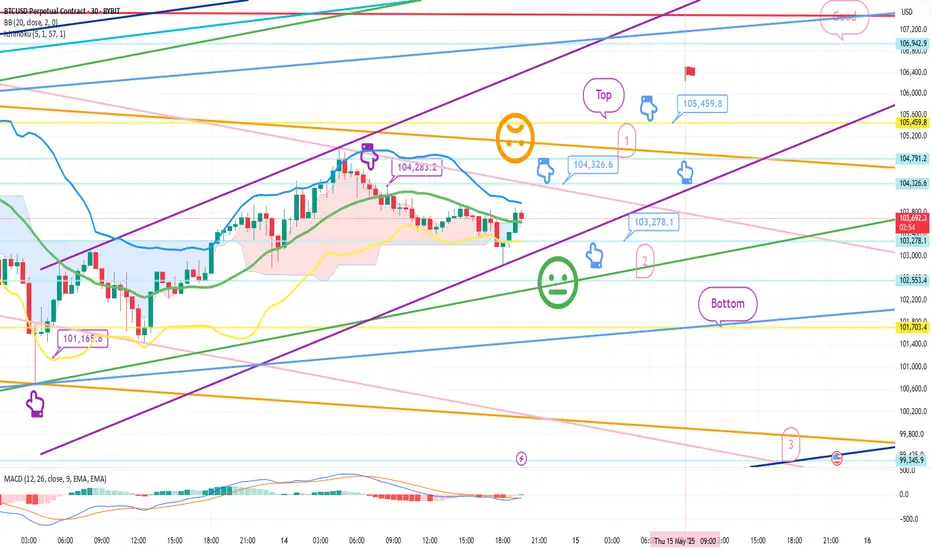
This is a 30-minute chart for Bitcoin.
Since there is no Nasdaq indicator announcement, we proceeded with trend following.
In the case of Bitcoin, the 12-hour chart MACD dead cross was engraved,
and the lower Bollinger band was touched first.
On the left, with the purple finger,
101.1K long -> 104.283.2 dollar short switching
I connected the strategy as it is.
*When the blue finger moves,
It is a two-way neutral
short->long switching strategy.
1. 104.326.6 dollar short position entry section / stop loss price when orange resistance line is broken
2. 103,278.1 dollar long position switching / stop loss price when green support line is broken
If the strategy is successful,
section 1 can be used as a long position re-entry section. (Purple parallel line maintenance condition)
I proceeded tightly up and down for fear of missing the entry point.
Instead, if I explain in detail,
The movement within 1 at the top and 2 at the bottom is a sideways section,
and it is a section where a trend can emerge when breaking out or breaking out.
For those who have been holding a short position since yesterday,
I think it would be good to operate with a stop loss price when breaking out of the orange resistance line, just like today's strategy.
If it comes down right away without touching the 104.3K short entry point,
the final long position is waiting in the 2nd section.
The stop loss price is the same.
If it breaks out of the bottom section today, it can be directly connected to the 3rd section at the bottom,
so those who are operating a long position should be careful.
Up to this point, I ask that you simply refer to and use my analysis,
and operate safely with principle trading and stop loss price. Please support the 4 consecutive perfect challenges
Thank you
Bitcoin Bybit chart analysis April 25 Hello
It's a Bitcoinguide.
If you have a "follower"
You can receive comment notifications on real-time travel routes and major sections.
If my analysis is helpful,
Please would like one booster button at the bottom.
This is the Nasdaq 30-minute chart.
There is no separate indicator announcement.
I bet on a red finger upward sideways movement or a strong rebound.
If the green support line is maintained,
the short-term pattern will be maintained and it is a safe zone, so it seems that there will be no big effect on Bitcoin.
The short-term pattern is broken from the bottom 2,
and the bottom section is the 1+4 section, so if it succeeds in rebounding without breaking away from the true blue support line,
it is good for a long position.
I just applied it to Bitcoin.
This is a Bitcoin 30-minute chart.
The purple finger section on the lower left is the section where the long position was entered in the analysis article on the 23rd.
*When the red finger moves,
it is a one-way long position strategy.
1. $93,046 long position entry section / stop loss price when the green support line is broken
2. $95,562.5 long position 1st target -> Top 2nd -> Good 3rd section,
and when the Good section is broken, the possibility of a new high is high.
The 1st section at the top is the rising wave confirmation section
The green support line 2nd section that I marked is the safe section.
The final match was held in the 1+4 section
If the strategy is successful, the 1st section on the right is the long position re-entry and utilization section
I left a simulation with the pink finger.
From the bottom breakout, until the additional weekly candle is created next Monday,
I have sequentially displayed the main prices and support lines,
so please refer to them,
and please use my analysis articles only for reference and use,
and I hope you operate safely with the principle trading and stop loss price.
Thank you for your hard work this week.
Thank you.

Bitcoin Bybit chart analysis April 14 Hello
It's a Bitcoinguide.
If you have a "follower"
You can receive comment notifications on real-time travel routes and major sections.
If my analysis is helpful,
Please would like one booster button at the bottom.
Here is the Bitcoin 30-minute chart.
There is no Nasdaq indicator announcement today.
I created a strategy based on the possibility of a strong decline in Tether dominance centered on the Gap section at the bottom of Nasdaq and Bitcoin.
*One-way long position strategy when the red finger moves
1. 83,690.8 dollars long position entry section / cut-off price when the green support line is broken
2. 85,772.3 dollars long position 1st target -> Top 2nd -> Good 3rd target.
If the strategy is successful, I have indicated the long position re-entry section.
Today, it is best to maintain the purple support line
because it maintains the mid-term pattern and the daily candle bottom section.
The mid-term pattern can be broken from the 1st section,
and it can be a sideways market until the 2nd section,
and it can decline step by step from the bottom -> 3rd section.
Up to this point, I ask that you simply use my analysis for reference and use only.
I hope that you operate safely with the principle of trading and cut-off price.
Thank you.

Bitcoin Bybit chart analysis April 4 Hello
It's a Bitcoinguide.
If you have a "follower"
You can receive comment notifications on real-time travel routes and major sections.
If my analysis is helpful,
Please would like one booster button at the bottom.
Here is the Nasdaq 30-minute chart.
There are indicators released at 9:30 and 12:00.
First of all, Nasdaq reached a very important point on the chart
yesterday morning.
In a situation where there is no particular movement due to Trump's tariff policy,
it continues to flow downward.
As far as I remember, the US is a country with a lot of showmanship.
I've experienced it a lot while analyzing charts.
There are two indicators released today,
The Bollinger Band monthly central line touches on the chart + two indicators released,
so there is a very high possibility that Nasdaq will go up.
In the end, it's an action and a play on words to pick up and put down the ants,
and it won't be operated to the point where the US is destroyed.
Since there is a stop loss, we proceeded very aggressively.
As you can see, in the indicator announcement time zone,
the blue finger is short->long
or the red finger is long.
The rebound from the bottom is a condition for a sweep when looking at the chart upside down, so if successful, a surge can occur.
I just applied it to Bitcoin.
This is a 30-minute Bitcoin chart.
I marked the daily closing section for each flag,
and the purple flag on the far right is next Monday.
The purple finger on the lower left
is connected to the 81,404.4 dollar entry point yesterday, April 3.
Because it is touching the center line of the Bollinger Band 12-hour chart,
you need to hold on until 9 o'clock when additional candles are created to go up more.
*One-way long position strategy when the red finger moves
1. 83,568 dollar long position entry point / stop loss price when the green support line is broken
2. 86,871.5 dollar long position 1st target -> Top 2nd target
After that, target price in order.
If the strategy is successful, the 1st section that returns
You can use the long position re-entry section
The movement within the 1st section at the top and the 2nd section at the bottom is a sideways market.
If there is a crash in Nasdaq
It can drop below the bottom
And it can drop to 79.7K 3 times over the weekend, so please take note.
Up to this point, my analysis
Please just refer to and use it
I hope you operate safely with principle trading and stop loss prices.
You worked hard this week too.
Thank you.

Bitcoin Bybit chart analysis March 24Hello
It's a Bitcoinguide.
If you have a "follower"
You can receive comment notifications on real-time travel routes and major sections.
If my analysis is helpful,
Please would like one booster button at the bottom.
This is the Nasdaq 30-minute chart.
There is an indicator announcement at 10:35,
The Bollinger Band 12-hour chart is touching the resistance line,
But it has not reached the center line of the daily chart.
A gap section is created at the bottom.
The blue finger is a short->long switching strategy,
And I just applied it to Bitcoin.
Bitcoin 30-minute chart.
*Red finger movement path
Long position strategy
1. $86,837.7 long position entry section / stop loss price when purple support line is broken
2. $90,418 long position 1st target -> Good 2nd target
The 1st section at the top
is the rising wave section for today's strategy to succeed
(Section for utilizing autonomous short section)
From the 1st section touch
The probability of the strategy succeeding increases.
Refer to Nasdaq movement.
The 2nd section at the bottom seems to be around 1+4 sections
The mid-term pattern is broken from the bottom touch.
After that, the possibility of the bottom gap reversal increases, so please note
Today, since it's been a while, I'll leave it as public
and go in.
Up to this point, I ask that you use my analysis as a reference only
I hope that you operate safely with principle trading and stop loss prices.
Thank you.

Bitcoin Bybit chart analysis March 10Hello
It's a Bitcoinguide.
If you have a "follower"
You can receive comment notifications on real-time travel routes and major sections.
If my analysis is helpful,
Please would like one booster button at the bottom.
This is the Bitcoin 30-minute chart.
There is no Nasdaq indicator announcement today.
The trend has been brought forward by one hour due to the application of US Daylight Savings Time.
If only the Nasdaq low is not broken and
It moves sideways, there will be no crash in Bitcoin.
I created today's strategy based on the Gap9 section retracement at the top.
*When the blue finger moves,
It is a two-way neutral strategy.
1. 81826.5 dollars long position entry section / stop loss price when the blue support line is broken
2. 86234 dollars long position target price
After that, from section 1 -> 87428.5 dollars -> Great
As indicated, it would be good to use short->long switching.
Up to this section, it seems more advantageous to liquidate long and then re-enter long than short. (Tether Dominance 4+6+12 MACD Dead Cross Possibility)
The center line of the Bollinger Band daily chart
is the final short position switching point.
(Approximately $90,418)
If the Bottom section is broken today according to the movement of Nasdaq,
Bit will also break the previous low point
and it may fall strongly to 3 -> Gap7.
For those who can check the drawing section,
I have marked today's major rebound section near Gap7, so please refer to it.
Up to this point, please use my analysis as a reference only
Please operate safely with principle trading and stop loss price.
Thank you.

Bitcoin Bybit chart analysis january 13Hello
It's a Bitcoinguide.
If you have a "follower"
You can receive comment notifications on real-time travel routes and major sections.
If my analysis is helpful,
Please would like one booster button at the bottom.
This is the Nasdaq 30-minute chart.
There is no separate indicator announcement today.
According to the daily support + weekly central line rising pattern,
I bet on entering or switching a long position at the bottom of 20.4K.
There is a possibility of extreme sideways movement without touching the entry point,
so you must check whether it touches the weekly chart central line near 20.4K.
I just applied it to Bitcoin.
This is the Bitcoin 30-minute chart.
After the 94.5K Gap reversal in the morning,
4+6 MACD dead cross is in progress,
unlike Nasdaq, it is in a strong vertical decline.
In the current situation,
except for the weekly chart MACD dead cross,
there are no special danger signals,
and
Bollinger Band 6-hour chart resistance line->6-hour chart support line is being touched.
*When the blue finger moves,
it is a two-way neutral
short->long switching strategy.
1. 92764.5 dollars short position entry point / cut-off price when orange resistance line is broken
2. 91217 dollars long position switching / cut-off price when purple support line is broken
3. 93.4K long position 1st target -> Top 2nd target and then target price in order
While writing the analysis, the long position switching point
91.2K was touched in real time, so please refer to it.
To explain briefly, depending on the movement of Nasdaq,
it will probably be either the sky blue finger 91.2K long or the bottom 1 89.K long.
Today, it is in a downward trend as it touches the final 6-hour chart support line.
The bottom 1 section is the 12-hour, daily chart support line touch point.
From this section touch, the downside is open,
and a strong downward trend can continue,
so you should be careful in the long position position.
A similar situation is unfolding to the analysis article I left last week on the 9th.
In the case of touching 91.2K first without touching the sky blue finger 92.7K short entry point at the top,
rather than entering a long position right away,
you should use whether you touch the short position entry point at the top or the 5-minute trend reversal.
Today, the purple support line is also the last mid-term uptrend line.
Since it is also in an upward trend in Tether Dominance,
it needs a justification to fall.
In the current trend situation, you need to see if it is swept right away.
(In the case of Bit, which moves in the opposite direction, it skyrockets without adjustment)
The point is that the 1st section at the bottom is
*If a rebound is successful in the daily support + weekly center line pattern position on Nasdaq today,
it is possible that a rebound will occur at the 1st section at the bottom.
In the case of Bit, since it continues to fall vertically without touching the resistance line,
the 4-hour and 6-hour chart MACD dead cross is perfectly imprinted,
and the movement after 9 o'clock when additional candles are created is important.
Please refer to it in real time and operate well.
Up to this point, I ask that you simply refer to and use my analysis,
and I hope that you operate safely with principle trading and stop loss prices.
Thank you.

Bitcoin Bybit chart analysis December 3Hello
It's a Bitcoinguide.
If you have a "follower"
You can receive comment notifications on real-time travel routes and major sections.
If my analysis is helpful,
Please would like one booster button at the bottom.
This is the Bitcoin 30-minute chart.
The Nasdaq index will be released at 12 o'clock in a little while.
The current position is a place where anyone can see that there will be an adjustment at the bottom.
I really thought a lot about the sideways position.
I just need to quietly collect altcoins,
but I don't know what I'm doing.
If I don't do perfect tomorrow, I'll go into hiding, so please understand...
*When the blue finger moves,
it is a two-way neutral
short->long ->short ->long switching strategy.
1. 96,314 dollars short position entry section / Stop loss price when orange resistance line is broken or Stop loss price when Top section is touched
2. 94,690.5 dollars long position switching / Stop loss price when green support line is broken or Bottom section is touched
3. 97,171 dollars long position target price / 96,314 dollars long position returning to the bottom
Re-entry and Stop loss price autonomous section -> Good section final long position target price
What is the success rate up to this point, everyone?
The 1st section of the pink resistance line indicated above is a vertical downward section before and after the touch,
and if the breakout fails, it can be connected directly from Bottom at the bottom.
The Bottom position at the bottom is a place where the mid-term pattern can be broken by touching the center line of the daily chart alone. You will see a gray support line nearby, but even if you touch the bottom,
If you maintain the blue support line,
Bitcoin and altcoin will continue to be safe.
If the rebound fails at the bottom, the blue support line at the bottom
92,622 dollars will be the last support line.
Currently, Ripple and altcoins are in a state of fire regardless of Bitcoin.
If the blue support line is maintained without breaking away today,
You can operate altcoins comfortably,
And you can also use the long position entry timing at the same time.
I did not operate the long position entry position at the current position,
But if the 5-minute trend change is successful,
After the alt pumping,
I guess a re-entry position will come out?
If the altcoin bullish train maintains the blue support line at the bottom,
Circular pumping will continue.
Up to this point, my analysis is so poor
and the winning rate is low
so please just use it as a reference and for reference only
I hope you operate safely with the principle of trading and stop loss price.
Thank you.

Bitcoin Bybit chart analysis November 21Hello
It's a Bitcoinguide.
If you have a "follower"
You can receive comment notifications on real-time travel routes and major sections.
If my analysis is helpful,
Please would like one booster button at the bottom.
Here is the Bitcoin 30-minute chart.
Shortly later at 10:30 and 12:00, the Nasdaq indicators will be released.
The Tether Dominance chart has been ruined due to the steep rise of Bitcoin.
There is no proper resistance line other than the orange resistance line at the current location,
and it is not easy to draw a support line or see how far it will rise.
*In the current location,
there are two movements that need to occur for Bitcoin to adjust.
After breaking through the all-time high, a double top or sweep
Slowly falling from the current location
On the contrary, Bitcoin absorption method that does not give an entry point and rises may occur.
It is difficult even though it is on the rise, right?
The strategy was carried out with the purple finger at the bottom left
20-day long position entry section 93,353 dollars long position maintenance condition
.
*When the red finger moves,
it is a one-way long position strategy.
1. 97217 long position entry section / stop loss price when the sky blue support line is broken
2. Top section 1st target -> Good, Great next target price.
The entry position seems to change before and after the touch of the purple finger 1st section indicated at the top.
You can see that 1->2 is connected,
and if there is no touch 1,
it normally becomes the long position waiting section from 97.2K.
First, it would be convenient to watch if it touches section 1.
The long position entry position can be pushed up to section 3,
but since the upward trend is strong,
the rebound can continue even if only the sky blue support line in section 3 is maintained.
If the strategy is successful while touching the top,
the returning section 1 becomes the long position re-entry operating section.
Up to this point, I ask that you simply use my analysis for reference and use only. I hope that you will operate safely with the principle of trading and stop loss. Thank you.

Bitcoin Bybit chart analysis August 6Hello
It's a Bitcoinguide.
If you have a "follower"
You can receive comment notifications on real-time travel routes and major sections.
If my analysis is helpful,
Please would like one booster button at the bottom.
Here is the Bitcoin 30-minute chart.
There is no Nasdaq index release today
It is in an uptrend
And I made a strategy for the part where the wave is getting bigger.
I was worried a lot about missing the entry point
Since the short-term pattern was broken in Tether Dominance
I applied the downtrend to Bitcoin.
*When the blue finger moves
It is a two-way neutral
Long -> Short switching strategy.
1. 53,310 dollars long position entry point / cut-off price when the green support line is broken
2. 58,122.5 dollars long position 1st target -> Top 2nd target
3. Short position switching at Top 59,164.5 dollars / cut-off price when the pink resistance line is broken
Since it is a strategy aimed at perfection
I lowered the long position take-profit price a little
And when the top target price is reached perfectly, I switch to a short position.
At the top, 1 and 2 are horizontal lines
If it doesn't come down to the entry point and rebounds in the 2nd section
Please pay attention to the purple parallel line.
The 3rd section is a downward horizontal line
If the previous low point bottom section doesn't break
You can continue to play in the current channel.
From the bottom
Please note that there is a high possibility of additional decline after tomorrow.
Up to this point, please use my analysis for reference only
I hope you operate safely with the 6 types of one-shot trading and stop loss prices.
Thank you.

Bitcoin Bybit chart analysis August 5Hello
It's a Bitcoinguide.
If you have a "follower"
You can receive comment notifications on real-time travel routes and major sections.
If my analysis is helpful,
Please would like one booster button at the bottom.
This is a 30-minute Bitcoin chart.
The analysis took a long time because it is a place to test whether the current position is a meaningful section or not.
Because the difficulty level increases a lot,
Beginners must be careful.
Continue to pay attention to the Nasdaq variable,
and when Nasdaq falls, it couples with Bitcoin.
In the case of Tether Dominance,
it touched the center line of the Bollinger Band monthly chart.
In fact, other than looking at the entry timing or pattern,
it is greatly affected by the Nasdaq movement,
so it is not very important.
There is no place to eat Bitcoin as a short,
but
there is no reason to raise it strongly today,
and I am watching Nasdaq.
I created a strategy based on the sideways market.
*When the blue finger moves,
it is a two-way neutral strategy.
It is a short->long or long waiting strategy.
1. $52,756 short position entry section / stop loss price when pink resistance line is broken
2. $49,293 long position switching / stop loss price when green support line is broken
3. $54,093 1st -> 1st section 2nd target -> short switching when top is reached
The final short position will probably be autonomous trading depending on the situation.
The movement of Tether dominance is important,
While touching the center line of the Bollinger band monthly chart,
It is important whether the adjustment will continue immediately or whether the sweep will be connected.
The pattern is alive and the uptrend is strong.
It may fall from the current position immediately,
or after shorting, the 2nd section at the bottom may become a double bottom section (Tether dominance sweep condition),
and if it rebounds in the 2nd section,
it may shoot strongly upward, so it is dangerous,
but it is a good position for profit and loss ratio.
Short->long or 2nd is the final long waiting strategy, and
when the 2nd section is reached,
it seems more advantageous to modify the long position stop loss price than to switch short.
Please note that today's bottom
may be pushed up to the 3rd section depending on the situation.
Up to this point, I ask that you simply use my analysis for reference and use only.
I hope that you operate safely with principle trading and stop loss price.
Thank you.

Bitcoin Bybit chart analysis May 27Hello
It's a Bitcoinguide.
If you have a "follower"
You can receive comment notifications on real-time travel routes and major sections.
If my analysis is helpful,
Please would like one booster button at the bottom.
This is the NASDAQ 30-minute chart.
There will be an indicator announcement at 11 o'clock.
The daily chart MACD dead cross is in progress.
*When the red finger moves,
it is a long position strategy.
I simply proceeded with the purple finger short -> red finger long switching
or the red finger long waiting strategy.
Today, if possible, it is advantageous for long positions because the weekly chart low point will not be broken even if you just move sideways without touching the gap section.
When the gap section is deviated, I marked the bottom -> section 2 at the bottom
and applied it to Bitcoin as it is.
This is a Bitcoin 30-minute chart.
At the bottom left is the gap retracement section that was performed on the 26th
The purple finger is the entry point for the long position at $108,233.5
It is connected as is.
*When the red finger moves,
It is a long position strategy.
1. After confirming the touch of the first section of the purple finger at the top
109,519.6 long position entry section / cut-off price when the green support line is broken
2. 111,883.3 long position 1st target -> Good 2nd target
Until the additional daily chart is created at 9 am tomorrow
Because the top section of the resistance line of the Bollinger Band daily chart can be a strong adjustment section
You should be careful.
If you touch after 9 o'clock, there is a possibility of additional increase, and
If the strategy is successful, you can use the 1st section indicated at the top as a long re-entry section after the first liquidation of the Top section.
Today, we will focus on long positions,
but it is important whether the main point touches the upper part of Nasdaq first and then
comes down immediately.
If it comes down immediately without touching the 1st section,
the final long waiting strategy is at 108,652.9 dollars in the 2nd section.
If the green support line breaks away, the stop loss price is the same.
Since the mid-term pattern is broken,
if you somehow manage to hold it within the 2nd section today, it is good for the long position.
If it breaks away, check the Bottom -> 3rd section at the bottom,
Since Bitcoin's new high is updated depending on the movement of Nasdaq this week,
it seems that a decline or continuous rise after the double top may be connected.
Up to this point, I ask that you simply use my analysis for reference and use only.
I hope that you operate safely with the principle of trading and cut-off price.
Thank you.

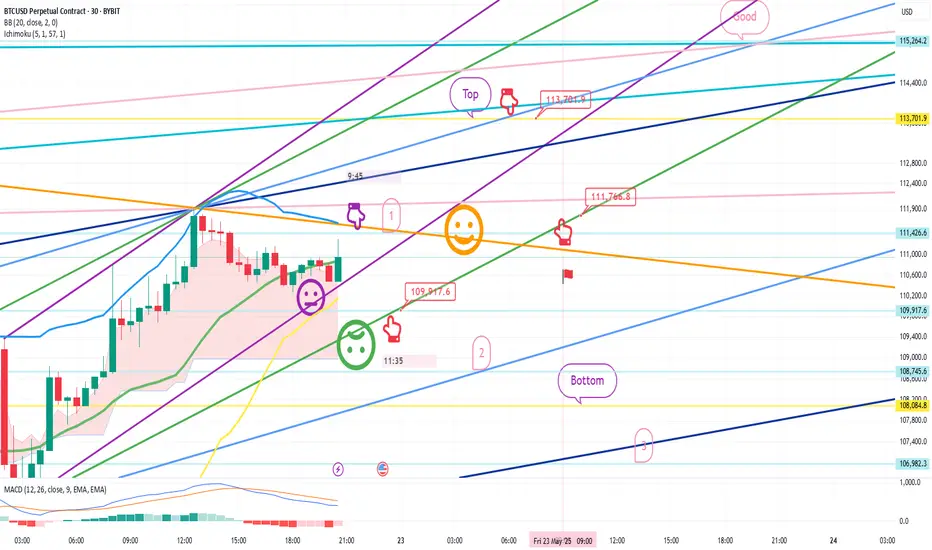
Bitcoin Bybit chart analysis May 23Hello
It's a Bitcoinguide.
If you have a "follower"
You can receive comment notifications on real-time travel routes and major sections.
If my analysis is helpful,
Please would like one booster button at the bottom.
Here is the Bitcoin 30-minute chart.
There will be a Nasdaq indicator announcement at 11 o'clock in a little while.
Yesterday was also a sideways market with no movement,
and the participation rate was low, so I will leave it as a brief analysis.
In the case of Nasdaq, today's daily chart MACD dead cross pressure
so I judged that a vertical rise would be difficult.
I made today's strategy based on the high possibility of a sideways move.
In the upper left corner, from the analysis article on the 22nd,
I moved the 1st section / 111,426.6 dollars as it is with a purple finger.
*Red finger movement path
One-way long position strategy
1. 109,917.6 dollars long position entry section / green support line breakout stop loss price
Since the 4-hour chart MACD dead cross pressure is in progress
Based on the 1+4 pattern,
At least 2 additional 4-hour candles are created
I think there will be a long position wait after 1:30 p.m.
2. Top section 113,701.9 dollars long position 1st target -> Good 2nd target
If it breaks through the orange resistance line at the top
It can be connected to a vertical rise,
So if you were short yesterday or are going to challenge today,
Use it as a stop loss price, but be careful.
If it goes up within the purple support line after 1->2 or after touching 2 times,
It can be a vertical rise or a strong rise.
At the bottom, Bottom -> 3 times -> 106982.3 dollars
I marked the support line.
In case of a strong rise over the weekend,
Good is the Great section hidden picture search.
Up to this point, I ask that you simply use my analysis for reference and use,
and I hope that you operate safely with principle trading and stop loss prices.
Thank you for your hard work this week.
Thank you.

Bitcoin Bybit chart analysis May 22Hello
It's a Bitcoinguide.
If you have a "follower"
You can receive comment notifications on real-time travel routes and major sections.
If my analysis is helpful,
Please would like one booster button at the bottom.
This is the Nasdaq 30-minute chart.
Where the mid-term pattern is restored
Blue finger short->long switching
Long waiting strategy up to section 1.
I marked the target price section at the top / the support line price at the bottom
I will try to apply it to Bitcoin as is.
Here is the Bitcoin 30-minute chart.
Nasdaq indicators will be announced at 9:30 and 11:00 shortly.
Nasdaq movement + short-term pattern is broken,
and the Tether Dominance short position operation method is applied to Bitcoin, which moves in the opposite direction.
* One-way long position strategy when the red finger moves
1. $109,917.6 long position entry section / When the green support line is broken,
or when section 2 is touched, stop loss price
2. $113,701.9 long position 1st target -> Good 2nd target price
Section 1 at the top is the last short position operation section of the day,
and when it breaks through, it can be connected to an upward trend,
so it seems advantageous for beginners to use it as a long waiting strategy in an upward wave.
If you touch the red finger long position entry section first among 1 or 109.9K,
You can go around and rise strongly.
If you succeed in rebounding without breaking the purple support line,
Vertical rise
Movement within the 1st section at the top and 2nd section at the bottom is sideways.
Because it is open from Bottom -> 3,
Be careful of Nasdaq fluctuations,
If you succeed today, you will have 4 consecutive perfects.
Please use my analysis articles for reference and use only
I hope you operate safely with principle trading and stop loss prices.
Thank you.
Bitcoin Bybit chart analysis May 21Hello
It's a Bitcoinguide.
If you have a "follower"
You can receive comment notifications on real-time travel routes and major sections.
If my analysis is helpful,
Please would like one booster button at the bottom.
This is the Nasdaq 30-minute chart.
There is no separate indicator announcement today.
After the red finger chase purchase,
I explained the main demand section drawing and price.
I applied it to Bitcoin as is.
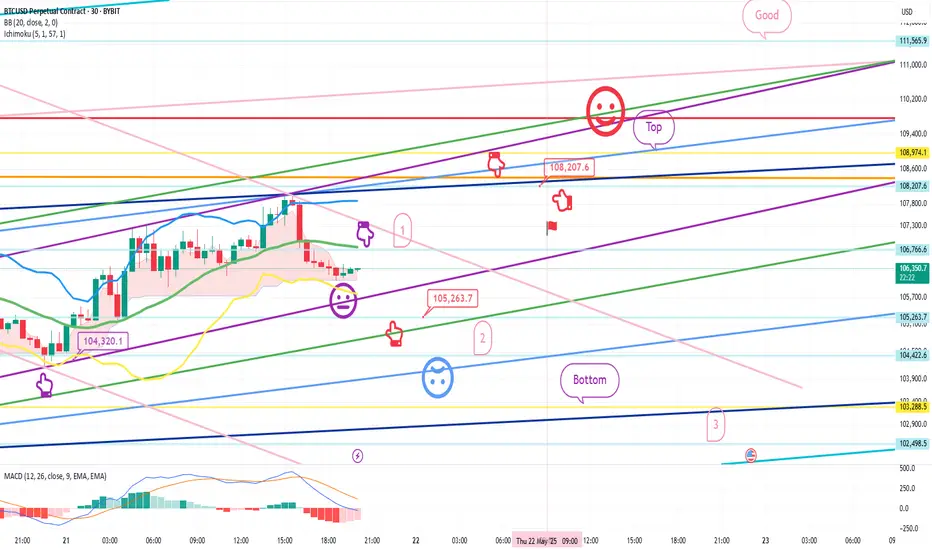
This is a Bitcoin 30-minute chart.
At the bottom left, the purple finger
connects the strategy to the long position entry section that was entered on the 20th.
*When the red finger moves,
it is a one-way long position strategy.
1. $105,263.7 long position entry section / stop loss price when the sky blue support line is broken
2. $108,207.6 long position 1st target -> Top 2nd target -> Good 3rd target price
The 1st section at the top is the rising wave confirmation section,
and the strategy is more likely to succeed if the purple support line is broken after the touch.
(If it goes up right away, there is a possibility of a vertical rise)
Red finger long hold
If it goes down right away without touching, it is the final long hold strategy at 2.
From the 2nd section deviation, I marked Bottom -> 3
Since the mid-term pattern was broken yesterday,
you should succeed in rebounding within the green support line if possible.
Up to this point, I ask that you simply use my analysis for reference and use,
and I hope that you operate safely with principle trading and stop loss prices.
Thank you.
Bitcoin Bybit chart analysis May 19Hello
It's a Bitcoinguide.
If you have a "follower"
You can receive comment notifications on real-time travel routes and major sections.
If my analysis is helpful,
Please would like one booster button at the bottom.
This is the Nasdaq 30-minute chart.
There is no separate indicator announcement today.
The 12-hour chart MACD dead cross is in progress.
The blue finger is short->long or if it goes down right away,
the purple finger is a long waiting strategy.
Since the morning, the blind decline has been in progress,
and the short-term pattern is broken.
The bottom section is about 6+12 sections,
and it is today's major support line.
I applied it to Bitcoin as it is.
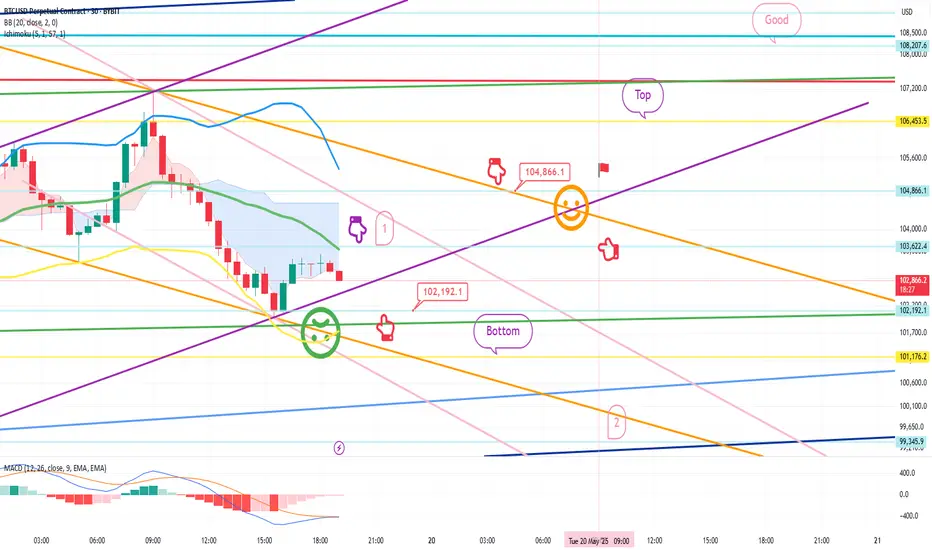
This is the Bitcoin 30-minute chart.
It is being adjusted strongly as it is coupled with Nasdaq.
Based on Tether dominance,
If the current low is broken,
It is a position where it can be pushed strongly.
* When the red finger moves,
It is a one-way long position strategy.
1. 102,192.1 USD long position entry section / stop loss price when the green support line is broken
2. 104,866.1 USD long position 1st target -> Top 2nd target
The 1st section of the purple finger at the top
Is the best short position entry section of the day.
If it does not touch, it will fall vertically,
So if it goes down right away without touching the 1st section
It can be pushed to the bottom -> 2.
The danger signal has passed, but the problem is when it couples with Nasdaq.
The 2nd section at the very bottom is the 12+ daily support section,
and will be today's major support line.
Last week, many people pressed the booster,
so I'm leaving it as a public post today as well.
Up to this point, I ask that you use my analysis for reference and use only,
and I hope that you operate safely with principle trading and loss cuts.
Thank you.
Bitcoin Bybit chart analysis May 16 BitcoinHello
It's a Bitcoinguide.
If you have a "follower"
You can receive comment notifications on real-time travel routes and major sections.
If my analysis is helpful,
Please would like one booster button at the bottom.
This is the Nasdaq 30-minute chart.
There is no separate indicator announcement.
We proceeded with trend following.
After entering the 1st long position at the top,
If it does not break away from the purple support line, it goes up vertically.
*We proceeded along the red finger movement path in the next wave.
We expected the movement to be a strong rise.
From the bottom breakaway, it is open up to the 2nd section,
and we will omit the detailed explanation.
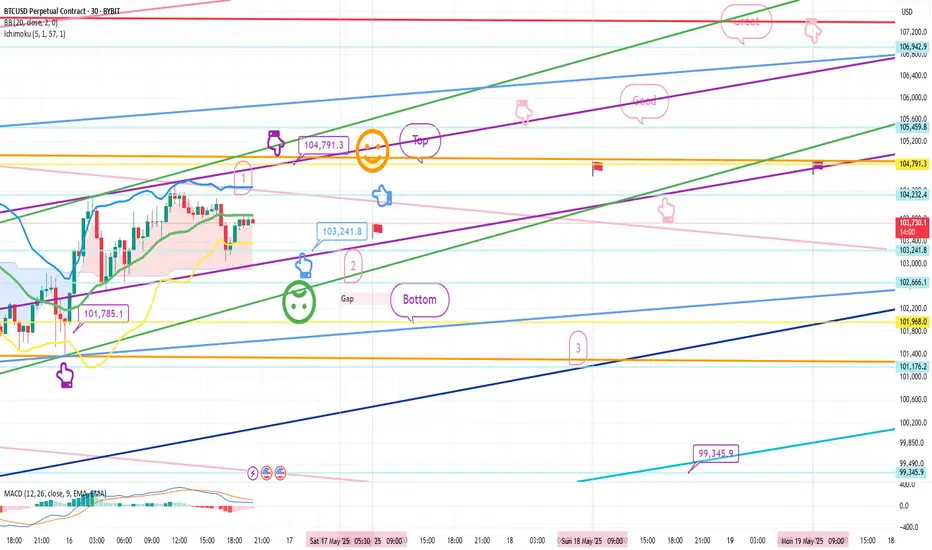
This is the Bitcoin 30-minute chart.
At the bottom left, with a purple finger,
I connected the long position entry section of 101,785.1 dollars that I had on the 15th.
The current position is the 30 + 1 section,
but since the 4 and 6-hour central lines were also touched at the same time,
the mid-term pattern is broken,
and the daily chart MACD dead cross is in progress.
The strategy is one-way, one-way,
I am explaining it only on one page of the 30-minute chart,
so it is limited, but I organized it as simply as possible.
*When the blue finger moves
Two-way neutral
Short->Long or long waiting strategy
1. 104,791.3 dollars short position entry section / stop loss price when orange resistance line is broken
2. 103,241.8 dollars long position switching / stop loss price when green support line is broken
After that, long position target price in the order of Good -> Great
-> Refer to pink finger simulation.
If it touches the top once or comes down right away from the current position,
it is the final long waiting strategy at the bottom section 2.
From the bottom section breakout,
it is open from 3 -> 99345.9 dollars.
Please use my analysis article so far only for reference and use
I hope you operate safely with principle trading and stop loss price.
Thank you for your hard work this week.
Bitcoin Bybit chart analysis May 9Hello
It's a Bitcoinguide.
If you have a "follower"
You can receive comment notifications on real-time travel routes and major sections.
If my analysis is helpful,
Please would like one booster button at the bottom.
This is the Nasdaq 30-minute chart.
There is no separate indicator announcement today.
With the green support line maintenance condition, I created a strategy for a sideways market with a red finger long position strategy.
The main sections are indicated by price, so
Please refer to it.
This is a Bitcoin 30-minute chart.
At the bottom left, with a purple finger,
I just connected the 99,222.6 dollar long position strategy from the 8th analysis article.
*When the red finger moves,
One-way long position strategy
1. 102,536 dollar long position entry section / cut-off price when the green support line breaks
2. Top section 105,417.6 dollar long position 1st target -> Target price in order from Good to Miracle.
From Miracle, the report is updated,
and the possibility of the report being updated has greatly increased due to yesterday's movement.
The 1st purple finger section at the top
If it doesn't break through, it's a sideways market, but if it breaks through, it can be directly connected to an upward trend,
so it seems safer to operate it as a long position waiting rather than taking a short. (Horizontal range until convergence section 1, 2)
From the green support line deviation of section 2 at the bottom
Because of the full candle on the left, it can be pushed hard,
So you must follow the stop loss price.
This week, it is open from Bottom-> 3rd -> 97086.1,
So please use it well in real time.
Up to this point, I ask that you simply refer to and use my analysis
And I hope that you operate safely with principle trading and stop loss price.
Thank you for your hard work this week.
Thank you.

Bitcoin Bybit chart analysis May 2 Hello
It's a Bitcoinguide.
If you have a "follower"
You can receive comment notifications on real-time travel routes and major sections.
If my analysis is helpful,
Please would like one booster button at the bottom.
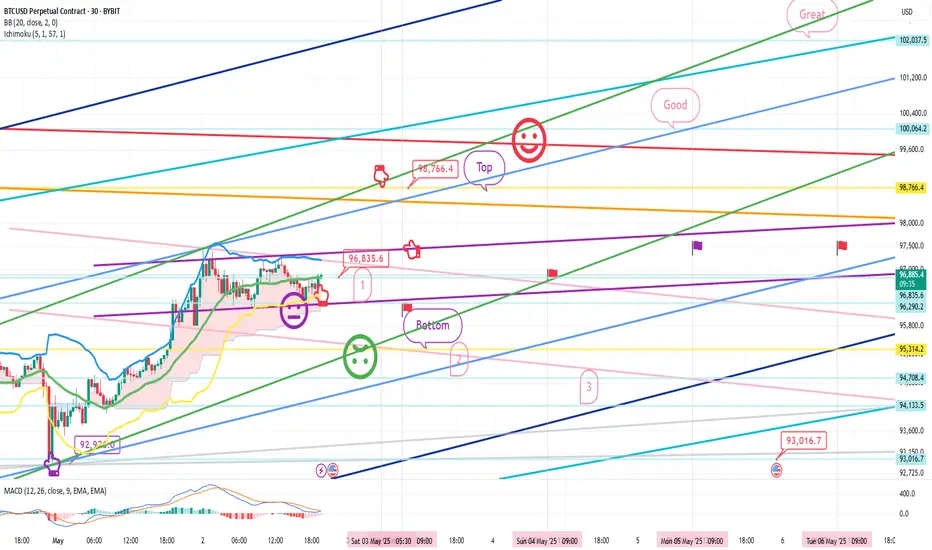
Here is the Bitcoin 30-minute chart.
There will be an indicator announcement at 9:30 in a little while.
Unlike Nasdaq, Bitcoin touched the upper Bollinger Band first and is on the verge of an upward trend.
Since there is a possibility of missing the entry point at the current position,
I set the stop loss price short and proceeded aggressively.
*One-way long position strategy when the red finger moves
1. Pursuit purchase at $96,835.6 / When the purple support line is broken,
or when the bottom section is touched, stop loss price
2. Long position target price at $98,766.4 -> Good 2nd target -> Great 3rd target
If the Great section is broken at the top,
the probability of a new high price is high.
From the bottom touch, the mid-term pattern will be broken
(currently 6+12 in progress)
When looking at the candle shape, from the green support line bottom breakout
It can break out strongly, so please refer to the bottom 2, 3 times up to 93016.7 dollars, and if 93K breaks, a downward trend can be connected again, so
You should be careful.
I left the analysis article up to May 6th
and the main points and the drawing section on one page, so it's hard
Please just refer to and use my analysis article up to here
I will see you next week after the holiday.
Thank you.
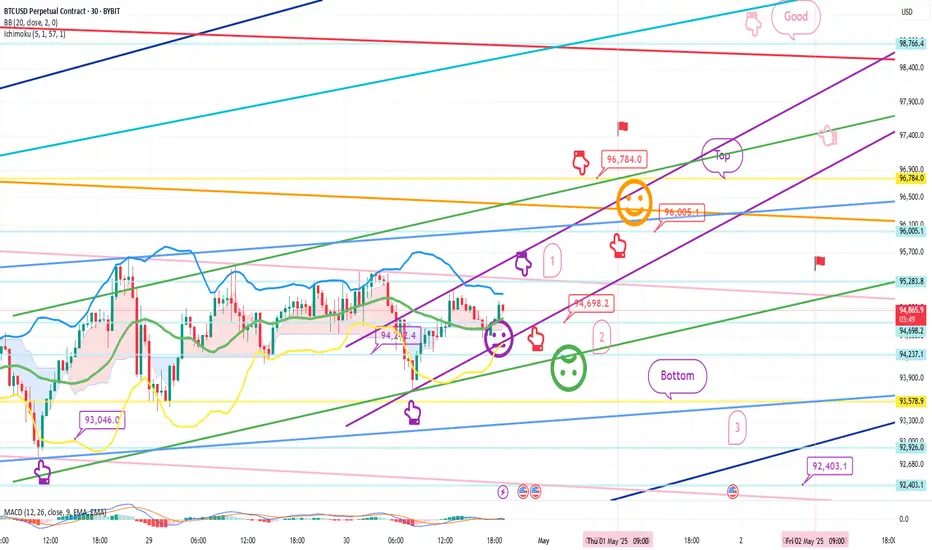
Bitcoin Bybit chart analysis April 30Hello
It's a Bitcoinguide.
If you have a "follower"
You can receive comment notifications on real-time travel routes and major sections.
If my analysis is helpful,
Please would like one booster button at the bottom.
Here is the Bitcoin 30-minute chart.
There will be two Nasdaq indicator announcements at 9:30 and 11:00.
On the lower left, I marked the long position entry section that I entered on the 25th and 29th,
and created today's strategy based on the Nasdaq movement.
*Red finger movement path
Long position strategy
1. 94,698.2 dollar long position entry section / cut-off price when the green support line is broken
2. 95,784 dollar long position 1st target -> Good 2nd target
The 1st and 2nd sections at the top are sideways.
After the 1st touch, in the rising wave, if you enter a 94.6K long position,
the probability of the strategy succeeding increases.
If it comes down right away without touching the 1st section,
The final long position is waiting in the 2nd section, and the stop loss price is the same when the green support line is broken.
When the top section is touched, the long position re-entry utilization section and
I left a simulation with a pink finger on the upper right.
The bottom touch is a downward sideways movement
The 3rd section is the 6+12 support line where the mid-term pattern is restored.
Also, tomorrow is Labor Day,
So all countries around the world, including the US, are closed.
I also have work to do, so I will take a day off tomorrow.
I intentionally left the analysis article on the right until May 2nd.
Up to this point, please just refer to and use my analysis article,
And I hope you operate safely with the principle trading and stop loss price.
Thank you.