Bitcoin Symmetrical Triangle Fake breakout#BitcoinUpdate | CRYPTOCAP:BTC Trading Insights
Current Formation: CRYPTOCAP:BTC is sculpting a Symmetrical Triangle, suggesting a pivotal movement ahead.
Recent Activity: Noticed a Fake Breakout with $BTC/USDT, reverting to trade within the Symmetrical Triangle.
Bearish Alert: Caution if #BTC plunges below $65k. This level is a critical juncture for future trends.
Strong Support: Steadfast at $65,000. Bulls dominate above this threshold.
Trading Strategy: Hold your trades until a clear Symmetrical Triangle Breakout. Patience is key.
Bullish Outlook: An upward breakout could signify a monumental bull run for Bitcoin.
Engage & Share: RT/Like if you find this setup aligned with your market expectations. Let’s ride the wave together!
Search in ideas for "bitcoin"

BITCOIN BREAKOUT STARTEDBITCOIN FACING A SUPPORT LINE DALY chat plus a neckline BREAKING
In daly chat bitcoin facing a support line
Please check your own
And you can see the neckline also breaking
And over here a good falling also swowing
it will balance the fall by retraceing
with powerly due to support plus breakout
So it's a good opportunity for buy
Don't hesitate to trade
Grab it
Follows me for more
In daly chat bitcoin facing a support line
Please check your own
And you can check the neckline also breaking
And over here
a good falling also swowing
So it's a good opportunity for buy
Don't hesitate to trade
Grab it
Follows me for more

Bitcoin Trade SetupBitcoin is currently trading in a crucial zone
- Logically I think Bitcoin's price has not retracted a lot which is necessary
- Coming back to our thesis, if you are holding Bitcoin then you still can
- If you want to trade Bitcoin I think 59,000-64,000$ can be a great zone to accumulate it with 50% of your total investment value
- If you want to accumulate altcoins by looking at Bitcoin's price then my opinion would remain the same. However, you must consult your financial advisor before making any investments

Bitcoin Dominance Trade Setup- Bitcoin DOM is currently moving sideways but BTC DOM itself can help you easily predict where the money is going to flow next
- With the help of this correlation your bias becomes easier and you know where to focus instead of just technical analysis
- If BTC Dom starts moving up from here then you need to stay a little cautious about your Altcoins entries, I would suggest having patience and letting it soar until you see it getting rejected
- If BTC Dom starts to move down impulsively all you have to do is let your winners run and if you don't have any then focus on building partial SPOT Swings.
- Risk on the table shouldn't be breached or expanded if you can't handle it.
Social media outlets are good at portraying and making Trading look pleasing and flashy whereas the real meat is boring and time valued majorly

Bitcoin Price action.Bitcoin is form double bottom with support 42042. As per chart trend, It may test 54054 soon.

BITCOIN good fall wil occure best fall oneBITCOIN good fall wil occure
bicoin breaked todays tuf strong trendline
it will down a lot for few days
lie a week

Bitcoin: Breaking Barriers and Soaring to New HeightsBitcoin has been on a roller coaster ride in recent weeks, but it appears to have found some stability near the $29,000 level. The cryptocurrency took support from the white line on the chart, which is a key Fibonacci retracement level.
Now, Bitcoin is facing resistance at the $30,000 level. If it can break through this resistance, it could be on its way to higher prices. However, if it is rejected at this level, it could fall back to the support level at $26,000.
Traders will be watching closely to see if Bitcoin can break through the resistance at $30,000. If it does, it could be a sign that the cryptocurrency is ready to move higher. However, if it is rejected at this level, it could be a sign that the rally is over.
Technical Analysis:
Bitcoin is currently trading above its 20-day and 50-day moving averages.
The MACD indicator is currently showing a bullish crossover.
Conclusion:
Bitcoin is at a critical juncture. If it can break through the resistance at $30,000, it could be on its way to higher prices. However, if it is rejected at this level, it could fall back to the support level at $29,000. Traders will be watching closely to see which direction Bitcoin takes.

Bitcoin Short Setup Bitcoin is currently trading in a strong supply.
- I don't think there's any strong reason to still stay bullish now.
- I will look to trim my swing longs.
- Do not add swing longs or anything in your Portfolio.
- Max Kill Zone is 32,000$-33,000$ to trap fresh retailers.
- Try avoiding leverage until the market presents a strong setup.
- I will short some Altcoins when I see BTC pumping more.
#BTC #CRYPTO #crypto #eth

BITCOIN - Halving'20 to Halving'24 Price Projection#BITCOIN Weekly Chart Analysis
Here in this chart, I calculate CRYPTOCAP:BTC value at previous Halving time with their Last Lower-Low Cut-off Mark was $3.9k on March 2020 while Last Halving on 11 May 2020 with BTC Value on that day was $9.8k and First #ATH was created after Halving around in 11 months with $63.5k Mark Value.
Now same as per previous patterns, if i will follow it-
The upcoming Last Lower-Low is around $21.5k to $18.5k around Sept-Oct. and around Halving time of 11 April to 11 May 2024 its Value reach approx. $45k-50k and Next #AllTimeHigh will be create around Feb-March 2025 approx. $120k-$150k and then a Break-down comes and the final #ATH will be create around Nov.2025 to Jan. 2026 with min. $180k to $220k and max. $240k-$280k approx. as per Previously created Parabolic Chart View of Bitcoin Price Projections.
Always #DYOR and Trade wisely by using #StopLoss, it's #NFA
&
Must LIKE, COMMENT, SHARE on it....

Bitcoin Going to retest it's neckline before further upsideBitcoin has fallen after making recent high somewhere 31000. It has given almost more than 100% upside from recent lows. We have seen this roller coaster drive in last few months but in this Bitcoin has formed Inverse Head and Shoulder Pattern, and it has given proper breakout of it's neckline area now it is coming to retest this neckline area before any further move for upside. Well this is healthy correction, after this huge rally from down level there is always profit booking comes.
Now what next?
According to Chart pattern it should come to retest it's neckline area which is 25k somewhere and could take a bounce back from those level, well if it is doing as it is then that will be the best area to long for the target of 35k plus. In Weekly timeframe price is above 200-D EMA line, which is a signal of bullishness in bitcoin. We can only see disaster if it's breaking down 23k and sustain those levels in downside. But chances are very less as we seen Proper Inverse Head & Shoulder pattern at down.
So this was my Analyse on BITCOIN(btcusdt) If anyone likes then please press the like, and follow button and also comment and let me know your view on this.
Thankyou:))

Bitcoin under #BearishZone soon#Bitcoin will be soon break their support line of FWB:27K and goes under #BearishZone trend up to first below cut-off point FWB:25K -22k and second lower cut-off mark is FWB:21K -19k with more #Bearish trend of $19k-17k upto june-july 2023.

Bitcoin And BTC.D IdeaBitcoin Is Moving Sideways. And BTC.D Decrease , So We Can See Pump In Alts
Thanks, Follow Me On Tradingview

Bitcoin Has Taken Its Bottom ?Bitcoin Has Taken Its Bottom.,
You Can See In The Chart That In 2017 Bitcoin Formed Support By Falling 70.71% And In 2022 By Falling 60.00%. And After That In 2017, Bitcoin Fell By 45.88% And Made The Bottom Of Its 3rd Cycle. And Even In 2022, Bitcoin Fell By 46.05% And Made A Chart Like 2017 , It Seems That Bitcoin Has Made The Bottom Of The 4th Cycle.
Follow Me For Mor Valuable Information.

Bitcoin Short-forming bear divergencesBitcoin is making bear divergences in uptrend in 15m time frame.Price is making a clear divergence of upcoming bear move as shown in the RSI .If the trendline breaks out,a short intraday trade can be initiated on 15m.Keep an eye.

BITCOIN IS PUMPING BITCOIN, on 1st October broke through the parallel channel taking its support from the EMA and reaching the key resistance of $57,500. BTC is getting closer to its $65,000 all-time high.
BITCOIN may cross $63,000 and break it's all-time high this month and potentially surpass $65,000 by the end of the month if traders stay extremely bullisH
If BTC breaks to $61,000, there could be minimal upside pressure. All-time highs of nearly $65k will be the next resistance level before a potential price discovery phase. While the BTC price has fiercely rallied over the past few weeks, bitcoin balance on exchanges remains at the lowest levels in nine months, indicating investors are holding bitcoin in wallets rather than readying themselves to sell BITSTAMP:BTCUSD


Bitcoin analysisBitcoin forming a triangle pattern. Look out for resistance zone, if it breaks it will go down more


Bitcoin Possible Crash Towards $1150 ...Currently BitCoin has started to show up Signs that it might crash back to $1150 very soon. Their are couple of patterns in charts that i look for which are probably best for reversal indication and they are forming up in higher time frame charts of bitcoin. but there is more..
1- BitCoin Has recently broken above a long term curve at 1500, but there is very less possibility that it will sustain as volumes are not favoring it and lower curve is at around $1150.
2- There was a double top around 1150 and lower curve is also coinciding with it and it could act as a structure.
3- I think that bitcoin can crash towards $1150, which was the previous double top very soon and then we will have to analyse the situation again.
4- Gold & silver are indicating reversal from the down trend.
5- But if bitcoin tries to break the recent highs and tries to move above $1920-1950 then the scenario will be different and it could rally another $200-250 before crashing towards $1150, but crash is a very likely possibility.

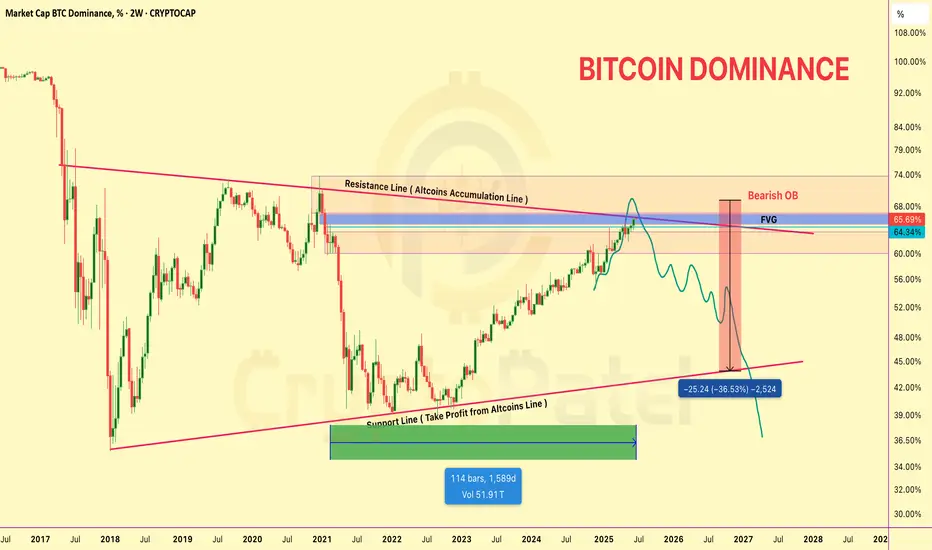
BITCOIN DOMINANCE ANALYSIS – Altseason Loading?BITCOIN DOMINANCE ANALYSIS – Altseason Loading?
This is the Bitcoin Dominance (BTC.D) chart.
Remember: BTC Dominance moves inversely with altcoins —
✅ When dominance goes down, altcoins usually go up.
✅ When dominance goes up, altcoins often struggle.
Current Situation
🔹 BTC Dominance is now testing a major resistance level, also known as the Altcoins Accumulation Line.
🔹 This level has historically marked the end of altcoin sell-offs and the beginning of altseason.
🟥 A clear Bearish Order Block and a Fair Value Gap (FVG) zone have formed at this resistance.
These are signs of potential reversal and weakness ahead for BTC Dominance.
If Rejected...
If BTC.D fails to break above this resistance, we could see a sharp drop of ~36%, targeting the long-term support line — an area that often signals profit-taking from alts.
Historical data shows a repeating pattern every ~4 years. This structure lines up perfectly with that cycle — a strong signal.
🔹 We’re likely at the final stage of the altcoin correction.
🔹 The market structure hints that a strong altcoin season could follow if dominance starts falling from this zone.
➡️ It’s a good time to start accumulating strong altcoins before momentum shifts.
Bitcoin Dominance Rejected — Mini Altseason Incoming!Bitcoin dominance is showing early signs of weakness. It has been consistently supported by a long-term trendline, but recent price action indicates rejection from a critical resistance zone. A bearish RSI divergence confirms the weakening structure.
If BTC dominance pulls back to the 58% level, we may see a mini altseason ignite. However, a break below 54% would confirm a full-fledged altseason, unlocking massive upside potential for altcoins.
Watch levels:
Resistance zone: 60.5% – 61%
Support zone: 58%
Breakout trigger: Below 54% = Full Altseason Mode
Be ready to rotate into strong alts!
#BitcoinDominance #Altseason #CryptoAnalysis #BTC #Altcoins #CryptoBreakout


Bitcoin Analysis and Trading Levels for 19th November 2024Bitcoin has been consolidating in the range of 85,100 to 93,500 for the last seven trading sessions. A breakout on either side could lead to a potential move of 7,000 to 10,000 points.
Trading Levels (1-Hour Candle):
Buy Above: 92,700 (Enter a buy position if the 1-hour candle closes above this level, confirming a bullish breakout.)
Sell Below: 88,700 (Enter a sell position if the 1-hour candle closes below this level, confirming a bearish breakout.)
Key Support and Resistance Levels:
Resistance Levels:
93,500 (Immediate resistance and upper boundary of the consolidation range.)
95,000 – 96,200 (Potential upside target zone post-breakout.)
100,000 (Psychological level and extended bullish target.)
Support Levels:
89,000 (Intermediate support near the sell trigger.)
85,100 (Lower boundary of the consolidation range.)
82,000 – 81,000 (Extended downside target post-breakdown.)
Potential Move on Breakout (1-Hour Candle):
Upside: A sustained breakout above 93,500 could lead to a move toward 100,000.
Downside: A breakdown below 85,100 could trigger a fall toward 81,000 or lower.
Trading Tips:
Wait for Confirmation: Ensure that the 1-hour candle closes firmly above or below the breakout levels before initiating trades.
Book Profits Regularly: Secure profits at key resistance or support levels to manage risk.
Use Trailing Stop-Loss: Adjust your stop-loss as the trade progresses to protect profits while following the trend.
Monitor Volumes: A breakout with high trading volume often confirms the validity of the move.
Disclaimer:
The trading levels and analysis are based on technical indicators and the 1-hour candle chart. This information is provided for educational and informational purposes only and does not constitute financial or trading advice.
Risk Management Guidelines:
Always use appropriate risk management techniques, such as stop-loss orders and position sizing.
Cryptocurrency markets are highly volatile. Be prepared for rapid price fluctuations.
Stay updated with relevant news and macroeconomic factors affecting Bitcoin.
Risk Disclosure:
Trading cryptocurrencies carries a significant risk of financial loss and may not be suitable for all investors. Past performance is not indicative of future results. Always consult a licensed financial advisor for personalized advice and trade only with funds you can afford to lose.
