BTCUSDT: Strong increase againHello dear friends!
BTCUSDT has witnessed a rapid surge but quickly underwent a correction. The price is currently trading around $43,000 today, marking a 0.51% recovery after signs of the correction nearing its end upon retesting the Breakout zone.
Karina's target: BTCUSDT aims to reach $48,000 in terms of price action. What about you?
Search in ideas for "btcusd"

BTCUSD Bitcoin possible Elliott wave countsHello Friends,
Here we had shared possible Elliott wave counts on 4 hourly chart of crypto currency BTCUSD Bitcoin, in which we can see that we are in impulse phase of waves in some degree and we had completed wave 1 & 2, and now possibly we are in wave 3, in which wave (i) of 3 has completed and now possibly we are at the verge of completion of wave (ii), we can assume up directions ahead as a wave (iii) of 3, post completion of wave (ii), Overall looks bullish ahead with invalidation level of 24756.
I am not Sebi registered analyst. My studies are for educational purpose only. Please Consult your financial advisor before trading or investing. I am not responsible for any kinds of your profits and your losses.
Thanks
RK💕
Most investors treat trading as a hobby because they have a full-time job doing something else.
However, If you treat trading like a business, it will pay you like a business.
If you treat like a hobby, hobbies don't pay, they cost you...!
Disclaimer and Risk Warning.
The analysis and discussion provided on in.tradingview.com is intended for educational purposes only and should not be relied upon for trading decisions. RK_Charts is not an investment adviser and the information provided here should not be taken as professional investment advice. Before buying or selling any investments, securities, or precious metals, it is recommended that you conduct your own due diligence. RK_Charts does not share in your profits and will not take responsibility for any losses you may incur. So Please Consult your financial advisor before trading or investing.

BTCUSDT ShortTime Frame: 4H
Symbol: BTCUSDT
Entry: 19824.52
TP: 18490.74
SL: 20645.31
Bias: Short
The current dynamic support and resistance is denoting a bearish bias.

BTCUSDT ShortTime Frame: 4H
Symbol: BTCUSDT
Entry: 19878.01
TP: 18792.07
SL: 20692.46
Bias: Short
Current bias is bearish and we are looking for a short opportunity.

"BTCUSDT LONG" "BITCOIN"GO LONG ON BTCUSDT - CAN RETEST THE SUPPORT OF 30000 AFTER THAT CAN GO FOR UPSIDE TARGET OF 43500 & 51000
first target 43500, bottom condition if 30000 not broken

"BTCUSDT LONG" "BITCOIN"GO LONG ON BTCUSDT - CAN RETEST THE SUPPORT OF 30000 & CAN BOUNCE UPSIDE FROM 30000 LOWS TOWARDS UPPER SIDE & AFTER THAT CAN GO FOR UPSIDE TARGET OF 43500 & 51000, LOWER SUPPORTS CAN BE TAKEN AS STOPLOSS & MANAGE ENTRY NEAR THE SUPPORTS ONLY FOR LONG SIDE
first target 43500, bottom condition if FIRST SUPPORT 30000 & SECOND SUPPORT 20800 not broken

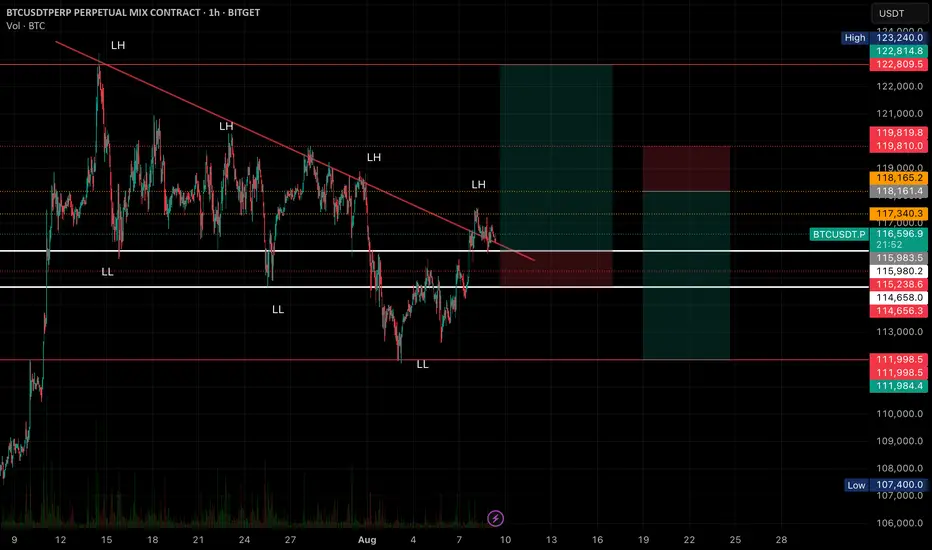
BTCUSDT – 1H Chart Analysis📊 BTCUSDT – 1H Chart Analysis
Current Structure
• Market has been in a downtrend with a sequence of Lower Highs (LH) and Lower Lows (LL).
• Price recently broke above the descending trendline and is now testing it for support.
• Key horizontal levels marked in white and red provide both breakout and rejection opportunities.
⸻
📈 Bullish Scenario (Breakout Confirmation)
• Trigger: If price holds above 116,000 – 116,200 and closes 1H above trendline.
• Entry Zone: 116,500 – 116,800 (post retest confirmation)
• Targets:
• TP1: 117,340 (immediate resistance)
• TP2: 118,165 (strong supply zone)
• Extended: 119,810 – 122,800 (major liquidity zone)
• Stop Loss: Below 115,980 (trendline break + support fail)
⸻
📉 Bearish Scenario (Rejection & Breakdown)
• Trigger: If price fails to hold above the trendline and breaks below 115,980.
• Entry Zone: 115,800 – 115,500 (after breakdown retest)
• Targets:
• TP1: 115,238 (previous demand)
• TP2: 114,656 (strong support)
• Extended: 112,000 – 111,984 (major demand)
• Stop Loss: Above 116,700 (fakeout invalidation)
⸻
💡 Summary:
• Bulls need a clean hold above the trendline to reverse the downtrend structure.
• Bears regain control if support breaks and price returns inside the descending channel.
• Watch volume closely — a breakout with weak volume may lead to a fakeout.
BTCUSD LONG Hello traders this is just a follow up for our analysis I posted for BTCUSD how it went.
As I mentioned that after it give breakout of either side we can look, and it gives up-side breakout in 1 day time frame you don't get such entry points because after giving break out next candle directly just went to our tp zone, but you can look for entry and exit point for 4h or 1h time frame for execution. I hope my analysis helps you to build your view 🙂🤗
We meet in another trade analysis, see you soon.

BTCUSDT: Upward momentum remains the sameHello dear friends!
Therefore, after BTCUSD surged to $45,800, the price began to adjust itself, and at the time of writing, it is trading steadily around $43,300.
From the analysis chart, we can see that the upward trend, although not as strong as before, is still intact. BTCUSDT is currently aiming to test around the Fibonacci 0.618 level. Once again, we can hope that the price will recover from this level with an expected increase to $59,488.
What are your thoughts on BTCUSDT?

BTCUSD for day plan we can short BTCUSD for days with stoploss at proper points
and go for big down side movement

BTCUSD in correction phase for long term uptrend.Elliott Wave Analysis : BTCUSD Swing Daily Uptrend, Intraday Downtrend
Trendline analysis on BTCUSD.
Trend Identification: Swing Downtrend BTCUSD .
Support/Resistance Levels: Identify key levels on the chart for potential entry and exit points.
Price Behavior: Daily Bullish pullback with market structure.
Targets: T1 = 27500, T2 - 26500. Check for Entry and Stop-loss.
Risk Management: Set appropriate stop-loss levels to manage risk and protect against adverse price movements.
Confirmation Indicators: Elliott Wave Corrective wave C.
Conclusion: Based on the chart wave analysis of , BTCUSD is Downtrend has been identified. Combine this analysis with thorough research and risk management strategies to make well-informed trading decisions. Avoid counter-trend trading. Happy trading!
(Note: Trading is subject to market risk. This is analysis not an trade idea for trade.)

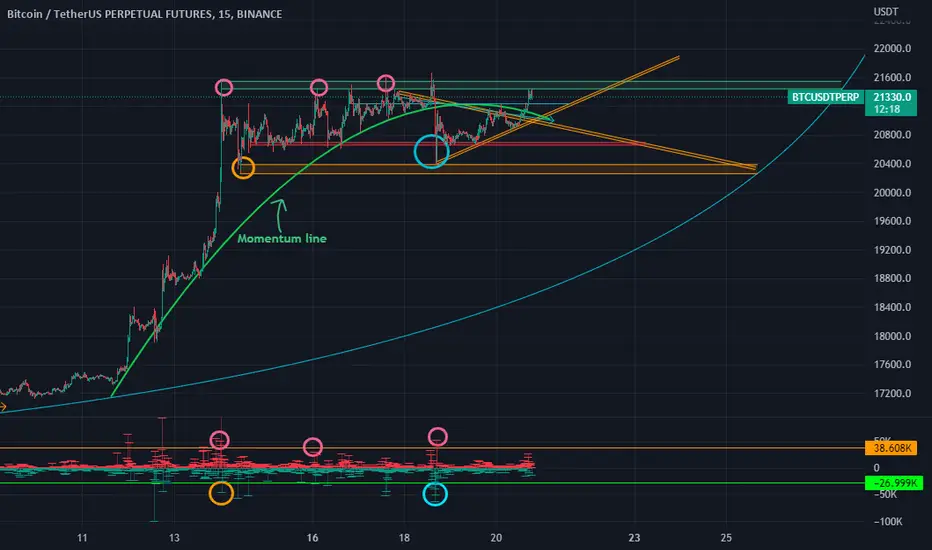
#BTCUSDTPERP #VolumeAnalysis #withpriceHiii
Concept and some logic : If we see a suddend increase in volume of eg 26k btc this types of volumes is consider as market maker are buy/sell at the positions which cause a long wick formation . this wick is mainly for liquidation of retail trader position forcefully .
BTCUSDTPERP Price action drawing with combination of volume analysis , multiple wick touching points and trend momentum shown with curve green line . circle denotes volume comparison with price .
i used a up/down volume indicator so easy to mark the volume that is buy/sell by market maker and a curve drawing tool parallel channel for creating a price zone and trend momentum line
BTCUSDT LONG(worst case scenario) 52-54k is an important level and we can expect a bullish impulse from there for the next ATH for BTCUSD. Although I personally think it's a good to enter long at 58-59k level.

BTCUSD to see an uptrend bias | Moving Averages indicating buyMarket in last 24hrs
-BTCUSD moved sideways, price above 11k
-Price volatility was high. Market moved ~3.02%, between $11.2k and $10.86k
Today’s Trend analysis
-Low volatility ahead with a bullish bias
-Price at time of publishing: $11,050
-BTC’s market cap: $203 Billion
-Oscillator indicators are mostly neutral. RSI at 73
-Moving average indicators are biased towards uptrend. Ichimoku Cloud is neutral
-Volume indicators are indicating a low volatility ahead. Very low volumes observed in recent candles, volumes were less than 20 candles moving average.
Price expected to move upwards, low volatility due to low volumes. Most of the Oscillator indicators are neutral. MACD is positive around 360, histogram size decreasing in last few candles about to cross down zero, indicating a bearish sign. RSI at 73, still in the overbought region indicating bearish opportunity. CCI is above 70, and in neutral region signaling a sideways movement. Another interesting point to notice here is that the candles are making higher lows which indicates a buying pressure.
----------------------------------------------------------------------------------------
The analysis is based on signals from 28 technical indicators, out of which 17 are moving averages and remaining 11 are oscillators. These indicator values are calculated using 4 hr candles.
DM to get details of the above analysis and list of indicator & their values used to arrive at the above conclusion.
Note: Above analysis would hold true if we do not encounter sudden jump in trade volume .
----------------------------------------------------------------------------------------
If you find the analysis useful, please like and share our ideas with the community!
- Mudrex

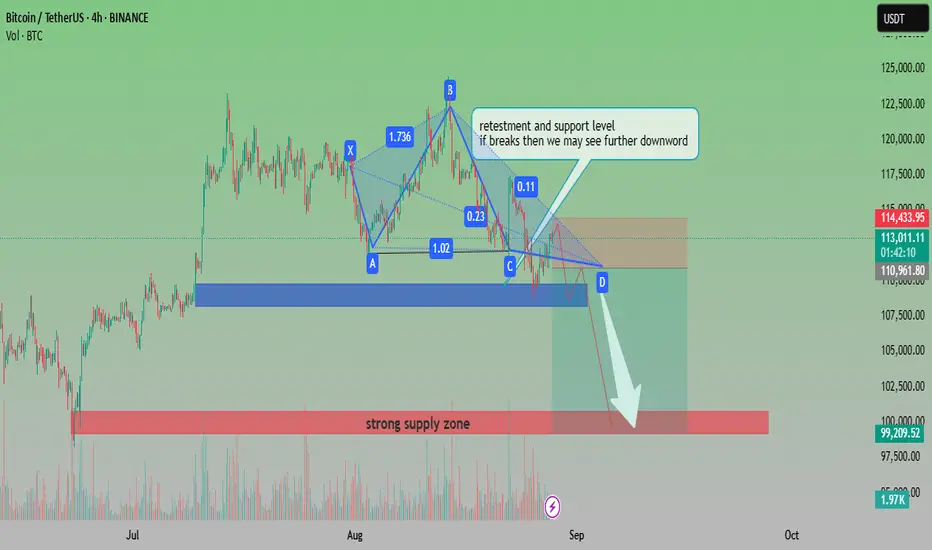
BTCUSDT Bearish Pattern with Key Support RetestAnalysis:
The chart shows Bitcoin (BTCUSDT) forming a harmonic pattern that signals potential bearish continuation. Price is currently retesting a critical support and resistance level around the 113,000–114,000 zone. If this level fails to hold, further downside movement is expected.
Pattern Formation: The harmonic structure (XABCD) suggests a bearish setup.
Support Zone: Around 110,900–111,000, a crucial level to watch.
Downside Target: If support breaks, the price could move toward the 99,000–100,000 strong supply zone.
Volume: A noticeable volume build-up supports potential continuation to the downside.
📉 Outlook: Bearish bias. A breakdown from current retest levels may accelerate selling pressure toward the 100k psychological zone.
BTCUSD updated viewA resistance zone was created on BTCUSD at the 99113 - 99944 level.
Also at the same level from top to bottom one resistance trend line shows strong resistance in that area. while looking at the HNS pattern in RSI on a closing basis and both the resistance zone and trendline we need a strong closing above the zone with the trendline breaking, then we can see the bigger target in BTCUSD.
otherwise, BTCUSD will take the resistance from the trendline and zone and can see the support level again.
I already shared what-if support level breaks.

BTCUSDT: Wave 1 Momentum Continues, Backed by Dow TheoryBitcoin (BTCUSDT) has shown a significant breakout, continuing its Wave 1 formation as per Elliott Wave Theory. Currently trading above $91,000, BTC has breached key resistance levels, confirming strong bullish momentum.
Dow Theory reinforces this uptrend, with consistent higher highs and higher lows forming a solid foundation. The breakout from the prolonged consolidation zone (Wave 2) signals the continuation of Wave 1. This momentum aligns with classic market behavior observed in bullish trends, where upward price action accelerates after consolidation.
The next target lies at the 1.618 Fibonacci extension, near $103,600. Traders should monitor any retracements as potential opportunities for accumulation, especially around $74,000, which could act as a key support if a corrective wave emerges. The alignment of Dow Theory with Elliott Wave patterns underscores Bitcoin's bullish potential in this phase.

BTCUSDT: Short term buying and selling strategy.Based on the BTCUSDT chart you provided, here’s a concise trading strategy:
Resistance Area: The price range between $64,000 and $68,000 is acting as strong resistance. The price has previously been rejected at this level, signaling a potential sell opportunity.
Sell Plan: If the price moves up and tests this resistance zone again ($64,000 - $68,000), consider entering a sell position upon seeing a bearish reversal signal. Set a stop-loss just above $68,000.
Take-Profit Target: Aim for a take-profit target around the $53,800 - $54,000 area, which is a significant support zone.
Risk/Reward: This strategy offers a reasonable risk-to-reward ratio, particularly as the price continues to move within a downtrend channel.
If the price breaks below the $53,800 support level, there could be further downside potential.

BTCUSD - BITCOIN AT MAKE OR BREAK LEVELS ?Symbol - BTCUSD
Bitcoin has climbed higher in recent months on enthusiasm and demand generated by the nearly dozen spot bitcoin ETFs that were approved in January, as well as crypto's next 'halving' event and the prospect of Fed rate cuts this year.
But Fed rate cut expectations have been dialed back significantly amid hotter-than-expected inflation prints, which means central bankers look poised to keep rates higher for longer to fight inflation. Markets are now pricing in the fact that the Fed will only cut rates two times or less this year (as of now), according to the CME FedWatch tool.
BTCUSD CMP - 62,000
Bitcoin is currently trading & consolidating in a wide range of 61,000 - 72,000 levels.
Currently bitcoin is trading at lower range of this channel which is around 61,000-62,000 level.
60,000 is make or break level of Bitcoin as of now.
Bitcoin has to sustain above 60,000 - 61,000 for any further up move. On breakdown of these levels, We may see bitcoin coming back to 52,000 - 50,000 levels.
On sustaining 60,000 - 62,000 levels and moving up, we may see Bitcoin moving up to 85,000 and even 1,00,000.
For me, Sustaining and moving up/breakout scenerio is likely. So I'm taking positional long positions in BTCUSD at CMP 62,000 with SL below 60,000.
Incase BTCUSD breaking below 60,000 sustaining & closing below it. I'll close my long position & then I'll look to short it with SL above 62,000.

BTCUSDT: progressing closer to correction
Hello everyone, it's RKarina here again, let's plan our new week strategy together!
Today, BTCUSDT is trading at $63,728, marking a 0.96% increase as the week begins.
From the analysis chart, it is clear that BTCUSDT is approaching its all-time high and forming a cup and handle pattern. In my personal opinion, BTCUSDT is preparing for a corrective phase, with my target set at $51,500 and further decline to $41,500.

BTCUSDT: What will happen this week?Dear friends, as predicted earlier, BTCUSDT continues its downward trend, currently at $41,178, marking a decrease of nearly 1.08% for the day.
Technical analysis indicates that BTC has been unable to surpass the crucial resistance level at $43,600. Furthermore, the convergence of EMA and the resistance zone at $42,238 further suggests the possibility of further decline. If BTCUSDT breaks below the strong support level at $40,200, we may witness a significant drop compared to the initial profit-taking point of around $37,700 for sellers, as there is no solid support to reverse the previous trend.
What are your thoughts on how BTCUSDT will evolve in the near future?

BTCUSDT: suddenly turned down in priceLet's take a fresh look at BTCUSDT today. After a sudden drop last weekend, from a high of $48,900, BTCUSDT has slipped down to $42,666.
Technical analysis suggests that the bearish side is now taking control, with BTC dropping nearly $6,000 in a short period of time. The 4-hour chart and EMA 34 indicate a continued downward trend.
Given the current scenario, a selling strategy with a short-term target of $40,700 is being considered.
What about you? What are your predictions and strategies for the next moves of BTCUSDT?

BTCUSDT: bullish trade with DOW wave?Dear friends, as predicted by RKarina, the price has escaped from the sideways box pattern and has experienced a significant increase.
Currently, BTCUSDT is trading around the $46,000 mark and is undergoing a correction phase after breaking through the resistance level at $45,500. Assuming this is a price behavior, BTCUSDT is expected to continue rising after the correction is over and use this level as a new support.
From a fundamental analysis perspective, the price is still in wave 1 of an upward trend, although no corrections have occurred yet.
Therefore, RKarina's target is $50,000 or higher at the Fibonacci 0.168 level ($52,275). What are your thoughts on this?
