💡Don't miss the great buy opportunity in VeChain/Ethereum Trading suggestion:
. There is a possibility of temporary retracement to suggested support line (0.00002655). if so, traders can set orders based on Price Action and expect to reach short-term targets.
Technical analysis:
. VeChain/Ethereum VETETH is in a range bound and the beginning of uptrend is expected.
.The price is above the 21-Day WEMA which acts as a dynamic support.
. The RSI is at 66.
Take Profits:
TP1= @ 0.00003175
TP2= @ 0.00003865
TP3= @ 0.00004845
TP4= @ 0.00005655
TP5= @ 0.00006435
TP6= @ 0.00007585
TP7= @ 0.00009038
SL= Break below S2
❤️ If you find this helpful and want more FREE forecasts in TradingView
. . . . . Please show your support back,
. . . . . . . . Hit the 👍 LIKE button,
. . . . . . . . . . . Drop some feedback below in the comment!
❤️ Your Support is very much 🙏 appreciated! ❤️
💎 Want us to help you become a better Forex trader ?
Now, It's your turn !
Be sure to leave a comment let us know how do you see this opportunity and forecast.
Trade well, ❤️
ForecastCity English Support Team ❤️
Search in ideas for "ethereum"

Trading Signal For EthereumTrading Signal:
A Trading Signal is seen in the Ethereum ETHUSD .
Traders can open their Sell Trades NOW
If you liked our ideas, please support us with your likes 👍 and comments.


EYES ON ETHEREUM : SCALP CHART PATTERN IN SHORT/DAY TRADINGIn ethereum charts, am expecting a downfall in short term. shorting here can be good for profits. check charts and you will get an idea of what exactly can happen.

There is a trading opportunity to buy in Storj EthereumTechnical analysis:
. STORJ/ETHEREUM is in a range bound and beginning of uptrend is expected.
. The price is below the 21-Day WEMA which acts as a dynamic resistance.
. The RSI is at 40.
Trading suggestion:
. The price is in a range bound and we forecast the uptrend would begin.
. There is a possibility of temporary retracement to suggested support zone (0.00113 to 0.00094). if so, traders can set orders based on Price Action and expect to reach short-term targets.
Beginning of entry zone (0.00113)
Ending of entry zone (0.00094)
Entry signal:
Signal to enter the market occurs when the price comes to "Buy zone" then forms one of the reversal patterns, whether "Bullish Engulfing" , "Hammer" or "Valley" in other words,
NO entry signal when the price comes to the zone BUT after any of reversal patterns is formed in the zone.
To learn more about "Entry signal" and the special version of our "Price Action" strategy FOLLOW our lessons:
Take Profits:
TP1= @ 0.00132
TP2= @ 0.00150
TP3= @ 0.00180
TP4= @ 0.00213
TP5= @ 0.00287
TP6= @ 0.00347
TP7= @ 0.00407
TP8= Free

There is a trading opportunity to buy in Icon EthereumTechnical analysis:
. ICON/ETHEREUM is in a range bound and beginning of uptrend is expected.
. The price is below the 21-Day WEMA which acts as a dynamic resistance.
. The RSI is at 47.
Trading suggestion:
. The price is in a range bound and we forecast the uptrend would begin.
. There is a possibility of temporary retracement to suggested support zone (0.0041 to 0.0034). if so, traders can set orders based on Price Action and expect to reach short-term targets.
Beginning of entry zone (0.0041)
Ending of entry zone (0.0034)
Entry signal:
Signal to enter the market occurs when the price comes to "Buy zone" then forms one of the reversal patterns, whether "Bullish Engulfing" , "Hammer" or "Valley" in other words,
NO entry signal when the price comes to the zone BUT after any of reversal patterns is formed in the zone.
To learn more about "Entry signal" and the special version of our "Price Action" strategy FOLLOW our lessons:
Take Profits:
TP1= @ 0.0049
TP2= @ 0.0061
TP3= @ 0.0070
TP4= @ 0.0075
TP5= @ 0.0090
TP6= @ 0.0105
TP7= Free

There is a trading opportunity to buy in Verge Ethereum ...Technical analysis:
. VERGE/ETHEREUM is in a downtrend and beginning of uptrend is expected.
. The price is below the 21-Day WEMA which acts as a dynamic resistance.
. The RSI is at 29.
. While the RSI resistance #1 is not broken, the probability of price increase would be too low.
Trading suggestion:
. The price is in a downtrend, but we forecast the uptrend would begin.
. There is a possibility of temporary retracement to suggested support zone (0.0000560 to 0.0000482). if so, traders can set orders based on Price Action and expect to reach short-term targets.
Beginning of entry zone (0.0000560)
Ending of entry zone (0.0000482)
Entry signal:
Signal to enter the market occurs when the price comes to "Buy zone" then forms one of the reversal patterns, whether "Bullish Engulfing" , "Hammer" or "Valley" in other words,
NO entry signal when the price comes to the zone BUT after any of reversal patterns is formed in the zone.
To learn more about "Entry signal" and the special version of our "Price Action" strategy FOLLOW our lessons:
Take Profits:
TP1= @ 0.0000700
TP2= @ 0.0000796
TP3= @ 0.0000968
TP4= @ 0.0001186
TP5= @ 0.0001453
TP6= @ 0.0002030
TP7= Free

A Great Trading Opportunity to Buy in Zcash / Ethereum ...Technical analysis:
. ZCASH/ETHEREUM is in a Range Bound and Beginning of uptrend is expected.
. The price is above the 21-Day WEMA which acts as a dynamic support.
. The RSI is at 64.
Trading suggestion:
There is a possibility of temporary retracement to suggested support zone (0.390 to 0.329). if so, traders can set orders based on Daily-Trading-Opportunities and expect to reach short-term targets.
. Beginning of entry zone (0.390)
. Ending of entry zone (0.329)
Entry signal:
Signal to enter the market occurs when the price comes to "Buy zone" then forms one of the reversal patterns, whether "Bullish Engulfing" , "Hammer" or "Valley" , in other words,
NO entry signal when the price comes to the zone BUT after any of reversal patterns is formed in the zone.
To learn more about "Entry signal" and the special version of our "Price Action" strategy FOLLOW our lessons:
Take Profits:
TP1= @ 0.518
TP2= @ 0.565
TP3= @ 0.710
TP4= @ 0.828
TP5= @ 0.946
TP6= @ 1.049
TP7= @ 1.252
TP8= Free

Cryptocurrency Ethereum / Bitcoin = BUYThe best entry point to BUY = LONG-TERM
Hello!
Those who want to buy Ethereum for Bitcoin, better wait for the best entry point!
Below are all my exhibits >>>
There are signals that are relevant to this day!
So enjoy your viewing:
Particularly interesting is the fact that by the end of May 2018, Bitcoin will fall to $ 3000.
But before that, of course it goes for about $ 22,000
Here is the last signal for Bitcoin:
BTCUSD, D
LONG
Cryptocurrency Bitcoin / Dollar = BUY
BTCUSD, D
LONG
Cryptocurrency Bitcoin / Dollar = BUY
BTCUSD , D
LONG
Cryptocurrency Bitcoin / Dollar = BUY
But the analysis and signal Bitcoin since January 4.
EURUSD, M
SHORT
Euro/ Dollar = ( Futures 6E) = Sell
The euro came to the targets for sale
ZECUSD , 240
LONG
Cryptocurrency Zcash / Dollar = BUY
STRATBTC , D
LONG
Cryptocurrency Stratis / Bitcoin = BUY
While also going right
NEOUSD, 240
LONG
Cryptocurrency NEO / Dollar = BUY
DOGEBTC, D
LONG
Cryptocurrency Dogecoin / Bitcoin -5.88% = BUY
AMGN , D
SHORT
Stock AMGN Amgen Inc = Short Positions
Sales are canceled, I will try to go out on my 185 - 186 there where I sold it.
BCYBTC , 240
LONG
Cryptocurrency BitCrystals
For the present I hold.
BCHUSD , D
LONG
Cryptocurrency Bitcoin Cash / Dollar = BUY
IOTUSD , D
LONG
Cryptocurrency Iota / Dollar = BUY
XRPUSDT , D
LONG
Cryptocurrency Ripple / Tether Dollar = BUY
DASHUSD, D
LONG
Cryptocurrency DASH / Dollar = BUY
T, W
SHORT
Stock T AT&T Inc = Short Positions
I'm sitting in position, Longevity!
XEMUSD, D
LONG
CryptoCurrency Nem / Dollar = BUY
XEMBTC D
LONG
Crypto currency NEM / Bitcoin = BUY

Ethereum Bullish Breakout Setup with Support,Entry,SL,and targetEthereum (ETH/USD) 1H Analysis
Trend: Price has been trading inside a descending channel but recently broke above, showing a potential bullish reversal.
Support Zone: Strong support between $4,201 – $4,269, where buyers are likely to defend.
EMA Strategy: Price is hovering near the EMA (70), a breakout and retest above EMA indicates bullish strength.
Chart Pattern: Potential breakout from falling channel → bullish continuation expected.
Price Action: After testing support, ETH is expected to bounce higher.
Target Point: If support holds, upside potential towards $4,663 (≈ +9.2%).
Risk Management: Stop-loss below $4,200 to manage downside risk.
✅ Summary: ETH is showing bullish breakout potential. Best strategy is to wait for a retest of the support zone ($4,201 – $4,269) and aim for the $4,663 target, with a protective stop below support.

Ethereum still more fall possible no buy Signal yet on harmonic Ethereum still sell on rise more downside possible avoid any buy trade at current price.
Support area : 4250-4210 , 4090-4065 , 3915-3860
Resistance area : 4420-4460, 4555-4615, 4780
How My Harmonic pattern projection Indicator work is explained below :
Recent High or Low :
D-0% is our recent low or high
Profit booking zone ( Early / Risky entry) : D 11.8% -D 16.1 % is
range if break them profit booking start on uptrend or downtrend but only profit booking, trend not changed
SL reversal zone (Safe entry ) : SL 23% and SL 25% is reversal zone if break then trend reverse and we can take reverse trade
Target : T1, T2, T3, T4 and .
Are our Target zone
Any Upside or downside level will activate only if break 1st level then 2nd will be active if break 2nd then 3rd will be active.
Total we have 7 important level which are support and resistance area
Until , 16% not break uptrend will continue if break then profit booking will start.
If break 25% then fresh downtrend will start then T1, T2,T3 will activate
1,3,5,10,15,20 minutes are short term levels.
30 minutes 60 minutes , 2 hours,3 hours, ... 1 day and 1 week chart positional and long term levels

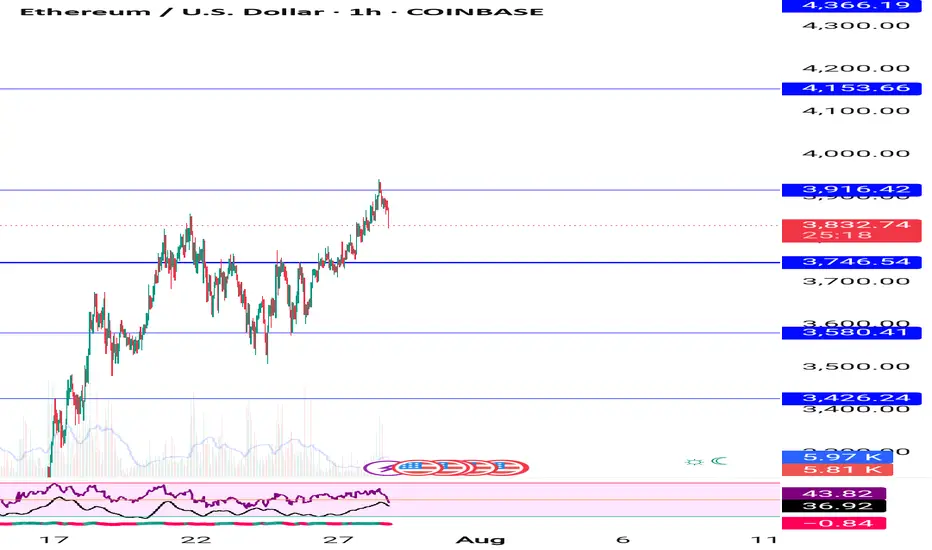
Ethereum sell recommended near 3840 downside maximum targets hitEthereum sell on rise recommended last week near 3840 downside maximum targets hit .
Updated levels given on chart . Start buying on dip near support area

Ethereum as expected trying to make new ATH buy on dip at suportEthereum long term buying given many times near 1580-1600 at current price avoid huge quantity buying wait for dip near 2890-2900 then buy big quantity , levels mentioned on chart buy on dip near support
Ethereum (ETH/USDT) Daily Chart Analysis Key Breakout Zone in PlEthereum (ETH/USDT) Daily Chart Analysis 🧠📈 – Key Breakout Zone in Play! 🚀🔍
🔹 Current Price Action:
ETH is currently trading at $3,079, showing solid bullish momentum (+2.18%) after breaking above multiple key exponential moving averages (EMA 20/50/100/200).
📊 Technical Highlights:
✅ Bullish Momentum:
Price has clearly broken above the EMA 200 ($2,507), showing strength and confirming trend reversal.
The recent bullish breakout took ETH past the critical resistance zone ($2,950–$3,100), now turning into a support area.
📦 Key Zone (Resistance ➡ Support):
The purple shaded area marked as "RESISTANCE + SUPPORT" has been tested multiple times historically.
ETH is retesting this zone, which may act as a launchpad for a rally toward the next major resistance levels.
🎯 Target Zones (Upside Potential):
📌 $3,455 – First major resistance level.
📌 $3,742 – Mid-term target.
📌 $4,106 – Key psychological + technical resistance.
If momentum holds and volume supports the move, these zones could be tested in the coming weeks.
⚠️ Bearish Scenario (If Rejected):
If ETH fails to hold the current zone, we could see a pullback to the EMAs:
🔻 Support Levels:
$2,742 (short-term)
$2,582
$2,361 (critical)
$2,107
$1,768 (worst-case retracement)
💧 A drop below $2,500 would invalidate the bullish structure.
🧠 Conclusion:
ETH is in a crucial decision zone. A successful hold above $3,000 could drive a move toward $3,700–$4,100 🚀. Watch volume, price action near $3,100, and macro cues for confirmation.
📌 Pro Tip:
Watch for a clean retest + bullish candlestick pattern in the current support zone (purple) for a high-probability long setup 🧐📊.

Ethereum (ETHUSD) Update – 15 Min ChartEthereum has respected the key support zone near $2,382, forming a potential bullish reversal candle after testing the level multiple times.
🔹 Support Held: $2,382
🔹 Current Price: $2,401
🔹 Resistance Zone: $2,435 – $2,440
🔹 Bias: Short-term bullish as long as price holds above $2,382
📌 A clean bounce from the demand zone indicates buyer interest. If ETH sustains above $2,400, we may see a move toward the $2,435 target.
🧠 Structure remains positive above support — risk-managed long opportunity.

Ethereum Ignites: Breakout Confirmed, Next Stop $2,900+Ethereum just flipped the switch.
After a prolonged accumulation phase and clean breakout from the prior range, ETH has officially entered an aggressive bullish cycle. The breakout above the consolidation zone around $2,250–$2,400 wasn’t just technical — it was conviction-driven. Price launched out of the zone with momentum, confirming bullish intent.
This breakout zone now turns into a strong buy zone on any retest. If ETH pulls back, it will only serve as a reload point before the next explosive move. The structure is intact, volume is validating the move, and momentum is fully shifted to the upside.
The next target is clearly marked at $2,917, a key level that aligns with past structure and potential liquidity buildup. There are no signs of weakness in the current trend — this rally is built on solid breakout energy.
Summary:
• Breakout confirmed above prior range
• Buy zone now sits between $2,250–$2,400
• $2,900+ is the next visible magnet
• Trend is strong, pullbacks are for positioning — not for fear

Ethereum Wyckoff Accumulation – Weekly Chart BreakdownEthereum Wyckoff Accumulation – Weekly Chart Breakdown
ETH is showing a textbook Wyckoff Accumulation pattern playing out on the 1W timeframe — and if it holds, we could be gearing up for a major breakout rally in the coming months.
Phase Breakdown:
✅ Phase A: Selling Climax (SC) marked the bottom. Automatic Rally (AR) set the resistance. Secondary Tests (ST) confirmed demand at lower levels.
✅ Phase B: Smart money accumulated heavily within the range — no directional move, just shakeouts and traps.
✅ Phase C: The Spring — price dipped below support to liquidate weak hands. Classic bear trap.
✅ Phase D (NOW): Recovery begins. If we see a Sign of Strength (SOS) above resistance with volume, Phase E (markup) is confirmed.
✅ Phase E: Full breakout mode. Higher highs, higher lows. Price discovery.
🟢 Accumulation Zone: $1,600–$1,300
🟢 Key Resistance: ~$3,600–$4,000
🟢 Projection Zone: $4,800 to $7,800+ (if SOS confirms)
✅ Bias: Bullish
Note: Watch for a clean breakout above the resistance zone. Low volume pullbacks = strength.
This is the kind of setup you don’t want to ignore.

Ethereum shortEthereum :ethusd could possibly go to 1, 000 before it bounce . A very good shorting opportunity since 2, 700.
Happy shorting 🙂!!

Ethereum TechnicalEthereum has been pivotal in the blockchain space, not just for its cryptocurrency but for its platform capabilities. Its evolution continues to be watched closely by both enthusiasts and skeptics, given its impact on blockchain technology and decentralized systems. I
chart for your reference

Ethereum Breakout? Inverse Head & Shoulders Pattern Ethereum has formed an inverse head and shoulders pattern on the 4-hour time frame, which is typically a bullish reversal signal.
For confirmation, ETH needs to break above the $2,450 resistance level.
Once this breakout is confirmed, the price could target the $2,800 level, indicating a potential upward move.
Keep an eye on volume during the breakout for further confirmation of a strong rally.

Ethereum Flash Pump Trade Setup - Ethereum X CPI Catalyst - We have the CPI today. What can we expect to see before the event?
- Price has deviated twice forming an excess price and then returning to Equilibrium
- There have been significant liquidity grabs and now a base is forming. The question is where will the price go next?
- In my opinion, it is likely to move upwards or expand given the significant sell-side imbalance and numerous fair value gaps.
- To understand the bias we need to grasp the expansion along with the CPI and it appears we are likely to see an upward expansion if the CPI is below estimates

Ethereum Trend Contracting FanEthereum trend contraction fan, the main target is the upper white line resistance, the key target is the lower white line support

Ethereum Seen Hitting $5,000 as GermanEthereum has shown some degree of resilience in the face of heavy volatility in the broader crypto landscape, keeping ground above the $3,000 barrier in a week when Bitcoin stumbled under the weight of German economic policies.
Ether hodlers are keenly observing as the terrain of digital currencies undergoes notable changes; many of them are focusing on a possible $5,000 milestone.
A Test Of The Mark
