Eth/usdtEthereum hitt approx all targets but now looking slightly bearish with head& shoulders pattern, if we loose supports then maybe hit lower targets..!!
Search in ideas for "ethereum"

Ethereum (ETH) Inside PitchFork Disclaimer: This information is for educational purposes only invest at your own risk !!

Ethereum : Time to short ?
Everything has been explained above!
Just for educational purpose only.
Not a Financial Advice.

ETHEREUM (ETHUSD) breaoutbeautiful breakout can lead to a long bull run. Triangle breakout and also flag breakout at the end very strong conviction.

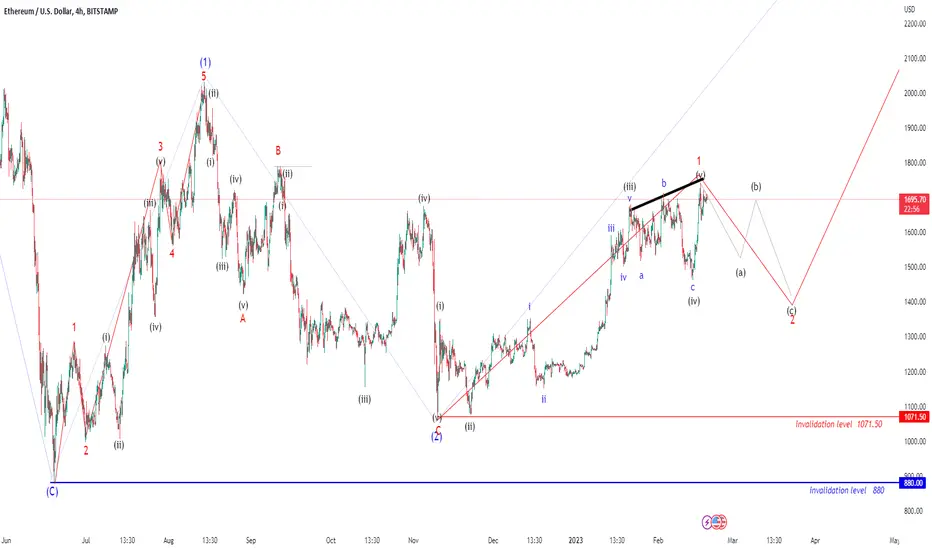
Ethereum possible Elliot wave counts Here we have shared possible Elliot wave counts of ETHUSD (for educational purpose only) which are suggesting correction for very short term and this correction can be used as good opportunity to go long for further trend which is expected post this correction, the invalidation level of further up move can be low of previous wave 1 which is pegged at 1071.50, if it breaks below this level then we can assume that our counting is missing something and we may invalidate this structure, Overall we are unfolding some impulse in which we had completed wave (1) and now possibly we are heading to unfold wave (2) and then, post correction we can start wave (3). wave (2) can unfold in three subdivisions like ABC and ABC can unfold in 5-3-5 structure or 3-3-5 structure. Lets see what happens next.
My studies are for educational purpose only.
Please Consult your financial advisor before trading or investing.
I am not responsible for any kinds of your profits and your losses.
Overall wave structure is shared below
Most investors treat trading as a hobby because they have a full-time job doing something else.
However, If you treat trading like a business, it will pay you like a business. If you treat like a hobby, hobbies don't pay, they cost you...!
Disclaimer.
I am not sebi registered analyst.
My studies are for educational purpose only.
Please Consult your financial advisor before trading or investing.
I am not responsible for any kinds of your profits and your losses.


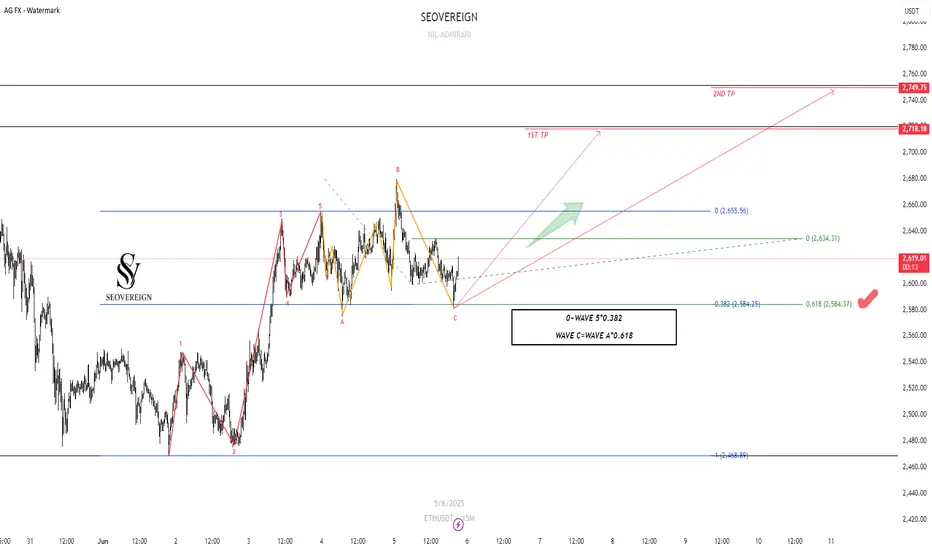
Ethereum Long Setup – Chart Analysis (June 5, 2025)We are the SeoVereign Trading Team.
With sharp insight and precise analysis, we regularly share trading ideas on Bitcoin and other major assets—always guided by structure, sentiment, and momentum.
🔔 Follow us to never miss a market update.
--------------------------------------------------------------------------------------------------------
Here is a technical analysis of Ethereum.
The current wave structure is considered to be in the final stage of a corrective wave, with the following evidence based on length ratios.
First, the 5th wave of wave C forms a length that is 0.618 times that of waves 0 to 3.
Second, the fact that wave C ended at the 0.382 Fibonacci retracement level of waves 1 to 5 increases the possibility of technical support.
As these conditions are met, the current zone is considered a valid buying point for entering a long position.
Target Prices
1st target: 2,700
2nd target: 2,750
This zone overlaps with past resistance and technical retracement ratios, making it appropriate as a short-term liquidation zone.
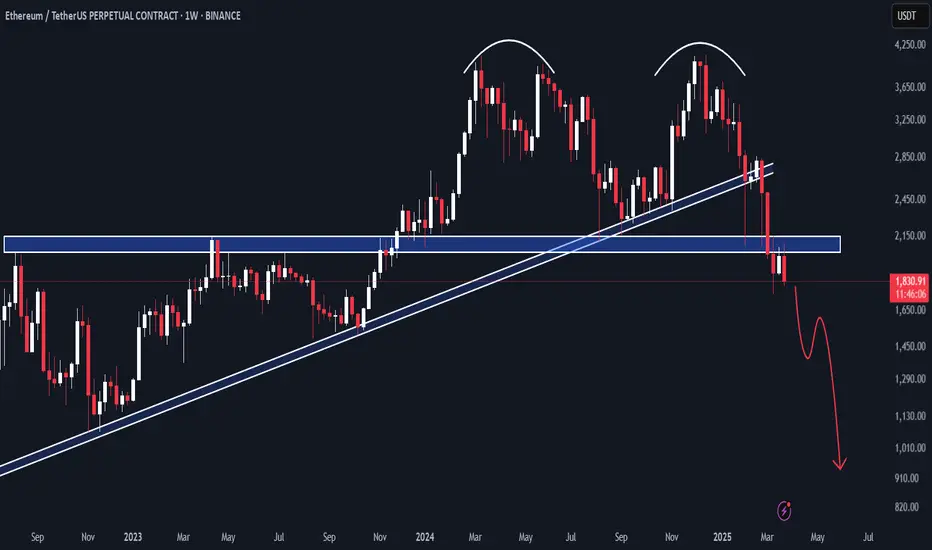
Ethereum Weekly AnalysisThe chart is showing some bearish signs for Ethereum. If the price doesn't bounce back above $1,750, we might see a bigger drop in the coming days or weeks.
Ethereum 5-Min Sell Entry Point Analysis"The white level shown here is the selling level for Ethereum. An entry should be taken in the 5-minute timeframe."


ETHEREUM PREDICTIONAs you all can see we witnessed a good rally in ethereum.
but $289 is a crucial resistence level , after which we may see a correction in prices upto $255-250.
if $289 is crossed then we may see a further up move.
According to MACD , trend is soon going to end . and we may see a correction.
Same depicted by RSI, which is in its overbought zone.
So keep an eye on $289. its crucial resistance.
sell @ $289.
buy@ $255-250 levels.
HAPPY TRADING!

Ethereum (#Ethereum) tests its long-term trendline support When Ethereum (#Ethereum) tests its long-term trendline support, it often sparks a significant upward market movement, known as a bull rally.
#Pattern_Recognition: Ethereum (#Ethereum) has shown a recurring pattern where testing its long-term trendline support has resulted in substantial bull rallies.
#Historical_Timing: Notably, each of these support tests has historically occurred in the month of January.
#Projection_for_2024: If the historical trend continues, there's a possibility of witnessing a similar upward market movement or bull rally in January 2024, following the long-term trendline support test.

Ethereum (ETH) Price Prediction — Will ETH Hit $1700 Soon?Ethereum (ETH) Current Market Status
According to CoinGecko, the price of Ethereum (ETH) is $1,295.25 with a 24-hour trading volume of $7,480,811,788 at the time of writing. However, ETH has increased by nearly 0.8% in the last 24 hours.
Moreover, Ethereum (ETH) has a circulating supply of 120,914,876 ETH. Currently, Ethereum (ETH) trades in cryptocurrency exchanges such as Binance, FTX, KuCoin, Gate.io, HuobiGlobal
Ethereum (ETH) Price Prediction 2022
Ethereum (ETH) holds the 2nd position on CoinGecko right now. ETH price prediction 2022 is explained below with a daily time frame.
Descending Channel also known as the falling channel . A descending channel is formed by two parallel trendlines . The upper trendline, which joins the highs, and the lower trendline, which joins the lows, run parallelly downwards. This pattern is the characteristic of a bearish market.
Currently,Ethereum (ETH) is in the range of $1300. If the pattern continues, the price of SHIBINU(SHIB) might reach the resistance levels of $ 1700,If the trend reverses, then the price of Ethereum (ETH) may fall to $1200
Happy Trading

ETHEREUM Long Outlook – Grand Supercycle Perspective(2025.05.21)Hello everyone,
This is SeoVereign, operator of the SeoVereign Team.
Today, I would like to share an Ethereum analysis based on the daily (1D) chart for the first time in a while.
Before reading this post, please refer to the idea I uploaded on April 18, 2025, through the link below. It will help you better understand the context:
🔗
(Clicking the image will take you to the corresponding link.)
If you look at the April 18 idea, you’ll see that I presented a bullish outlook based on the Deep Crab pattern.
This analysis is a continuation of that idea.
Through years of research, I’ve observed that when a Deep Crab pattern sees a rebound from the PRZ (Potential Reversal Zone), the trend that begins from that point tends to extend for a long time.
If you look closely at the chart, you’ll also see the 2.24 Fibonacci extension level.
Some people messaged me saying, “Since it went above 1.902 and even exceeded the 2.0 Fibonacci line, isn’t this Deep Crab invalid?”
However, I’ve studied harmonic patterns in depth for a long time and have set my own Fibonacci criteria based on that research.
In this particular Deep Crab case, I define the invalidation level as 2.24.
Therefore, I judged that the pattern is still valid, and this allowed me to forecast a long-term bullish trend.
Back to the main point,
Based on this Deep Crab pattern, I’ve consistently maintained a bullish outlook on the daily chart,
and so far, there have been no clear signals indicating a reversal into a bearish trend.
Thus, I would like to post a continuation of the bullish outlook on the daily chart.
On May 19, 2025, there was a sharp drop around the 2,587 USDT level.
At that time, our team expected the bullish trend that started from around 2,447 USDT to hold its low and continue.
However, the price broke below 2,447 USDT and made a new low.
We then closely monitored Bitcoin’s movement in response.
Typically, strong volatility occurs before a major trend begins.
Bitcoin was also showing significant volatility at the time.
So we concluded: “Let’s maintain a bullish stance, but do not be fully convinced until the previous high of 2,587 USDT is clearly broken upward.”
And by the time this post is published, we’ve confirmed that the price has indeed broken above 2,587 USDT.
Therefore, I have come to the conclusion that the bullish trend is still valid.
Based on this, I present the following three target levels.
🎯 SeoVereign’s Ethereum Bullish Targets
1st Target: 3,000 USDT
2nd Target: 3,400 USDT
3rd Target: 3,700 USDT
The market still shows strong volatility.
I sincerely hope you all trade wisely and calmly, achieving great returns,
and may great fortune be with you both in trading and in life.
I’ll see you again in the next daily analysis.
Thank you.
- SeoVereign

Ethereum (ETH/USDT) 6H Chart Analysis – Key Resistance Test Ahea🔍 Ethereum (ETH/USDT) 6H Chart Analysis – Key Resistance Test Ahead 🚀🧱
📈 Market Overview:
Ethereum is currently trading at $2,492.38, showing signs of recovery as it approaches a key resistance zone. The price is consolidating within a tight horizontal range (highlighted in purple), indicating indecision before a potential breakout or rejection.
📌 Key Technical Highlights:
🔴 Resistance Zone:
Strong horizontal resistance at the $2,566 - $2,880 range (multiple red arrows).
Historical rejection levels suggest strong selling pressure at these zones.
🟪 Current Range:
Price is stuck in a consolidation box between $2,429 – $2,492, struggling to break above decisively.
This range is critical – a breakout could lead to a bullish rally; a rejection could see another retracement.
🟢 Support Levels:
EMA 200 (~$2,429) and horizontal support at $2,451 and $2,322 offer solid downside cushions (green arrows).
Further supports are visible at $2,195 and $2,116 if deeper correction occurs.
📉 EMA Confluence:
EMA 20/50/100/200 are tightening near the price – indicating a squeeze and likely volatility expansion ahead.
ETH is currently testing EMA 20 & 50 (~$2,451) from above – a bullish sign if it holds.
📊 Conclusion & Outlook:
🚦 Decision Point: ETH is at a critical level. A clean breakout above $2,500 and hold could trigger a move toward $2,566, followed by $2,680 and $2,783.
⚠️ However, failure to break above the current zone could result in a pullback toward $2,451 and below.
📍 Trader Tip: Watch for volume confirmation on breakout. A fakeout is possible due to the long consolidation.
💡 Sentiment: 🔄 Neutral to Slightly Bullish
🎯 Breakout Zone to Watch: $2,500+
🛡️ Key Support: $2,451 / $2,429
📉 Invalidation Level: Below $2,387

ETHEREUM Short Position Update – June 11, 2025We are the SeoVereign Trading Team.
With sharp insight and precise analysis, we regularly share trading ideas on Bitcoin and other major assets—always guided by structure, sentiment, and momentum.
🔔 Follow us to never miss a market update.
🚀 Boosts provide strong motivation and drive to the SeoVereign team.
--------------------------------------------------------------------------------------------------------
Ethereum downside perspective shared.
Recently, Ethereum has been continuously setting new highs, showing strong upward momentum. However, from a technical analysis standpoint, a breakdown below the lower trendline and an exit from a converging wedge pattern have been observed.
This suggests the potential for a short-term cooling-off phase, prompting the sharing of a bearish idea.
The first target is set at 2,771.
While Ethereum and the broader market continue to reach new highs, I personally believe a corrective phase may be approaching.
Detailed ratio analysis and further reasoning will be shared through an idea update once the first target is reached.
Flexible response according to market conditions is essential.

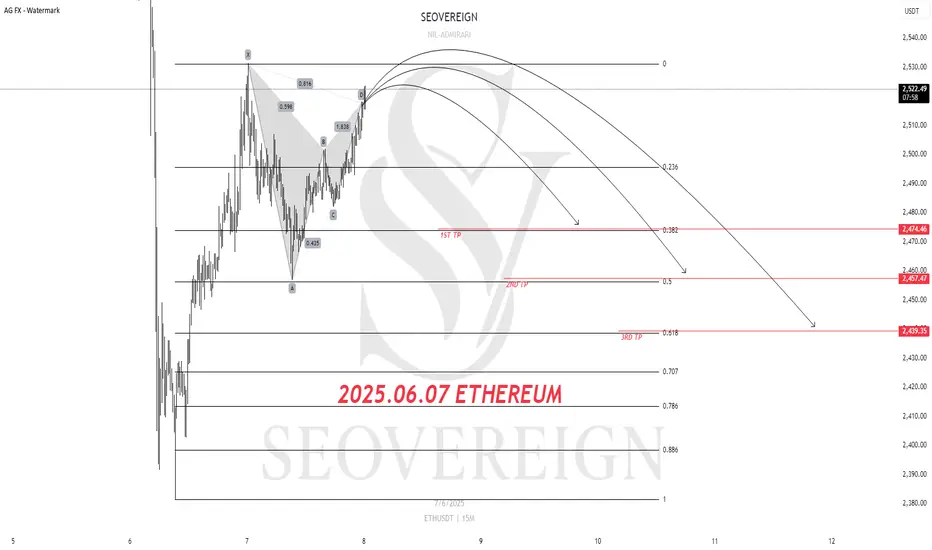
Ethereum Short Position Update – June 7, 2025We are the SeoVereign Trading Team.
With sharp insight and precise analysis, we regularly share trading ideas on Bitcoin and other major assets—always guided by structure, sentiment, and momentum.
🔔 Follow us to never miss a market update.
--------------------------------------------------------------------------------------------------------
Ethereum Short Position Share
Currently, Ethereum is approaching the completion zone of a Gartley pattern.
The Gartley pattern is one of the traditional corrective patterns and often acts as an important price reversal point.
In this pattern, the price is showing resistance near the high and signaling a reversal, indicating a high possibility of a shift into a short-term corrective phase.
Accordingly, a short position is considered with the first target set at $2,476.
This area corresponds to a previous support level and the pattern target, making it a technically significant selling target zone.
It is important to monitor market conditions and volume trends while managing risk simultaneously.
Ethereum (ETH) Chart Analysis ### Chart Overview:
This **Ethereum (ETH) chart price action** on a 1-hour timeframe with Heikin Ashi candles. Various indicators, such as volume, MACD, RSI, and custom elements like support, resistance, and divergence patterns, are used to enhance the analysis. The chart highlights a **double-bottom pattern**, volume trends, and bullish divergence.
### Key Chart Features and Pattern Observation:
1. **Double Bottom Pattern**:
- The chart identifies two significant "bottoms" (marked as Bottom 1 and Bottom 2) at support levels.
- This is a bullish reversal pattern, suggesting potential upward momentum.
2. **Support and Resistance**:
- Key support levels are visible at **$3,501.00** and **$3,516.00**.
- Resistance levels include **$4,018.50** and the target price at **$4,096.00**.
3. **Heikin Ashi Candles**:
- The current candles show a bullish trend with consecutive green candles following Bottom 2.
4. **ATR Trailing Stops**:
- Suggestive of a breakout above previous consolidation, supported by bullish momentum.
### Indicator Analysis:
1. **Volume**:
- Volume spiked significantly near Bottom 1, indicating strong buying activity at lower levels.
- Gradual increase in green volume bars signals growing bullish interest.
2. **MACD**:
- The MACD line has crossed above the signal line (bullish crossover) near Bottom 2.
- Histogram bars transitioning from negative to positive territory confirm increasing bullish momentum.
3. **RSI**:
- RSI shows a **bullish divergence** near Bottom 2, with price creating a lower low while RSI forms a higher low.
- The RSI value at 77.89 suggests the asset is entering overbought territory, signaling caution for new entries.
### Key Levels or Price Levels:
- **Support Levels**:
- $3,501.00 (strong support).
- $3,516.00 (intermediate support).
- **Resistance Levels**:
- $3,748.15 (intermediate resistance).
- $4,018.50 (major resistance).
- $4,096.00 (target level).
### Overall Summary:
The chart displays a bullish reversal setup with the double bottom pattern, confirmed by increasing volume and positive momentum in the MACD and RSI indicators. Price action above the resistance zone indicates a potential continuation toward the target level. However, the RSI nearing overbought territory suggests monitoring for potential pullbacks.
### Recommendation or Trading Strategy:
1. **For Long Positions**:
- Enter above $3,748.15 with a target at $4,018.50 and $4,096.00.
- Place a stop-loss below $3,516.00 to protect against downside risk.
2. **For Short Positions** (if price fails to sustain above resistance):
- Consider entering near $4,018.50 with a target back to $3,748.15 or lower.
- Tight stop-loss above $4,096.00 to limit losses.
3. **Additional Notes**:
- Monitor volume for confirmation of breakout or reversal.
- Consider partial profit booking as the price approaches $4,018.50.
### Conclusion:
Ethereum shows strong bullish momentum with the double bottom pattern, bullish divergence, and positive indicator confirmations. While the trend favors further upside, overbought RSI conditions caution against overextending positions. Traders should align entries and exit with key levels while managing risk through disciplined stop-loss placement.

Ethereum Struggles Near Key Support ZoneThe Ethereum (ETHUSDT) market is facing significant pressure as it trades within a defined consolidation zone near $3,081. Multiple attempts to break above the $3,215 resistance level have failed, signaling a potential shift in sentiment.
Technical Insights:
Resistance Challenges: The $3,215 level has repeatedly rejected price advances, forming a triple-top pattern that reinforces bearish sentiment.
Key Support Zone: The area between $3,023 and $3,081 is acting as crucial support. A breach of this zone could lead to further downside pressure.
Bearish Continuation: If the price fails to hold above the current support, Ethereum could target lower levels near $2,900, aligning with the broader bearish trend.
Outlook:
Traders should monitor price action closely within the support zone. A breakdown below this area could trigger aggressive selling, while a sustained move above $3,215 might suggest a bullish recovery. However, the prevailing trend remains bearish unless a strong reversal signal emerges.

Live : Ethereum (ETH/USDT) Levels for 11th October 2024Ethereum (ETH/USDT) Levels for 11th October 2024
The live chart for Ethereum shows significant price movement with strong support and resistance levels.
Resistance Levels (Red):
2,472.23
2,458.29
These levels indicate where selling pressure is expected. Ethereum has touched near these zones but struggled to break above, signaling resistance and potential selling interest.
Support Levels (Green):
2,395.55
2,379.18
These are the areas where buyers are stepping in, showing strong support. If the price falls near these levels, it is expected to see buying momentum kick in, preventing further decline.
Currently, Ethereum is trading at 2,441.66, with a significant upward move of +2.30%, showing bullish momentum. Traders should be cautious around the resistance levels and look for buying opportunities near the support zones for possible entries.

Ethereum is ready for a Positional Trade on Weekly tfHello Traders,
Get ready to play a positional trade in ethereum on weekly tf.
The correction was started from the levels of 4868 in Nov2021 and after 18 months of correction the ethereum is getting ready for an uptrend.
Let's understand the technical data
ema(20,50,200) - Buy
ema(100) will act as a Resistance1
Level 2023 will act as a Resistance2
Breakout of the channel line.
MACD - Bullish Crossover
- Histogram is building momentum
Bollinger Band - Squeezed
The price confirms the uptrend on the breakout of 2023 level (Resistance2)
The overall chart structure also shows the signals of an bull run.
Thanks and keep trading
Er. Simranjit Singh Virdi
