There is a Second Chance to Buy in ETHUSD ...New trading suggestion:
*The price is in an uptrend and we forecast the uptrend would continue.
* There is still a possibility of temporary retracement to suggested support line (496.730). if so, traders can set orders based on Price Action and expect to reach short-term targets.
Midterm forecast:
While the level 496.730 is not broken, the Midterm wave will be uptrend.
Technical analysis:
The RSI bounced from the support #1 at 30 and it prevented the price from more losses.
While the RSI downtrend #2 is not broken, bearish wave in price would continue.
Price is below WEMA21, if price rises more, this line can act as dynamic resistance against more gains.
Relative strength index (RSI) is 42.
Take Profits:
TP1= @ 475.300
TP2= @ 553.100
TP3= @ 630.500
TP4= @ 729.300
TP5= @ 864.550
TP6= @ 970.450
TP7= @ 1151.600
TP8= @ 1229.700
TP9= @ 1415.950
TP10= Free
Trade Setup:
We opened 10 BUY trade(s) @ 420.243 based on 'Hammer' entry method at 2018.04.11.
Total Profit: 1584266 pip
Closed trade(s): 707228 pip Profit
Open trade(s): 877038 pip Profit
Closed Profit:
TP1 @ 475.300 touched at 2018.04.12 with 55057 pip Profit.
TP2 @ 553.100 touched at 2018.04.19 with 132857 pip Profit.
TP3 @ 630.500 touched at 2018.04.22 with 210257 pip Profit.
TP4 @ 729.300 touched at 2018.05.03 with 309057 pip Profit.
55057 + 132857 + 210257 + 309057 = 707228 pip
Open Profit:
Profit for one trade is 566.416(current price) - 420.243(open price) = 146173 pip
6 trade(s) still open, therefore total profit for open trade(s) is 146173 x 6 = 877038 pip
Search in ideas for "ethereum"

There is a Second Chance to Buy in ETHUSD ...New trading suggestion:
*The price is in an uptrend and we forecast the uptrend would continue.
* There is still a possibility of temporary retracement to suggested support line (496.730). if so, traders can set orders based on Price Action and expect to reach short-term targets.
Midterm forecast:
While the level 496.730 is not broken, the Midterm wave will be uptrend.
Technical analysis:
The RSI bounced from the support #1 at 30 and it prevented price from more losses.
While the RSI downtrend #2 is not broken, bearish wave in price would continue.
Price is below WEMA21, if price rises more, this line can act as dynamic resistance against more gains.
Relative strength index (RSI) is 42.
Take Profits:
TP1= @ 475.300
TP2= @ 553.100
TP3= @ 630.500
TP4= @ 729.300
TP5= @ 864.550
TP6= @ 970.450
TP7= @ 1151.600
TP8= @ 1229.700
TP9= @ 1415.950
TP10= Free
Trade Setup:
We opened 10 BUY trade(s) @ 420.243 based on 'Hammer' entry method at 2018.04.11.
Total Profit: 1584266 pip
Closed trade(s): 707228 pip Profit
Open trade(s): 877038 pip Profit
Closed Profit:
TP1 @ 475.300 touched at 2018.04.12 with 55057 pip Profit.
TP2 @ 553.100 touched at 2018.04.19 with 132857 pip Profit.
TP3 @ 630.500 touched at 2018.04.22 with 210257 pip Profit.
TP4 @ 729.300 touched at 2018.05.03 with 309057 pip Profit.
55057 + 132857 + 210257 + 309057 = 707228 pip
Open Profit:
Profit for one trade is 566.416(current price) - 420.243(open price) = 146173 pip
6 trade(s) still open, therefore total profit for open trade(s) is 146173 x 6 = 877038 pip

A trading opportunity to buy in ETPETHTechnical analysis:
. ETP/Ethereum is in a range bound and the beginning of uptrend is expected.
. The price is below the 21-Day WEMA which acts as a dynamic resistance.
. The RSI is at 34.
. While the RSI downtrend and the price downtrend in the daily chart are not broken, bearish wave in price would continue.
Trading suggestion:
. There is a possibility of temporary retracement to suggested support zone (0.03182 to 0.02924). if so, traders can set orders based on Price Action and expect to reach short-term targets.
Beginning of entry zone (0.03182)
Ending of entry zone (0.02924)
Entry signal:
Signal to enter the market occurs when the price comes to " Buy zone " then forms one of the reversal patterns, whether " Bullish Engulfing ", " Hammer " or " Valley " in other words, NO entry signal when the price comes to the zone BUT after any of reversal patterns is formed in the zone. To learn more about " Entry signal " and the special version of our " Price Action " strategy FOLLOW our lessons :
Take Profits:
TP1= @ 0.034943
TP2= @ 0.037824
TP3= @ 0.040771
TP4= @ 0.044862
TP5= @ 0.050730
TP6= @ 0.063500
TP7= @ 0.088800
TP8= @ 0.109300
TP9= @ 0.129800
TP10= Free

There is a possibility for the beginning of an uptrend in ETCBTCTechnical analysis:
. EthereumClassic/Bitcoin is in a downtrend and the beginning of uptrend is expected.
. The price is below the 21-Day WEMA which acts as a dynamic resistance.
. The RSI is at 43.
. The the RSI downtrend is broken, so the probability of the resumption of an uptrend is increased.
Trading suggestion:
. There is a possibility of temporary retracement to suggested support zone (0.00148000 to 0.00138000). if so, traders can set orders based on Price Action and expect to reach short-term targets.
Beginning of entry zone (0.00148000)
Ending of entry zone (0.00138000)
Entry signal:
Signal to enter the market occurs when the price comes to " Buy zone " then forms one of the reversal patterns, whether " Bullish Engulfing ", " Hammer " or " Valley " in other words,
NO entry signal when the price comes to the zone BUT after any of the reversal patterns is formed in the zone.
To learn more about " Entry signal " and the special version of our " Price Action " strategy FOLLOW our lessons:
Take Profits:
TP1= @ 0.00164600
TP2= @ 0.00174200
TP3= @ 0.00182100
TP4= @ 0.00195600
TP5= @ 0.00214000
TP6= @ 0.00238200
TP7= @ 0.00277400
TP8= @ 0.00317100
TP9= @ 0.00388000
TP10= @ 0.00470000
TP11= @ 0.00560000
TP12= @ 0.00820000
TP13= Free

There is a trading opportunity to buy in ETCUSDTechnical analysis:
. ETHEREUMCLASSIC/DOLLAR is in a range bound and the beginning of uptrend is expected.
. The price is below the 21-Day WEMA which acts as a dynamic resistance.
. The RSI is at 42.
Trading suggestion:
. Price is in the support zone (14.0 to 12.0), traders can set orders based on Daily-Trading-Opportunities and expect to reach short-term targets.
Beginning of entry zone (14.0)
Ending of entry zone (12.0)
Entry signal:
Signal to enter the market occurs when the price comes to " Buy zone " then forms one of the reversal patterns, whether " Bullish Engulfing ", " Hammer " or " Valley " in other words,
NO entry signal when the price comes to the zone BUT after any of the reversal patterns is formed in the zone.
To learn more about " Entry signal " and the special version of our " Price Action " strategy FOLLOW our lessons:
Trade Setup:
We opened 9 BUY trade(s) @ 11.800 based on ' Hammer ' entry method at 08.14.2018.
Take Profits:
TP1= @ 17.0
TP2= @ 20.0
TP3= @ 23.0
TP4= @ 25.4
TP5= @ 29.9
TP6= @ 38.4
TP7= @ 42.9
TP8= @ 46.9
TP9= Free

Another trading opportunity to buy in ETCBTCTechnical analysis:
. ETHEREUMCLASSIC/BITCOIN is in a range bound and the beginning of uptrend is expected.
. The price is below the 21-Day WEMA which acts as a dynamic resistance.
. The RSI is at 37.
Trading suggestion:
. There is still a possibility of temporary retracement to suggested support zone (0.00211 to 0.00182). if so, traders can set orders based on Price Action and expect to reach short-term targets.
Beginning of entry zone (0.00211)
Ending of entry zone (0.00182)
Entry signal:
Signal to enter the market occurs when the price comes to "Buy zone" then forms one of the reversal patterns, whether "Bullish Engulfing" , "Hammer" or "Valley" in other words,
NO entry signal when the price comes to the zone BUT after any of the reversal patterns is formed in the zone.
To learn more about "Entry signal" and the special version of our "Price Action" strategy FOLLOW our lessons:
Trade Setup:
We opened 9 BUY trade(s) @ 0.00190000 based on ' Hammer ' entry method at 08.14.2018.
Take Profits:
TP1= @ 0.00240
TP2= @ 0.00280
TP3= @ 0.00324
TP4= @ 0.00350
TP5= @ 0.00470
TP6= @ 0.00560
TP7= @ 0.00820
TP8= @ 0.00951
TP9= Free

A trading opportunity to buy in ETCBTCTechnical analysis:
. ETHEREUMCLASSIC/BITCOIN is in a range bound and the beginning of uptrend is expected.
. The price is below the 21-Day WEMA which acts as a dynamic resistance.
. The RSI is at 37.
Trading suggestion:
. There is a possibility of temporary retracement to suggested support zone (0.00211 to 0.00182). if so, traders can set orders based on Price Action and expect to reach short-term targets.
Beginning of entry zone (0.00211)
Ending of entry zone (0.00182)
Entry signal:
Signal to enter the market occurs when the price comes to "Buy zone" then forms one of the reversal patterns, whether "Bullish Engulfing" , "Hammer" or "Valley" in other words,
NO entry signal when the price comes to the zone BUT after any of the reversal patterns is formed in the zone.
To learn more about "Entry signal" and the special version of our "Price Action" strategy FOLLOW our lessons:
Take Profits:
TP1= @ 0.00240
TP2= @ 0.00280
TP3= @ 0.00324
TP4= @ 0.00350
TP5= @ 0.00470
TP6= @ 0.00560
TP7= @ 0.00820
TP8= @ 0.00951
TP9= Free

There is a trading opportunity to buy in ETCUSDTechnical analysis:
. ETHEREUMCLASSIC/DOLLAR is in a range bound and the beginning of uptrend is expected.
. The price is below the 21-Day WEMA which acts as a dynamic resistance.
. The RSI is at 48.
Trading suggestion:
. The price is in a range bound and we forecast the uptrend would begin.
. There is a possibility of temporary retracement to suggested support zone (14.0 to 12.1). if so, traders can set orders based on Price Action and expect to reach short-term targets.
Beginning of entry zone (14.0)
Ending of entry zone (12.1)
Entry signal:
Signal to enter the market occurs when the price comes to "Buy zone" then forms one of the reversal patterns, whether "Bullish Engulfing" , "Hammer" or "Valley" in other words,
NO entry signal when the price comes to the zone BUT after any of reversal patterns is formed in the zone.
To learn more about "Entry signal" and the special version of our "Price Action" strategy FOLLOW our lessons:
Take Profits:
TP1= @ 17.0
TP2= @ 20.0
TP3= @ 23.0
TP4= @ 25.4
TP5= @ 29.9
TP6= @ 38.4
TP7= @ 42.9
TP8= @ 46.9
TP9= Free

There is a trading opportunity to buy in ETCBTCTechnical analysis:
. ETHEREUMCLASSIC/BITCOIN is in a range bound and beginning of uptrend is expected.
. The price is above the 21-Day WEMA which acts as a dynamic support.
. The RSI is at 63.
Trading suggestion:
. The price is in a range bound and we forecast the uptrend would begin.
. There is a possibility of temporary retracement to suggested support zone (0.00233 to 0.00182). if so, traders can set orders based on Price Action and expect to reach short-term targets.
Beginning of entry zone (0.00233)
Ending of entry zone (0.00182)
Entry signal:
Signal to enter the market occurs when the price comes to "Buy zone" then forms one of the reversal patterns, whether "Bullish Engulfing" , "Hammer" or "Valley" in other words,
NO entry signal when the price comes to the zone BUT after any of reversal patterns is formed in the zone.
To learn more about "Entry signal" and the special version of our "Price Action" strategy FOLLOW our lessons:
Take Profits:
TP1= @ 0.00282
TP2= @ 0.00324
TP3= @ 0.00350
TP4= @ 0.00470
TP5= @ 0.00560
TP6= @ 0.00820
TP7= @ 0.00951
TP8= Free

A Great Trading Opportunity to Buy in ETCBTC , Catch it....Technical analysis:
ETHEREUMCLASSIC/BITCOIN is in a range bound and Beginning of up trend is expected.
The price is above the 21-Day WEMA which acts as a dynamic support. The bullish exit in daily chart was occurred.
The RSI is at 51.
Trading suggestion:
*The price is in a range bound, but we forecast the uptrend would begin.
* Price is in the support zone (0.00233 to 0.00130), traders can set orders based on Daily-Trading-Opportunities and expect to reach short-term targets.
Beginning of entry zone (0.00233)
Ending of entry zone (0.00130)
Entry signal:
Signal to enter the market occurs when the price comes to "Buy zone" then forms one of the reversal patterns, whether "Bullish Engulfing" , "Hammer" or "Valley" , in other words,
NO entry signal when the price comes to the zone BUT after any of reversal patterns is formed in the zone.
To learn more about "Entry signal" and special version of our "Price Action" strategy FOLLOW our lessons:
Trade Setup:
We opened 6 SELL trade(s) @ 0.00204999 (day close price) based on 'Hammer' at 04.12.2018 signaled by our "Daily Trading Opportunity".
Total Profit: 170202 pip
Closed trade(s): 0 pip Profit
Open trade(s): 170202 pip Profit
Open Profit:
Profit for one trade is 0.00233366(current price) - 0.00204999(open price)= 28367 pip
9 trade(s) still open, therefore total profit for open trade(s) is 28367 x 6 = 170202 pip
Take Profits:
TP1= @ 0.0035
TP2= @ 0.0047
TP3= @ 0.0056
TP4= @ 0.0082
TP5= @ 0.0095
TP6= Free

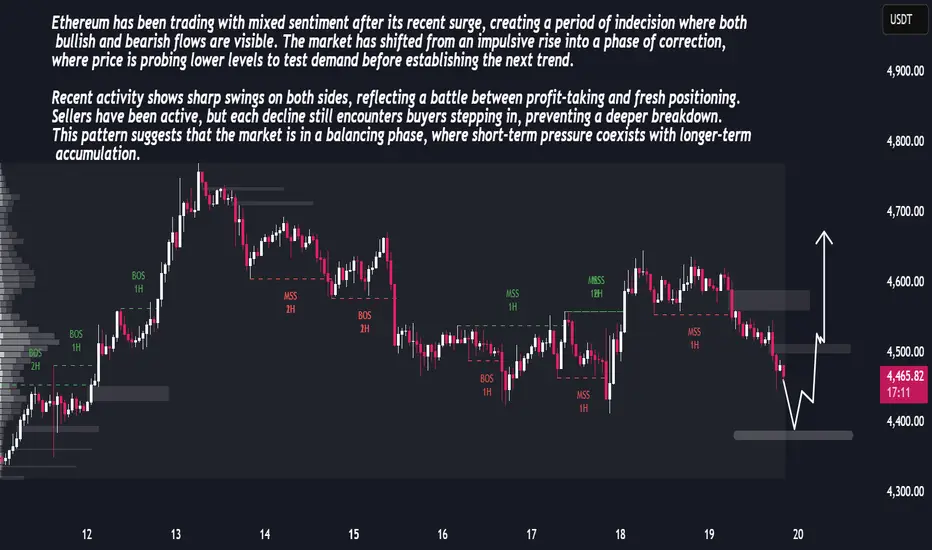
ETH Price Outlook – Consolidation Phase Before ExpansionETH Price Outlook – Consolidation Phase Before Expansion
Ethereum has been trading with mixed sentiment after its recent surge, creating a period of indecision where both bullish and bearish flows are visible. The market has shifted from an impulsive rise into a phase of correction, where price is probing lower levels to test demand before establishing the next trend.
Recent activity shows sharp swings on both sides, reflecting a battle between profit-taking and fresh positioning. Sellers have been active, but each decline still encounters buyers stepping in, preventing a deeper breakdown. This pattern suggests that the market is in a balancing phase, where short-term pressure coexists with longer-term accumulation.
The overall structure points toward a scenario where current weakness may serve as a preparation stage for another expansion move. Volatility is likely to remain elevated, and once liquidity pockets are cleared, momentum could shift more decisively, paving the way for stronger directional movement.
SOLANA AT FIVE: The High-Speed Blockchain Revolutionizing Crypto📢 SOLANA AT FIVE: The High-Speed Blockchain Revolutionizing Crypto Transactions
What is Solana?
#Solana is a high-performance blockchain designed for speed, scalability, and ultra-low fees. It supports DeFi, NFTs, and Web3 applications with an impressive 65,000 transactions per second (TPS) at almost zero cost!
📌 Founded by: Anatoly Yakovenko
📌 Launched in: March 2020
📌 Market Position: Among the Top 10 Crypto's
Top 3 Highlights of Solana
✅ Ultra-Fast Transactions: Solana’s unique PoH + PoS hybrid model enoS hybrid model ensures high-speed processing.
✅ Low Transaction Fees: Sub-penny costs make it more affordable than Ethereum.
✅ Growing Ecosystem: Used in DeFi, NFT marketplaces, and GameFi, attracting global investors and developers.
How Does Solana Work?
🔹 Proof of History (PoH): A cryptographic clock that timestamps transactions, reducing validation time.
🔹 Delegated Proof of Stake (dPoS): Users stake SOL tokens to secure the network and earn rewards.
🔹 Sealevel: Allows parallel smart contract execallel smart contract execution for improved efficiency.
🔹 Turbine & Gulf Stream: Optimized data transfer and transaction propagation.
Why Use Solana?
✔ Speed: 65,000 TPS vs. Ethereum’s 15 TPS
✔ Low Fees: $0.00025 per transaction
✔ Scalability: No need for Layer-2 solutions like Polygon or Arbitrum
✔ Eco-Friendly: Energy-efficient blockchain
✔ Developer-Friendly: Supports Rust & C++ SDKs
Solana vs Ethereum – Key Differences
▶️Feature | Solana | Ethereum
▶️TPS (Speed) | 65,000+ | ~15
▶️Transaction Fees | <$0.01 | $5-$50
▶️Consensus Mechanism | PoH + dPoS | PoS
▶️Smart Contracts | Rust, C++ | Solidity
▶️Scalability | Built-in (No L2 required) | Requires Layer-2
#Ethereum dominates DeFi & NFTs, but Soires Layer-2Ethereum dominates DeFi & NFTs, but Solana’s high-speed, low-cost model is attracting new projects & users.
Key Use Cases of Solana
🔹 Decentralized Finance (DeFi): Used in Serum, Raydium, Mango Markets
🔹 NFTs & Gaming: Magic Eden, Solanart, Star Atlas, Aurory leverage Solana’s low-cost transactions.
🔹 Smart Contracts & Web3: DAOs, Social Networks, Tokenization projects.
🔹 Crypto Payments: Solana Pay enableay enables instant, fee-less USDC payments, compe comp payments, competing with Visa.
Challenges of the Solana Network
⛔ Network Outages: Several disruptions in 2021-2024 raised concerns.
⛔ Centralization Risks: Fewer validators make it less decentralized than Ethereum.
⛔ Security Issues: Past incidents like the 2022 wallet exploit highlighted risks.
✅ Solution: Firedancer Client Upgrade is expected to enhance network stability.
Solana’s Recent Milestones & Price Performance
📌 2021: SOL hit $260 ATH in the bull run.
📌 2022: Dropped to $9 after FTX collapse.
📌 2023: Massive 1000% rebound, surpassing $100 again.
📌 2024: From $80 to $264 in one year. Visa integrates Solana for stablecoin payments.
📌 2025: New ATH of $295.83, then correction to $110. Over 105M active monthly users in January.
Is Solana a Good Investment?
✅ Pros:
✔ Strong Technical Foundation (PoH + PoS scal Foundation (PoH + PoS scalability)
✔ Growing Adoption & Developer Interest
✔ Institutional Support (Visa, Google Cloud)
✔Support (Visa, Google Cloud)
✔ Active & Expanding Community
❌ Cons:
⚠ Regulatory Uncertainty
⚠ Past Network Downtime Issues
⚠ Strong Competition from Ethereum & Other L1s
📢 Always do your own research before investing in any cryptocurrency.
Final Thoughts – The Future of Solana continues to push the boundaries of blockchain scalability with its ultra-fast transactions and low fees. With growing institutional adoption and ecosystem expansion, CRYPTOCAP:SOL has the potential to compete with Ethereum and beyond.

Whales Accumulating Ethereum : Can ETH Reclaim $3K in September?Whales Accumulating Ethereum : Can ETH Reclaim $3K in September?
The whales have accumulated nearly 0.5% of the supply in the last two weeks.
Ethereum may reclaim the psychological $3000 if it surpasses the higher range of consolidation over daily chart.
Ethereum has been hovering in a range bound zone for the last three weeks. The bulls and bears seemed to be in a tough fight near the psychological $2500 level. Recently, Ethereum bulls attempted for a breakout of the consolidation above $2800.
However, it failed due to the presence of strong bearish forces and the price loomed back towards the $2400 levels. At the time of writing, Ethereum was exchanging hands close to $2519 recording a positive gain of nearly 3.93% in intraday.
Whales Accumulating At The Lows: Analysts Say
Despite consolidation in Ethereum price near the $2500 for the last couple of weeks, the analysts have noted something cooking behind the curtains. The analysts have noticed a significant change in the whale holdings in the last couple of weeks while the price hasn't moved significantly.
As per the analysts, the top addresses often known as whales were holding nearly 43.5% of the total supply in mid August which now has surged to 44.01% indicating a significant 0.51% jump in just two weeks.
A significant jump in the whale holdings suggests whale accumulation at the lows while retailers seem to be in panic and liquidating their investments.
Moreover, as per the data obtained by an on-chain analytics website app.santiment.net a notable change was observed in the price DAA divergence indicator. The bearish divergence between the price and DAA (Daily active addresses) seemed to be decreasing, highlighting the waning interest of the sellers.
The price DAA divergence is an on-chain metrics which reflects the change in bearish or bullish divergence between the asset's price and daily active addresses. The decreasing bearish divergence indicates a potential buying in Ethereum in the upcoming sessions.
Ethereum May Reclaim $3000 level In September: Here’s How?
From a technical perspective, Ethereum price was hovering below the key exponential moving averages of 20, 50 and 200 days suggesting a bearish domination. However, the last couple of weeks saw a range bound movement in Ethereum.
On the higher side, the bears have established themselves firmly near $2800 level. On the contrary the bulls seem to be in domination near the $2350 level. Now a clear trend may be observed on the charts if the price breaks on either side.
Additionally, the on-chain metrics have indicated a possible breakout scenario which may validate on the charts of ETH price surpasses $2800 level. On a sustained breakout Ethereum may look to reclaim its presence near the psychological $3000 levels in September.
At the time of writing, the RSI line was placed close to 42 points and that of the 14 day SMA line was placed at 42.21 points. A bullish crossover between the RSI and SMA line suggests a potential bullish trend continuation.

Whales Moving Ethereum Off The Exchanges: A Bullish Wave On The Whales Moving Ethereum Off The Exchanges: A Bullish Wave On The Horizon?
The top 100 Wallets on exchanges have slumped to a 2018 low value of 8.41 Million ETH while the top 100 non exchange wallets have jumped to record high of 68.39 Million ETH.
Ethereum price made a bounce back after falling below the $3400 level and 50 day EMA.
The broader crypto markets including the market leaders Bitcoin and Ethereum, are experiencing a rollercoaster ride in the last couple of weeks. Ethereum price has witnessed a correction from $3900 level and has retraced the $3400 level. However the 50 day EMA seems to be acting as a dynamic support as the price has taken a bounce back.
Moreover, there has been a notable shift in the balance of top 100 exchange wallets which has dropped to a multi year low. while, the top 100 non exchange wallets have recorded an all time high holdings.
Whales Offloading Ethereum from Exchanges!
With the dramatic changes in the broader crypto markets these days, a notable shift in the on-chain metrics was observed. As per the data obtained from a financial website app.santiment.net, the holdings of the top 100 Ethereum wallets have dropped to a 2018 low value of 8.41 Million Ethereum.
🐳 The top 100 Ethereum wallets on exchanges recently fell below its May, 2018 all-time low, now at 8.41M total CRYPTOCAP:ETH . This is a sign of increasing distribution over time.Meanwhile, the top 100 non-exchange wallets tell the opposite story, holding an all-time high 68.39M CRYPTOCAP:ETH . pic.twitter.com/OS0t4ByaNQ— Santiment (@santimentfeed) June 14, 2024
On the contrary, the aggregate holdings of top 100 non exchange wallets have surged to a record high of 68.39 Million ETH. It indicates the shift of Ethereum from exchange wallets to non exchange wallets.
Typically, large-scale holders, often referred to as 'whales,' transfer their assets out of exchange wallets into other types of wallets when they do not foresee a significant market sell-off and prefer to retain their holdings for a certain duration. Such movements by whales withdrawing their holdings out of exchange wallets generally have a favorable effect on the market price
Is Ethereum Preparing For A Potential Rebound?
The Ethereum price has taken a rebound from the 50 day EMA indicating the presence of bulls near it. Whales are moving their holdings to non exchange wallets indicating their intention to hold it for a significant duration.
Moreover, The upcoming launch of Ethereum ETF could probably boost the demand which may help the ETH price to rise. The reduced supply on exchanges may further enhance the price.
As per the price action analysis, sustained move above the $3700 could mark the end of a correction and the Ethereum price may resume its journey towards the major $4000 level.
Conversely, the price might be at the risk of falling towards the $3300 until it is maintained below $3700 level.
Conclusion.
The broader crypto market including the major players Bitcoin and Ethereum has been highly volatile in the recent sessions. Ethereum price corrected from $3900 to $3400 however got support near the 50 day EMA suggesting bullish sentiment. Data from app.santiment.net shows a significant shift of Ethereum from exchange to non-exchange wallets thus decreasing the supply at the exchanges.
This move by whales implies a long-term holding strategy. The potential launch of an Ethereum ETF and reduced exchange supply could further drive up prices. ETH price recovery above $3700 may signal an end to the correction phase and a push towards $4000, while staying below $3700 risks a drop towards the $3300.
Disclaimer
The views and opinions stated by the author, or any people named in this article, are for informational purposes only and do not establish financial, investment, or other advice. Investing in or trading crypto or stock comes with a risk of financial loss.

#ETH/#BUSD Trading Plan 4-5 Feb 2022My view on Ethereum today is neutral however I am expecting it to give a good move on either side which I am sure would be caught by my syste. Here's what it looks like:
In this chart of Ethereum I have marked 4 price levels which have been determined based on a proprietary calculation that I have developed. The zone between the top-most and bottom-most price levels is a strict "No Trade Zone".
If Ethereum's price crosses the top-most price level, we will be looking for long opportunities and if Ethereum's price crosses the bottom-most price level, we will be looking for short opportunities.
Entry criteria:
Bullish case: Enter as soon as a 5-minute candle CLOSES above the top-most price level.
Bearish case: Enter as soon as a 5-minute candle CLOSES below the bottom-most price level.
Stop Loss criteria:
Risk: 2% of capital of per trade.
Bullish case: Just below the second price level from the top.
Bearish case: Just above the second price level from the bottom.
Take profit criteria:
I personally follow a system wherein I do nothing until 1:1 RR is achieved. But post 1:1 RR is achieved, I adjust stop loss to cost. I then exit 1/3rd of entered quantity based on 5 minute candle close below ( bullish case) or above ( bearish case) 15 EMA . I exit 1/3rd of entered quantity at fixed take-profit level of 1:3 RR. And I exit the final 1/3rd of entered quantity based on a system of setting stop losses that are dynamically adjusted to the nearest retracement after a Day High Breakout (in bullish case) or Day Low Breakout (in bearish case).
I have also experimented with systems wherein you can set take-profit at a fixed level of 1:3 RR or alternatively after 1:1 is achieved book full quantity vased on 5 minute candle close below ( bullish case) or above ( bearish case) 15 EMA . Both of these alternative systems have also been profitable.
Please note the given zones are valid only until the end of the day. Any open positions must be closed by 05:25 AM IST which is around when the day is about to end in the cryptocurrency markets.
Also please note: according to the rules of my system, I don't take more than 3 trades per day on any asset.

#ETH/#BUSD Trading Plan for 28 Jan 2022After yesterday's consolidation chances of a breakout are fair today. I'm not quite sure about the direction though. But does that matter? Not at all - because I have a system that helps me figure which direction to trade in. I don't have to be dependent on expectations and biases. Here's what it looks like:
In this chart of Ethereum I have marked 4 price levels which have been determined based on a proprietary calculation that I have developed. The zone between the top-most and bottom-most price levels is a strict "No Trade Zone".
If Ethereum's price crosses the top-most price level, we will be looking for long opportunities and if Ethereum's price crosses the bottom-most price level, we will be looking for short opportunities.
Entry criteria:
Bullish case: Enter as soon as a 5-minute candle CLOSES above the top-most price level.
Bearish case: Enter as soon as a 5-minute candle CLOSES below the bottom-most price level.
Stop Loss criteria:
Risk: 2% of capital of per trade.
Bullish case: Just below the second price level from the top.
Bearish case: Just above the second price level from the bottom.
Take profit criteria:
I personally follow a system wherein I do nothing until 1:1 RR is achieved. But post 1:1 RR is achieved, I adjust stop loss to cost. I then exit 1/3rd of entered quantity based on 5 minute candle close below ( bullish case) or above ( bearish case) 15 EMA . I exit 1/3rd of entered quantity at fixed take-profit level of 1:3 RR. And I exit the final 1/3rd of entered quantity based on a system of setting stop losses that are dynamically adjusted to the nearest retracement after a Day High Breakout (in bullish case) or Day Low Breakout (in bearish case).
I have also experimented with systems wherein you can set take-profit at a fixed level of 1:3 RR or alternatively after 1:1 is achieved book full quantity vased on 5 minute candle close below ( bullish case) or above ( bearish case) 15 EMA . Both of these alternative systems have also been profitable.
Please note the given zones are valid only until the end of the day. Any open positions must be closed by 05:25 AM IST which is around when the day is about to end in the cryptocurrency markets.
Also please note: according to the rules of my system, I don't take more than 3 trades per day on any asset.

Ether Takes The Lead | Will Ethereum and Bitcoin Detach?Hardly ever I look at the Ethereum (ETHUSD) chart since both Bitcoin and Ethereum tend to move together.
Whatever I see happening with Bitcoin normally is also true for Ethereum.
For example, notice the bullish wave from July 21 to August 23, exactly the same for BTCUSD and ETHUSD.
Things are different right now.
Ether (ETH) just moved ahead of Bitcoin and went on to hit a new high today... This is great news. While Bitcoin is still strong but showing some bearish signals.
How to read this signal in comparison to Bitcoin?
In the past I used to use Ethereum to predict the next Bitcoin move as it was ahead by a few days or hours, the signals tend to be easier to read.
Seeing Ethereum move ahead, can signal that Bitcoin will eliminate all bearish signals and continue to grow (bullish/green) next.
Another scenario is where Bitcoin and Ethereum detach from each other.
Ethereum has all the Apps, NFTs and smart-contracts going on... With the cryptocurrency market evolving so much and so strong, the King and Queen of crypto detaching is something hard but can definitely happen.
Personally I believe if ETHUSD is to move straight up and go ahead, I think that Bitcoin will follow instead of detaching...
A bullish Ethereum, bullish Bitcoin as well.
And vice versa.
We are looking for Ethereum to hit $6,000 but it can take a while...
I just saw this now...
The Altcoins (in general) are behaving strongly as well.
If this (ETHUSD going up while BTCUSD hits lower highs) goes on for more than today, I will update my view on Bitcoin taking this information into consideration and tell you what I see coming next.
Make sure to hit LIKE now if you want to stay updated.
Thanks a lot for your support.
Namaste.

💡Don't miss the great buy opportunity in ETHBTCTrading suggestion:
". There is a possibility of temporary retracement to suggested support line (0.034900).
. if so, traders can set orders based on Price Action and expect to reach short-term targets."
Technical analysis:
. Ethereum / Bitcoin is in a range bound and the beginning of uptrend is expected.
. The price is below the 21-Day WEMA which acts as a dynamic resistance.
. The RSI is at 52.
Take Profits:
TP1= @ 0.0390
TP2= @ 0.0405
TP3= @ 0.0430
TP4= @ 0.0460
TP5= @ 0.0500
TP6= @ 0.0540
SL= Break below S2
❤️ If you find this helpful and want more FREE forecasts in TradingView
. . . . . Please show your support back,
. . . . . . . . Hit the 👍 LIKE button,
. . . . . . . . . . Drop some feedback below in the comment!
❤️ Your Support is very much 🙏 appreciated! ❤️
💎 Want us to help you become a better Forex trader ?
Now, It's your turn !
Be sure to leave a comment let us know how you see this opportunity and forecast.
Trade well, ❤️
ForecastCity English Support Team ❤️


ETH Price Primed for 6x Surge! Analyst Hints $2 Trillion Market Lark Davis, a prominent New Zealand-based crypto analyst, recently hinted at a huge 6x price increase for ETH Price from its current value. According to him, the market cap of ETH is growing at an unstoppable rate, and considering the success and development of the Defi business, the bulls seem to be on the side of the second largest coin. ETH has also jumped because of the significantly strong demand from institutional investors.
Ethereum Market Cap Poised for Massive Surge
According to CoinMarketCap, Ethereum’s market cap of $2 trillion reflects a roughly 550% increase from its current $309 billion valuation.
Ethereum seems to be reviving and may as well explode in the near future.
Source : Coinpedia

renderwithme | ETH Price Prediction for next six Months 2025
Price Prediction for next six Months 2025
Price Range: Based on various forecasts, Ethereum (ETH) is expected to trade between approximately $2,500 and $3,360 in August 2025. The minimum price could be around $2,519.80, with a potential peak of $3,360.36. The average trading price is projected to be around $2,800–$3,100.
Bullish Scenario: If bullish momentum continues, driven by factors like institutional inflows or positive network developments, ETH could test the $3,150–$3,300 range or even approach $3,500 by late August. A breakout and close above $3,100 could trigger a rally toward $3,550–$3,800.
Bearish Scenario: If market sentiment turns negative, due to macroeconomic uncertainties or regulatory pressures, ETH could dip to $2,470–$2,500, with a potential further decline to $2,400 if support levels fail.
~~ Disclaimer ~~
This analysis is based on recent technical data and market sentiment from web sources. It is for informational \ educational purposes only and not financial advice. Trading involves high risks, and past performance does not guarantee future results. Always conduct your own research or consult a SEBI-registered advisor before trading.
# Boost and comment will be highly appreciated.
💡Don't miss the great buy opportunity in Ethereum/TetherTrading suggestion:
". There is a possibility of temporary retracement to suggested support line (614).
. if so, traders can set orders based on Price Action and expect to reach short-term targets."
Technical analysis:
. ETHUSDT is in a range bound and the beginning of uptrend is expected.
. The price is above the 21-Day WEMA which acts as a dynamic support.
. The RSI is at 67.
Take Profits:
TP1= @ 634
TP2= @ 653
TP3= @ 676
TP4= @ 700
TP5= @ 735
SL= Break below S2
❤️ If you find this helpful and want more FREE forecasts in TradingView
. . . . . Please show your support back,
. . . . . . . . Hit the 👍 LIKE button,
. . . . . . . . . . Drop some feedback below in the comment!
❤️ Your Support is very much 🙏 appreciated! ❤️
💎 Want us to help you become a better Forex trader ?
Now, It's your turn !
Be sure to leave a comment let us know how you see this opportunity and forecast.
Trade well, ❤️
ForecastCity English Support Team ❤️

Psychological Roadmap for EthereumRather than the usual use of indicators, I've decided to explain the psychological pattern clearly visible in Ethereum. On the daily charts, we can see Ethereum had some incredibly robust growth, but has been in a bearish state off late, along with the rest of the cryptocurrency market. We observe as the trendlines get more vertically steeper (bullish) and upward facing parallel channels envelop, the bull run start on its momentum. In previous bull runs, Ether always came back and made a slight touch of its bottom trend line. The current trend of Ethereum shows that it is finally about to make its touch of the long term support. This is a MAJOR happening as it means that the breakout is on its way. It looks like in a couple days the whole crypto market is going to boom. While it is a bold prediction, I certainly see this happening. Do not be fooled by short duration trends and charts.
