Simple Linear Chart $ETH TO THE MOONI presents her the next cycle for #ethereum #ETH. The LONG 3300 days cycle.
Simple hold. next cycle will based on DEFI (decentralize finance).
Search in ideas for "ethereum"

💡 Don't miss the great buy opportunity in ETCUSDTTrading suggestion:
. There is a possibility of temporary retracement to suggested support line (13.9). if so, traders can set orders based on Price Action and expect to reach short-term targets.
Technical analysis:
. Ethereum Classic ETCUSDT is in a range bound and the beginning of uptrend is expected.
.The price is above the 21-Day WEMA which acts as a dynamic support.
. The RSI is at 41.
Take Profits:
TP1= @ 16.00
TP2= @ 16.90
TP3= @ 18.10
TP4= @ 20.20
TP5= @ 22.00
TP6= @ 24.15
SL= Break below S2
❤️ If you find this helpful and want more FREE forecasts in TradingView
. . . . . Please show your support back,
. . . . . . . . Hit the 👍 LIKE button,
. . . . . . . . . . . Drop some feedback below in the comment!
❤️ Your Support is very much 🙏 appreciated! ❤️
💎 Want us to help you become a better Forex trader ?
Now, It's your turn !
Be sure to leave a comment let us know how do you see this opportunity and forecast.
Trade well, ❤️
ForecastCity English Support Team ❤️

There is a possibility for the beginning of uptrend in ZECETHTechnical analysis:
. ZCASH/ETHEREUM is in a range bound and the beginning of uptrend is expected.
. The price is below the 21-Day WEMA which acts as a dynamic resistance.
. The RSI is at 44.
. While the price downtrend in the Daily chart is not broken, bearish wave in price would continue.
Trading suggestion:
. There is a possibility of temporary retracement to suggested support zone (0.362 to 0.329). if so, traders can set orders based on Price Action and expect to reach short-term targets.
Beginning of entry zone (0.362)
Ending of entry zone (0.329)
Entry signal:
Signal to enter the market occurs when the price comes to "Buy zone" then forms one of the reversal patterns, whether "Bullish Engulfing" , "Hammer" or "Valley" in other words,
NO entry signal when the price comes to the zone BUT after any of reversal patterns is formed in the zone.
To learn more about "Entry signal" and the special version of our "Price Action" strategy FOLLOW our lessons:
Take Profits:
TP1= @ 0.435
TP2= @ 0.518
TP3= @ 0.565
TP4= @ 0.710
TP5= @ 0.828
TP6= @ 0.946
TP7= @ 1.049
TP8= @ 1.252
TP9= Free

[SeoVereign] ETHEREUM BEARISH Outlook – August 10, 2025In this idea, I would like to present a bearish perspective on Ethereum.
This perspective was derived based on the Elliott Wave Theory.
Until this pattern is confirmed, I have been continuously tracking the Elliott Waves and adding reasons for the bearish scenario one by one.
As a result, I have concluded that the next major move is likely to be downward, and while searching for a specific entry point, I detected the recent trendline break.
If this wave is clearly confirmed, I believe there is a high possibility of a decline to around the average take-profit level of 3763 USDT without much difficulty, and therefore, I am considering entering a short position.
All the details have been drawn on the chart, so please refer to it.
Thank you very much for reading, and as time goes by and the chart becomes clearer, I will continue to update this idea accordingly.
Thank you.

$ETH IS FLIRTING WITH A MASSIVE BREAKOUTCRYPTOCAP:ETH IS FLIRTING WITH A MASSIVE BREAKOUT
Price is hovering just below the HIGH LIQUIDITY ZONE at $2,867 — a major inflection point!
✅ Break above… We could see a parabolic push toward ATHs.
❌ Rejection = A sharp correction might hit hard.
It’s make or break time for Ethereum.
What’s your plan if this breaks?
NFA & DYOR

Bitcoin Dominance 1D Setup - Bitcoin D is currently trading at 58.26%
- Bitcoin D is going to be the biggest indicator to track when Alts will bounce
- Bitcoin D has changed its market structure and can soon shift its bias to bearish once we see a weekly close below 56.18%
- 90% of altcoins are struggling to make a comeback and stay strong for long as BTC D and Bitcoin is outperforming ETH since quite long
- One thing to notice for all Trader/Investors is going to be ETH/BTC pair, ETH/BTC on a weekly TF has already bottomed out and it has recently reacted strong and at the same time TRUMP's inaugural is tomorrow where we can see that Trump has added ETH worth 5Million $
- Ethereum is going to be the biggest indicator clubbed with ETH/BTC USDT D once these start outperforming and USDT D underperforming ETH will print 50-60% and maybe purge a new high and that will lead to an altcoins rally

Buying interest in Ethereum at key MA20 months moving average is coinciding with level where serious buying is witnessed in Ethereum.
Considering long-term monthly chart Log scale is used and targets and SL are marked on chart.
If buy triggers, it can take 8 to 15 months to achieve this target.

scenarios for Ethereumheres what my opinion on ethereum.
three scenarious building Up. i would suggest to have patience.

ANALYSIS FOR ETH FIRST SHORT THEN LONG 10 days view for ethereum.
Must all things remain normal becuase the crypto industry reacts heavily n news the following scence will happen if every things go well.
Risk is involved so be careful.

Possible trendline breakout in Ethereum.One can go long on ethereum after the price breaks the trend line. But one should wait for a pull back and when the price shows green after the pull back it would be wise to go long.

ETHFI Buy Trade Idea: Leveraging Ethereum's Finance Ecosystem
ETHFI (Ethereum Finance) offers a promising buy opportunity anchored by the robust fundamentals of Ethereum's decentralized finance (DeFi) ecosystem. As a prominent player within the Ethereum network, ETHFI benefits from Ethereum's unparalleled smart contract capabilities, extensive developer community, and widespread adoption. Ethereum's transition to a proof-of-stake (PoS) consensus mechanism further enhances its scalability and energy efficiency, potentially driving higher transaction throughput and reduced costs. The platform's integration with various DeFi protocols and applications positions ETHFI to capitalize on the growing demand for decentralized financial services, making it a strategic investment in the evolving blockchain landscape.
Disclaimer
Trading and investing in cryptocurrencies involve significant risks and can result in substantial losses. The content provided here is for informational purposes only and should not be considered financial advice. Always conduct your own research, consider your risk tolerance, and consult with a financial advisor before making any investment decisions. Past performance is not indicative of future results, and the value of investments can fluctuate widely.

Can Ethereum ETF Bring Optimism In The Price?Can Ethereum ETF Bring Optimism In The Price?
In the present scenario, the Ethereum price is witnessing a strong selloff in Intraday, as it has distanced itself from the $3200 level. The crypto is headed to test the rebound level of $3000, dropping more than 5% in Intraday.
The daily chart shows a breakdown of a bearish flag pattern and a rejection from the 50-day exponential moving average. While the $3000 may act as a psychological level and bring some stability, further downside movement cannot be ruled out.
However, recent developments and updates point towards a potentially bright future for Ethereum, which could bring back the optimistic days.
The most recent news that could relieve Investors is about the commencement of Bitcoin and Ethereum ETFs in Hong Kong. This news is a reason for celebration for Hong Kong investors. There is optimism that these ETFs might exceed the $125 million US Bitcoin ETF launch. It might bring back the reversal in Ethereum and the crypto may perform in the next month.

ETH/USD Forecast: Buyers Step in to Lift Ethereum AgainFor Ethereum to thrive, there must be a willingness among investors to engage with the crypto markets and their associated ecosystems, a trend that seems poised to gain momentum in 2024.
Ethereum experienced a downturn in the early hours of Tuesday, further underscoring the prevailing volatility in this market.
In the grander scheme of things, Ethereum appears poised to gain more momentum.
However, the current situation can be attributed to the rapid ascent it recently enjoyed, combined with the fact that we are navigating the period between Christmas and New Year's Day, a time when market liquidity tends to dwindle.
Major Support Level Below
A crucial level to watch is the $2100 mark, which should serve as a significant support zone. This level has not only provided support in the past but has also demonstrated resistance to buying pressure. Market participants are likely to bear in mind this historical significance, potentially presenting an attractive opportunity for value-oriented investors. On the upside, the $2500 level looms large, and a successful breach of this level could pave the way for a move toward the $3000 mark. Over the longer term, there is potential for Ethereum to reach the $3500 level. However, the immediate future is likely to be marked by choppy, back-and-forth price movements.
In terms of strategy, a prudent approach would involve buying the dips, but doing so incrementally rather than diving headfirst into the market. The next few sessions could be characterized by unusual price movements, making it essential to exercise caution. Nevertheless, Ethereum appears to have a bullish outlook in the long run, especially as interest rates in the United States continue to decline. This decline in interest rates has historically been favorable for the broader cryptocurrency market. As traders become more willing to embrace risk, Ethereum stands to benefit. Ethereum holds a unique position within the market as the foundation for numerous tokens and ecosystems built upon its platform. For Ethereum to thrive, there must be a willingness among investors to engage with the crypto markets and their associated ecosystems, a trend that seems poised to gain momentum in 2024.
As Ethereum charts its course into 2024, investors and traders should remain vigilant, closely monitoring key support and resistance levels underneath, and adopting a measured approach to capitalize on potential opportunities in this market, as the buyers will be under current levels to continue to lift ETH to higher levels, as the “cheap money” coming from the Federal Reserve will continue to be a major influence on not only the Ethereum market but also other cryptocurrencies.

ETHUSDT Bearish View and downtrendA bearish view on ETHUSDT (Ethereum/Tether) suggests that the price of Ethereum is expected to decline against Tether or the US dollar. Here are some possible reasons for a bearish outlook:
Market Sentiment: If there is a general pessimism or negative sentiment in the cryptocurrency market, it could impact the price of ETHUSDT. Factors such as regulatory concerns, market corrections, or overall market downtrends can contribute to bearish sentiment.
Technical Analysis: By analyzing historical price data, patterns, and indicators, technical analysts may identify signals that indicate a potential downtrend. Bearish chart patterns, such as head and shoulders, double tops, or descending triangles, could suggest a forthcoming price decline.
Fundamentals: Negative developments in the fundamental aspects of Ethereum could influence a bearish view. This might include issues like scalability challenges, security vulnerabilities, or concerns regarding the adoption and usage of the Ethereum network.
Competition: Ethereum faces competition from other blockchain platforms, such as Binance Smart Chain, Solana, or Polkadot. If these platforms gain traction and attract users and developers away from Ethereum, it could impact the price negatively.
Regulatory Environment: Regulatory actions or uncertainties surrounding cryptocurrencies can significantly impact their prices. If there are restrictive regulations or crackdowns on cryptocurrencies in general or on Ethereum specifically, it could create a bearish sentiment.
Market Manipulation: Cryptocurrency markets are susceptible to manipulation due to their relatively low liquidity compared to traditional financial markets. Price manipulation schemes, such as pump-and-dump schemes or coordinated selling, could artificially drive down the price of ETHUSDT.
Remember that cryptocurrency markets are highly volatile and subject to various factors that can rapidly change the market sentiment. It's crucial to conduct thorough research and analysis before making any investment decisions.

ETH/USD Latest Analysis
#1 Key Highlights
* Support around $100+ level held strongly.\u2028
* 200H-MA(moving average) broken with buying volume.\u2028
* Ethereum(ETH/USD) price surged 20%+.\u2028
* $120+ resistance broken and retested.\u2028
#2 Chart Analysis
Ethereum trading $122+(Bitfinex) and showing signs of strong upward momentum.
Looking at the ethereum trends on Hourly(4H) chart timeframe, we can observe few bullish signs.It has broken short-term downtrend line(red) as well as 200H-Moving Average which was acting as strong resistance as stated in the article published last week.
If we look at the ethereum price analysis today on hourly time-frame(4H), it has penetrated through the Ichimoku cloud and needs to hold above cloud for further bullish momentum.Though Stoch-RSI indicator is in the oversold region(bullish) , MACD indicator is entering into the bearish territory.
Looking at the ethereum technical analysis today, It needs to hold the present level to test(touch) the immediate resistance(Red) around $140+ price level.Also, there is a possibility of a S/R flip at the current level but if it doesn't happen then we might see the $113-$110 price level as there is not upcoming ethereum news to act as a catalyst.
#3 Conclusion
Over the past 2 days, Ethereum (ETH/USD) has managed to move 20%+ while the entire crypto market remains in the strong momentum. Ethereum price analysis 2019 states it needs to undergo a corrective rally before continuing the bullish momentum.

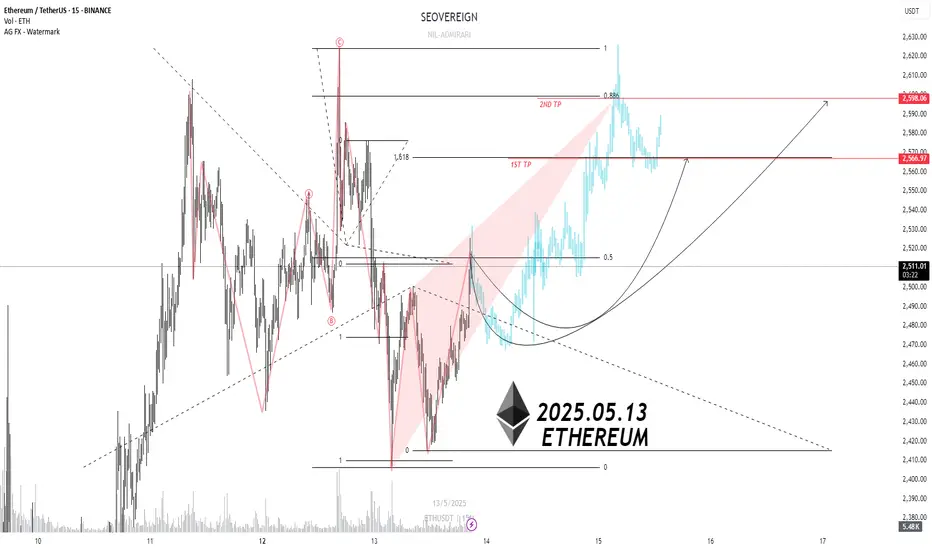
2025.05.23 ETHEREUM Short-term long positionWe are the SeoVereign Trading Team.
With sharp insight and precise analysis, we regularly share trading ideas on Bitcoin and other major assets—always guided by structure, sentiment, and momentum.
🔔 Follow us to never miss a market update.
📈
Currently, Ethereum appears to have entered a short-term buying strategy zone based on the main long scenario. Starting from the Butterfly Pattern, the trend has shifted upward and is maintaining its bullish momentum.
According to technical analysis, the short-term targets are as follows:
1st Target: 2,713
2nd Target: 2,815
3rd Target: 2,900
This zone is considered a continuation phase of the upward trend, and strong momentum has been confirmed following the breakout of the PRZ (Potential Reversal Zone) of the pattern. However, due to the high volatility in the current market, strict risk management and a scaled approach are essential.
📌 Strategy Summary:
Long entries are recommended after a trigger occurs
Quick response required if key support zones are breached
Short-term profit-taking zones are based on the targets above
This scenario reflects a short-term strategy aligned with the main long perspective, and adjustments may be necessary if structural changes occur.
Stay flexible and responsive to market movements.

2025.05.18 ETHEREUM Short-term long positionWe are the SeoVereign Trading Team.
With sharp insight and precise analysis, we regularly share trading ideas on Bitcoin and other major assets—always guided by structure, sentiment, and momentum.
🔔 Follow us to never miss a market update.
📈 Ethereum (ETH) Long Position Outlook
Ethereum is currently one of the most difficult assets to predict in terms of direction.
Recently, it has shown frequent irregular movements, which—while unpredictable—can be attractive from a short-term trading perspective due to the increased volatility.
From a technical standpoint, Ethereum appears to have completed its B wave.
When measuring the 5-wave structure using trend-based Fibonacci extension, the B wave concludes near the 0.786 level.
This 0.786 extension is a custom wave ratio developed by the Seovereign team and has shown strong reliability in live trading scenarios.
To avoid visual clutter on the chart, we have chosen to highlight only the most important 0.786 level in this analysis.
All detailed wave counts and ratios have been marked on the chart, so feel free to refer to them for more specifics.
🎯 Target Levels
1st Target: 2,555
2nd Target: 2,589
3rd Target: 2,624
Due to the high volatility, the potential for opportunity is also high—but proper risk management remains essential.
This zone is considered a technically valid entry point for a long position.
Approach the market with flexibility and strategic focus.

Is Now the Time for Ethereum to Be Re-evaluated?We are the SeoVereign Trading Team.
With sharp insight and precise analysis, we regularly share trading ideas on Bitcoin and other major assets—always guided by structure, sentiment, and momentum.
🔔 Follow us to never miss a market update.
🔥 As Bitcoin reclaims the 100K narrative, Ethereum is waking up.
In the wake of Bitcoin’s bullish momentum, Ethereum is flashing strong reversal signals.
After a prolonged period of undervaluation and market hesitation, it’s finally time for ETH to be re-evaluated for what it’s truly worth.
At SeoVereign, we’re positioning strategically long on Ethereum, aligning with both technical setups and market sentiment.
This isn't just a short-term bounce—it's potentially the start of a mid-term trend reversal.
🎯 Target 1: 2,566 — Breaking near-term resistance
🎯 Target 2: 2,598 — Key mid-structure objective
📊 Right now, the market is split between the hesitant and the proactive.
We're choosing to be ahead of the curve.
🚀 The SeoVereign Team is here to catch this wave—
Now is the time to ride the ETH long setup.
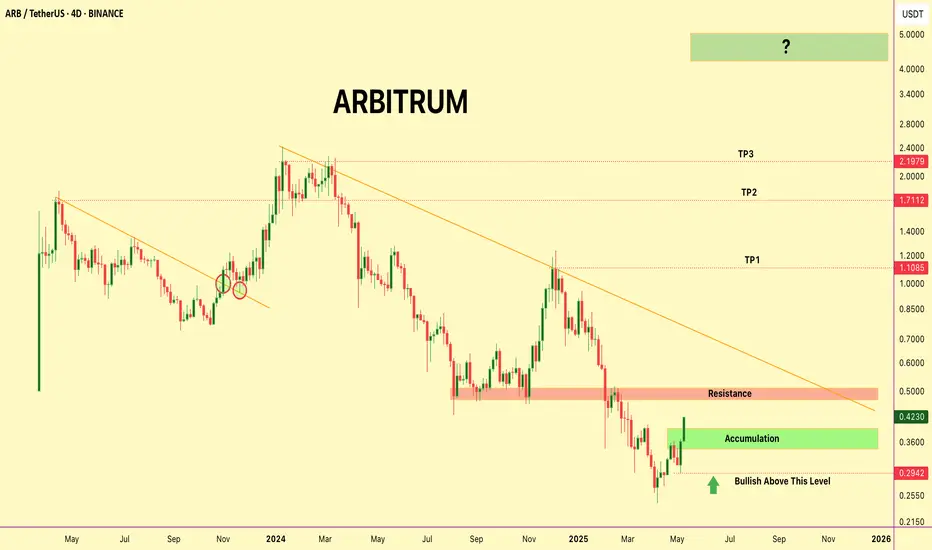
The Next Big L2 Gem? $ARB Is Breaking Out —Why It Could it 10x🚨 The Next Big L2 Gem? AMEX:ARB Is Breaking Out — Here's Why It Could 10x+ 🚨
🔰 What is Arbitrum?
Arbitrum is Ethereum’s top Layer-2 scaling solution using Optimistic Rollups.
It powers faster, cheaper transactions without compromising security.
🔰 Ecosystem Highlights
▶️ Arbitrum One – DeFi & dApps
▶️ Arbitrum Nova – Gaming & Social apps
▶️ Hosts major projects: Uniswap, Aave, GMX
▶️ Among the top L2s by TVL dominance
🔰 Tech & Innovation
▶️ Runs on fraud-proof optimistic rollups
▶️ Nitro upgrade boosted throughput + cut gas fees
▶️ Gives near-Ethereum experience with 10x lower costs
🔰 Tokenomics
▶️ Total Supply: 10B ARB
▶️ Airdrop: 1.162B (11.6%) to users & DAOs
▶️ Remaining: Treasury + future ecosystem rewards
➡️ Small circulating supply = potential supply squeeze on demand surge
🔰 Backers & Partnerships
▶️ Built by Offchain Labs
▶️ Investors: Lightspeed, Pantera, Coinbase Ventures
▶️ Listed on Binance, Coinbase, KuCoin
▶️ Integrated by top Ethereum protocols (Uniswap, etc.)
🔰 TECHNICAL BREAKDOWN: ARB/USDT HTF Chart
✅ Accumulation Zone: $0.29–$0.42
▶️ Above $0.4028 = momentum shift zone into Super Bullish
▶️ Next resistance: $0.48–$0.52 (watch for breakout!)
▶️ Targets: $1.10 / $1.71 / $2.19 / $5
⚠️ Hold above $0.2942 to keep setup valid
✅ Strong volume + higher lows = bullish confirmation
▶️ DYOR | NFA
🔰 Why 10x–50x Is Possible
▶️ Top Ethereum L2 by usage
▶️ Real utility, not meme hype
▶️ Limited unlocked supply = buyer advantage
▶️ L2 sector will explode if ETH demand grows
▶️ Could capture a huge chunk of ETH's scaling market
🔰 Final Take
▶️ AMEX:ARB is more than hype — it's infrastructure.
▶️ In a bull market, this is the kind of setup that runs hard.
▶️ Keep it tight on your watchlist.
The Power of My Price Action Strategy: Ethereum Targets HitThe Power of My Price Action Strategy: Ethereum Targets Hit
Today, Ethereum showcased the effectiveness of my price action strategy. The day started with a strong buying trade, as the price showed clear signals of upward momentum from a key support level. As the market gained strength, the buying trade played out perfectly, yielding solid gains. Later, as selling pressure increased at the peak, it presented a high-probability selling trade. The market reversed swiftly, hitting targets on the downside. This seamless execution of both buying and selling trades highlights the reliability of my strategy, allowing me to profit from market moves in both directions.

Neiro Ethereum (NEIRO) Tp1 min 60%Neiro on Ethereum (NEIROETH):
Capitalization: $90 million.
Listed on Binance Futures.
Contract: 0xee2a03aa6dacf51c18679c516ad5283d8e7c2637.
First Neiro on Ethereum (NEIRO):
Capitalization: $470 million.
Listed on Binance Spot.
Contract: 0x812ba41e071c7b7fa4ebcfb62df5f45f6fa853ee.

Neiro Ethereum (NEIRO) Neiro Ethereum (NEIRO)
Neiro Ethereum emerged as the top memecoin performer in August adding an impressive 771% to the portfolio of their investors. As per coinmarketcap.com, NEIRO was down nearly 10.1% a day and was exchanging hands close to $0.120.
Neiro Ethereum offers zero buy/sell tax and no team tokens, indicating a community driven approach. It aims to present itself as one of the top meme coins just like Dogecoin. It has a live market capitalization of $120.55 Million and ranks 300th in the cryptoverse.
Moreover, the daily transaction volume has dropped by 6% to $21.77 Million a day. The price action analysis highlights a long term bullish trend with a short pullback. As of now, NEIRO was hovering near the support of $0.116 level.
Now, if the bulls make a comeback and the price takes a rebound,, it may indicate a trend continuation and price may show gains. However, if NEIRO breaks below the support, it may indicate weakness in the short term and the price may incur losses.

Neiro Ethereum (NEIRO)Neiro Ethereum (NEIRO)
NEIRO is a cryptocurrency with a total supply of 1 billion tokens, featuring zero buy/sell tax and no team tokens, indicating a community-driven approach. It is being touted as the next big opportunity in the crypto space, drawing comparisons to Dogecoin's rise.
Neiro Ethereum price made a strong rally in the previous week gaining over 690% a week. The bulls seemed to be dominating the previous week which the crypto may continue in this week as well.
It has a live market capitalization of $119.93 Million and ranks 257th among the 2.4 Million cryptocurrencies. The daily transaction volume stands close to $28.94 with a 28.5% growth a day.
Additionally the volume to market cap ratio at 25.5% suggests high volatility. It has a circulating supply and total supply of 1 Billion NEIRO tokens.
