EthereumETHUSD : Another cryptocurrency zooming into all-time high, backed by lifetime highest volumes.
Search in ideas for "ethereum"

Ethereum: Bull FlagCurrently moving in this range and forming a bull flag. On breakout can eye for target $3500. DYOR, NFA.
Disclaimer: I'm not a trading expert.

Ethereum: Grind to new highs!Over the past 2 week, ETH/USD has been putting on a consistent show for us. Great price action to trade on between this parallel channel.
This is held strong by the power of ETH/BTC. Now that's a tasty chart!
Time will confirm how ETH/USD progresses, but long term target is still $2000.

ETH to form a pullback situation and riseEthereum's open interest is $6.38 Billion. As per Coinglass, another crypto analysis website, it rose by 1.63% in the previous session. The long versus short ratio for 24 hours is 0.9814. The short liquidation is $7.34 Million versus $14.69 Million for the long liquidation.
What Can Ethereum Price Prediction (ETH) Be, Based On Technical Analysis?
An analyst, Yoddha, optimistically states that Ethereum is one of the most bullish altcoins and has already traded above the previous yearly high. He also highlighted the drawing where he presented that in the last time cycle, when the previous high was breached around 2020, the price boomed and formed a new peak. So, By the shared drawing, the analyst highlights a possible bullish run.
Similarly, based on the analyst tweet, the ETH asset daily chart shows that it has remained above the 50-day and 200-day EMAs, portraying bullish strength in the long term. The past price structure shows that ETH has been trying to form a pullback for a more significant rally after breaking out of the wedge. The buyers are showing support buildup at the $3500 support level.
At press time, the price has traded at $3512 with an intraday surge of +1.28%, with a market capitalization of $421.72 Billion. The volume-to-market cap ratio currently stands at 3.32%, signifying low liquidity, and the market needs more liquidity for a higher ascent.
Likewise, despite the fall, the MACD portrays that the price is still bullish territory, above the zero line at 21.5, in a safer zone until it's above the 200-day EMA. The RSI flashed at 45.54, signifying low strength in the momentum, as it has been trying to sustain around 50 median lines. Based on technical tools, the Ethereum crypto could become winning steam by forming a bullish cross and rsi moving above(DYOR). It could continue to climb higher in future sessions.
Ethereum Price Forecast!
Therefore, for ETH to form a pullback situation and rise, the next goal for the ETH price could be to reach the above levels, such as $3720 and $3900.
On the contrary, if the price plunges and trades below the 50-day EMA, then the pullback situation would fail, ETH would lose its bullish significance, and the price would seek lower support in search of a perfect spot to form a pullback.
Likewise, in this scenario, if the Ethereum crypto price fails to stay above the $3260 level, it could also decline further to $3060.

ETH "Head & Shoulder" 🤯Ethereum (ETH) is currently trading in the $1499 range, the price of Ethereum (ETH) approaching the Head & Shoulder Support level . If the prices stay above baseline ( demand zone ) ETH could reach $2050. If Ethereum (ETH) falls below the baseline ( demand zone ) , it could fall to $1039.
Comment your direction $2050 or $1039
Personally, I predicted that the price of ETH would rise to $2050.
Happy Trading $$$

ETH/USD – Symmetrical Triangle Breakout Imminent?Ethereum is consolidating within a symmetrical triangle on the 30-minute Heikin Ashi chart, suggesting a potential breakout is approaching. Price is currently hovering around the 50 EMA, showing indecision between bulls and bears.
🔹 Key Levels
Resistance: $3,675
Support: $3,483
EMA (50): $3,562
RSI: Neutral at 51.75
📌 Watch for breakout confirmation above the descending trendline or a breakdown below the ascending trendline to signal the next directional move.
⚠️ Not financial advice. Always do your own research.
#ETH #Ethereum #Crypto #TechnicalAnalysis #TrianglePattern #Breakout #HeikinAshi #Trading

Educational | Completed a complex triple correctionEthereum seems to have completed a triple combination pattern
Wave Z ended with a neutral triangle
Wave Y was a zigzag
Wave W was a flat.
Wave Y took equal time as Wave W to form
Wave Z took twice the time of Wave W/Y.
This triple combination completed Wave E of a larger neutral triangle.
The internal Wave E of a triangle is generally similar to the larger triangle of which it is a part of.
In this case too, the Wave E of the neutral triangle itself concluded with a neutral triangle.
Let me know if you'd more such educational content or larger timeframe analysis of Ethereum or any other asset.
Happy Trading!!

ETH: Make or Break Moment!Ethereum ( CRYPTOCAP:ETH ) is at a critical stage, standing at the crossroads of new ATH glory or a potential bull trap. 🔥
📊 Key Observations:
• ETH is showing strong momentum, but resistance at this stage could dictate its next big move.
• A breakout here could propel it to a new all-time high, breaking barriers and leading the altcoin charge.
• On the flip side, a rejection might signal a bull trap, pulling the market lower for a liquidity grab.
💡 What to watch:
1️⃣ Volume: Is there enough buying pressure to fuel a breako/ut?
2️⃣ BTC’s Influence: Will Bitcoin’s movement support ETH’s push higher?
3️⃣ Macro Resistance: How CRYPTOCAP:ETH reacts to key levels will set the tone for the coming days.
🔮 My take: Ethereum has the potential to lead the next bull wave, but caution is key. A decisive breakout would be a bullish signal, but patience is essential if the market falters.
Is this the start of a new ATH, or are we heading into a bull trap? Drop your predictions below! 🚀👇

golden crossover is itself a strong signEthereum (ETH) recently experienced a pause in its upward trend movement, having reached a high of $3,970. This consolidation period came on the heels of a spectacular 25% increase in its price, which was triggered by a breakout from a bullish pattern of a descending triangle pattern on the daily chart. Despite a minor pullback from its recent peak, ETH is now nearing a significant hurdle level at $3,750.
Should Ethereum (ETH) manage to surpass and maintain above this hurdle point, it could probably display a bullish trend to resume, which could potentially leading to additional gains. Meanwhile, the technical tools on the daily chart largely hints at a positive outlook. The price has been above the 200-day EMA that implied that the bullish momentum may continue in the long term.
Moreover, the ongoing 50-day and 200-day EMAs golden crossover is itself a strong sign of an favourable long-term trend. Conversely, the MACD exhibited a bearish crossover, indicating some caution to keep.
The RSI has declined below the 50 level and the 14-day SMA, that shows a momentary weakening in momentum. For confirmation of a sustained upward trend in ETH, it would be wise to observe the RSI's recovery above the median line (DYOR).

A Technical Overview Of ETH Ethereum has a market cap of $446 Billion and is ranked 2nd in the crypto verse. The volume of the ETH has surged by 255% in the last 24 hours. The price of ETH has observed a rise of 20% in the last 24 hours. ETH rise is speculated due to the upcoming approvals of the Spot ETF.
ETH is forming strong bullish candles on the daily chart. It is trading above the 50,100 and 200 EMA while looking to cross the new highs. The upside momentum of Ethereum can see a halt near $4000. Meanwhile, the support of the asset price can be observed near $3500
The RSI of ETH is currently at 71 with the strong positive slope suggesting its presence in the oversold zone. The overall sentiment of RSI and MACD are bullish on the daily chart.

ETHEREUM COULD SEE 6000 Soon We may see strong 3rd wave towards 6000/8000 soon as the volatality increase .
3rd wave Personality we have seen from 3850 low if the pressure towards high intake we may see new high by end of the year .

Ethereum 15-Minute Chart: Bullish Channel Targeting $4,210ETH/USD) – 15-Minute Chart Technical View
Current Price: ≈ $4,024
Structure: Price has rebounded from the blue “SUPPORT LEVEL / BUY ZONE” and is trading inside a rising channel.
Key Levels
Support / Buy Zone: $3,965 – $3,966
Stop-Loss Region: around $3,924 (just under the support box)
Immediate Resistance: ~$4,040–4,060 (mid-channel area)
Upside Target (EA Target Point): $4,210 – $4,212
Momentum & Pattern
The short-term trend is upward, confirmed by higher highs/lows within the channel.
Blue projection lines indicate a possible dip toward the lower trendline before another push higher.
Trading Idea (Chart-Based)
Bullish Scenario:
If price holds above the $3,965 support, a continuation toward $4,210 is favored.
A brief retracement to the lower channel (~$4,000) could offer entries, with a stop below $3,924.
Bearish Scenario:
A 15-min close below $3,924 would invalidate the setup and could trigger a drop toward $3,880 or lower.
Takeaway
The chart suggests a buy-the-dip strategy within the channel, targeting the $4,210 zone, while respecting a tight stop around $3,924. Monitor volume and broader market sentiment for confirmation.

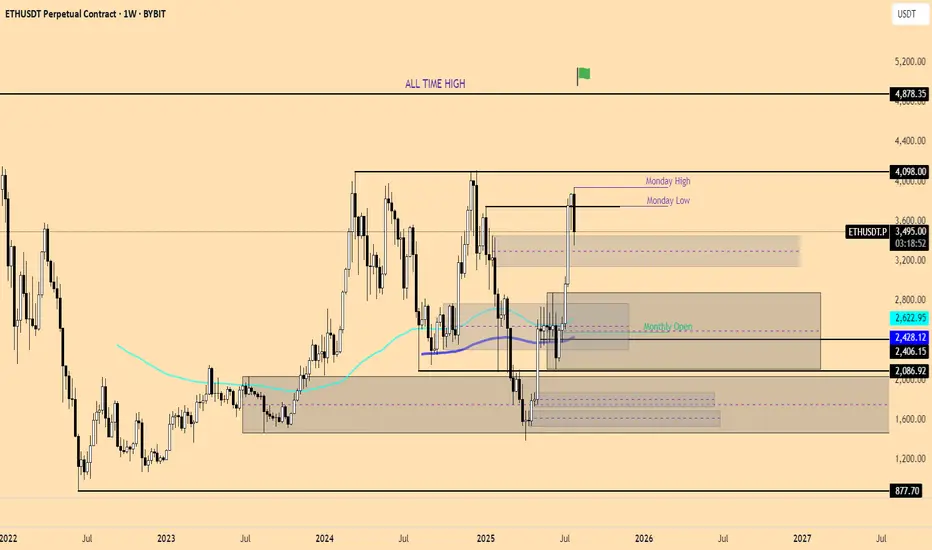
Ethereum 1 Week View📊 Weekly Timeframe Technical Overview
On the weekly chart, ETH has recently achieved its highest weekly close in four years, signaling strong bullish momentum.
🔄 Key Support and Resistance Levels
Support Levels: The primary support zone lies between $4,150 and $4,200, with additional support around $4,000.
Resistance Levels: Immediate resistance is observed around $4,500, with stronger resistance near $4,700–$4,760 .
📈 Technical Indicators
Relative Strength Index (RSI): The 14-day RSI is approximately 51.58, indicating neutral momentum
Moving Averages: Short-term moving averages (5-day, 10-day) are above the current price, suggesting potential resistance, while longer-term averages (50-day, 100-day, 200-day) are below, indicating support
MACD: The MACD is positive, supporting a bullish outlook
🧭 Market Sentiment
Analysts are closely monitoring the Federal Open Market Committee (FOMC) meeting this week, as a dovish stance could bolster risk assets like ETH, potentially driving prices toward the $4,700–$4,800 range
📅 Price Forecast
Analytical forecasts suggest that ETH may reach approximately $4,311.84 within a week and $4,520.26 within four weeks.

ETH/USDT Buy Setup – Rounding Bottom RetestEthereum is setting up a high-probability long entry after completing a 4H rounding bottom pattern with a clean retest. This structure often signals exhaustion of sellers and the start of a sustained bullish leg.
Trade Idea
Buy Entry: 4510
Stop Loss: 4400
Target: 1:1.5 RR (approx. 4810)
Why This Setup?
4H Rounding Bottom: Classic reversal + continuation structure.
Retest Confirmation: Price is reacting strongly after trapping late sellers.
Confluence: Trend momentum aligns with bullish bias, supported by higher timeframe structure.
Execution Notes
Risk small and stick to 1–2% max per trade.
If ETH breaks and holds above 4600, momentum could accelerate quickly.
Trail stops if strength builds toward $4800–$4900 zone.
Summary: ETH has trapped sellers at the lows and is retesting a bullish rounding bottom. With clean risk defined at 4400, this 1:1.5 setup offers both safety and upside potential.

ETH/USD 4H ANALYSIS
Ethereum continues to respect the ascending trendline from July lows. Price recently tested the $4,600 zone and is now pulling back slightly.
Trendline Support: Price remains above the rising trendline, showing buyers are still in control of the mid-term trend.
RSI (14): Currently at 56, holding above the 50 level → signals bullish momentum remains intact despite the pullback.
Short-Term Outlook: A retest of the trendline could provide a potential higher-low setup for continuation towards $4,800–$5,000.
Invalidation: A break and close below the trendline would weaken the bullish structure and open downside risk toward $4,200–$4,300.
🔑 Trading Plan
Bullish Bias: Look for long setups on successful retest of trendline + RSI staying above 50.
Bearish Scenario: If price closes below the trendline with RSI < 50, shift bias to short-term downside.

Ethereum Liquidity Sweep Setup for Bullish Continuation📊 Market Analysis Report – ETHUSD
The market has been consolidating within a range after a strong impulsive move down, followed by a period of liquidity sweeps and corrective structure. Price action shows signs of engineered liquidity grabs both above and below recent highs and lows, which indicates smart money activity.
Currently, ETH is transitioning from a compression phase into expansion. The accumulation zone formed in recent sessions suggests a build-up for a larger move. The market appears to be setting up a liquidity sweep to the downside before a potential continuation upward, aligning with the projected path on the chart.
From a structural perspective, the overall cycle points towards bullish continuation after this corrective phase. The projected liquidity sweep is designed to trap early sellers before price accelerates towards higher objectives.

Ethereum (ETH/USD) Bullish Rebound Setup Toward 4,474Here’s the technical analysis of ETH/USD chart you shared:
Key Levels:
Entry Point: ~4,263.60
Stop Loss: ~4,240.64
Target Point: ~4,474.45
Current Price: ~4,296.85
Observations:
Trend Channel (Uptrend then Breakdown):
ETH previously moved in a strong upward channel (blue zone), but price broke down sharply from the channel top near 4,476.
After the drop, it consolidated sideways.
Support Zone:
Strong demand area marked between 4,240 – 4,264 (blue rectangle).
This is where the entry point is placed, suggesting buyers may re-enter.
Bullish Rebound Setup:
If ETH retests the support zone around 4,264.56 and holds, a bullish reversal toward 4,474.45 (resistance/target) is expected.
That would be about +4.89% upside.
Risk Management:
Stop-loss at 4,240.64 ensures downside is limited if support fails.
Risk/reward ratio looks favorable, since the downside risk is ~25 points while the upside potential is ~210 points.
Outlook:
Bullish Scenario: A bounce from the 4,264 support zone could trigger a rally back to 4,474.
Bearish Scenario: A breakdown below 4,240 would invalidate the setup, opening room for deeper correction.
📊 Bias: Short-term bullish above 4,264; cautious if below 4,240.

ETH–USD 2 Hour ViewEthereum vs USD — 2-Hour Timeframe Levels
You asked for key price levels on a 2-hour chart. While I can't generate live 2-hour chart data here, I can share recent technical insights with support and resistance levels, plus your current price context.
⏺ Key Technical Levels (as of early September 2025):
Support Zones:
$4,360 — initial support area
$4,315 — next downside level
Below that: $4,260 and $4,220 are cited as further downside supports
Resistance Zones:
$4,500 — key resistance, blockage for current rally
If surpassed: $4,520 and $4,555 are possible next targets
Extended resistance: up to $4,620, then $4,660 or even $4,720 if momentum builds
Mid-range / Technical Sentiment:
Recent consolidation between $4,350–$4,450, holding above the 100-hour SMA with rebound potential
Daily chart structure remains bullish as long as ETH stays above $4,000; a breakdown below that could weaken structure
Next Steps for You:
Use a charting platform (e.g., TradingView) with a 2-hour timeframe and apply horizontal lines at these zones.
Watch for price action: Does ETH bounce at support? Does it stall or break through resistance? Candlestick patterns and volume around these levels help refine entries/exits.
Play momentum: Watch aggressiveness above $4,500 with targets at $4

ETH/USD 4H – Losing Momentum at Key LevelsEthereum is struggling to hold above its ascending trendline after rejection from the $4,800–$4,880 resistance zone. Price is currently trading around $4,395, sitting just above support at $4,186 and $4,066.
📉 ETH has broken below its short-term uptrend while the 200 EMA ($4,184) now acts as a crucial support zone. A breakdown below this level could accelerate downside pressure.
📊 Indicators:
RSI (14): Around 42, showing bearish momentum with room for further downside before oversold levels.
ADX (14): At 26, indicating a weakening trend strength compared to previous moves.
🔻 Bearish Scenario: Failure to defend $4,184–$4,066 could open the door for deeper retracements.
🔺 Bullish Scenario: A reclaim of the descending trendline and $4,792 resistance would be the first sign of recovery.
⚡ ETH is at a decision point — support retest or deeper correction.

Ethereum | Ready for a big move?Currently in accumulation phase which is about to over. Spike anytime.

Ethereum 21-Aug-2025 PredictionAs Shown in the chart, the box at the bottom was the level to be tested and the swing should change from here onwards. Target would be the Box on the Top of the Chart. Positive for a 150 point move.

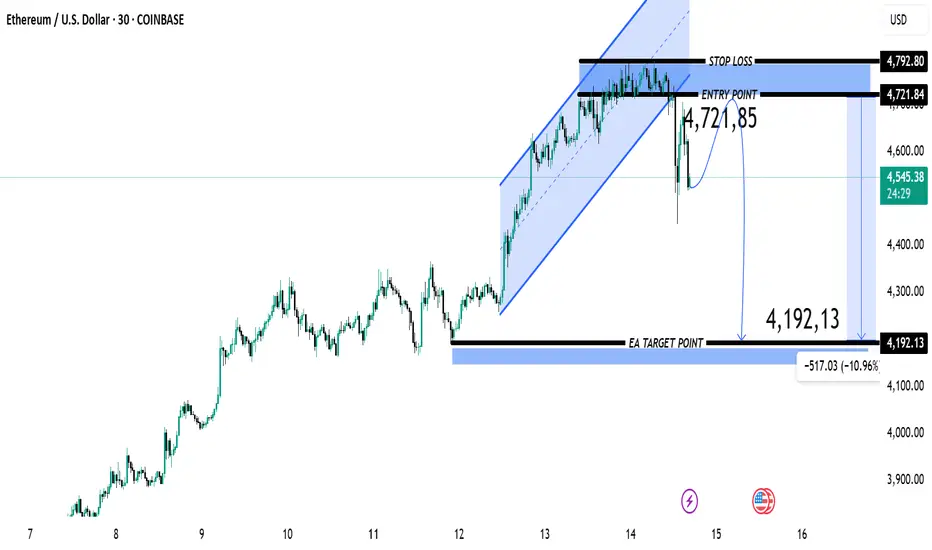
Ethereum Bearish Breakdown Targeting $4,1921. Price Structure
ETH had been moving inside a rising channel (blue shaded area).
Price broke below the channel, signaling potential weakness.
The current market price is around 4,559.66, below the marked entry point at 4,721.85.
2. Trade Setup
Entry Point: 4,721.85 USD — planned for a short (sell) position after price exits the bullish channel.
Stop Loss: 4,792.80 USD — above recent highs to protect against false breakdowns.
Target: 4,192.13 USD — a key horizontal support zone.
Risk: ~70.95 USD above entry.
Reward: ~529.72 USD below entry.
Risk-to-Reward ratio ≈ 1:7.5, indicating high potential reward relative to risk.
3. Technical Signals
Channel Breakdown: Suggests the uptrend momentum has weakened.
Bearish Candle after Breakout: Confirms selling pressure.
Target Level: Coincides with previous support from August 12th price action.
4. Bias:
Short-term bearish bias until price action reclaims the 4,721.85 level.
If ETH closes above 4,792.80, bearish setup is invalidated.
Summary:
This is a short trade setup aiming to capitalize on a breakdown from an uptrend channel. The stop loss is tight relative to the large downside target, offering an attractive risk/reward. However, volatility around current levels may cause retests before continuation.
Ethereum playCRYPTOCAP:ETH weekly still looks bullish, will see HLs on LTF and add re-long it CRYPTOCAP:ETH weekly still looks bullish, will see HLs on LTF and add re-long it