Trendline Breakout in ETHUSD – Watch for Momentum!Ethereum has successfully broken above a key descending trendline on the 15-minute chart, signaling a potential shift in short-term sentiment.
📈 Breakout Level: ~$3,829
🎯 Target Zone: ~$3,873
🛑 Stop Loss: Below ~$3,767
After several rejections along the resistance, ETH finally managed a clean breakout with a strong bullish candle. If it sustains above the trendline, we could see follow-through buying towards the upper zone.
🔍 Keep this setup on radar — a retest and bounce from the trendline could offer a high-probability entry.
Search in ideas for "ethereum"

Ethereum as said last week will go near ATH How My Harmonic pattern projection Indicator work is explained below :
Recent High or Low :
D-0% is our recent low or high
Profit booking zone: D13% -D15% is
range if break them profit booking start on uptrend or downtrend but only profit booking, trend not changed
SL reversal zone : SL 23% and SL 25% is reversal zone if break then trend reverse and we can take reverse trade
Target : T1, T2, T3, T4 and .
Are our Target zone

ETHUSD Short Setup – 15min ChartEthereum is currently showing weakness after a tight consolidation phase. Price has failed to sustain above key resistance and has broken below the minor support level, triggering a short opportunity.
🔻 Entry: $2,947
🎯 Target: $2,897
🛑 Stop Loss: $3,000

Ethereum updated levels, buy in dip previous ATH target openHow My Harmonic pattern projection Indicator work is explained below :
Recent High or Low :
D-0% is our recent low or high
Profit booking zone: D13% -D15% is
range if break them profit booking start on uptrend or downtrend but only profit booking, trend not changed
SL reversal zone : SL 23% and SL 25% is reversal zone if break then trend reverse and we can take reverse trade
Target : T1, T2, T3, T4 and .
Are our Target zone

ETHUSD Trade Setup – 15Min Chart UpdateEthereum respected the rising channel structure throughout the session, maintaining higher highs and higher lows. After a brief correction, ETH has once again bounced from the lower trendline support of the ascending channel.
🚀 Entry has been triggered right off the channel support zone, indicating bullish momentum is still intact.
📌 Key Levels:
Entry: Near $2783
Stop Loss: Below $2753
Target: $2809 and beyond
This setup offers a favorable risk-reward ratio, with strong structure-based confidence. As long as the trendline holds, bullish continuation is likely.

Corrective Rise UpEthereum seems to have completed Wave C of an expanding triangle and now we're headed towards Wave D.
Ethereum levels,try to sell near resistance 2150-220 buying areaHow My Harmonic pattern projection Indicator work is explained below :
Recent High or Low :
D-0% is our recent low or high
Profit booking zone: D13% -D15% is
range if break them profit booking start on uptrend or downtrend but only profit booking, trend not changed
SL reversal zone : SL 23% and SL 25% is reversal zone if break then trend reverse and we can take reverse trade
Target : T1, T2, T3, T4 and .
Are our Target zone
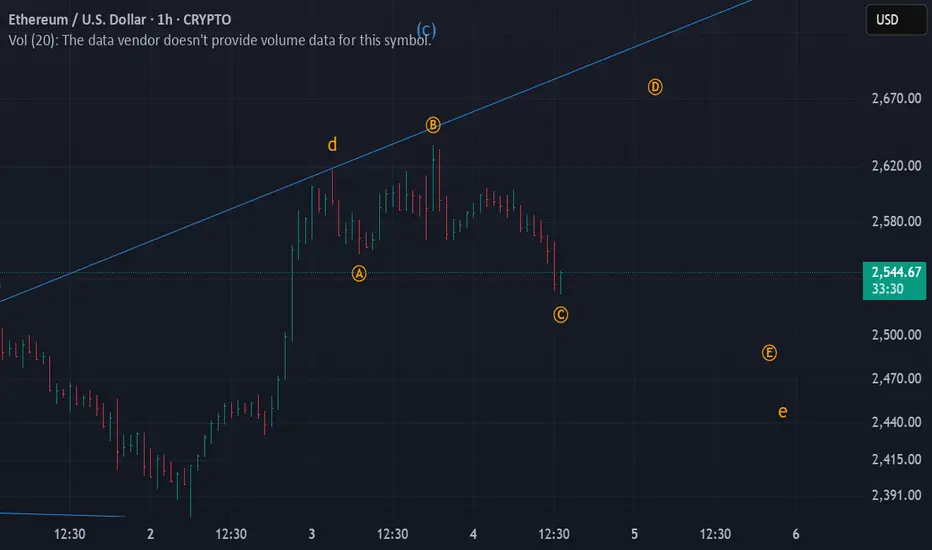
Corrective DowntrendEthereum seems to forming Wave E of an expanding triangle and could lead to below Wave C.
Will update in case we need to book profit
Corrective Rise UpEthereum seems to have completed Wave C
and now we're entering Wave D which will be a corrective rise.
I believe we're in the starting of a diametric formation which will be of 'diamond' category

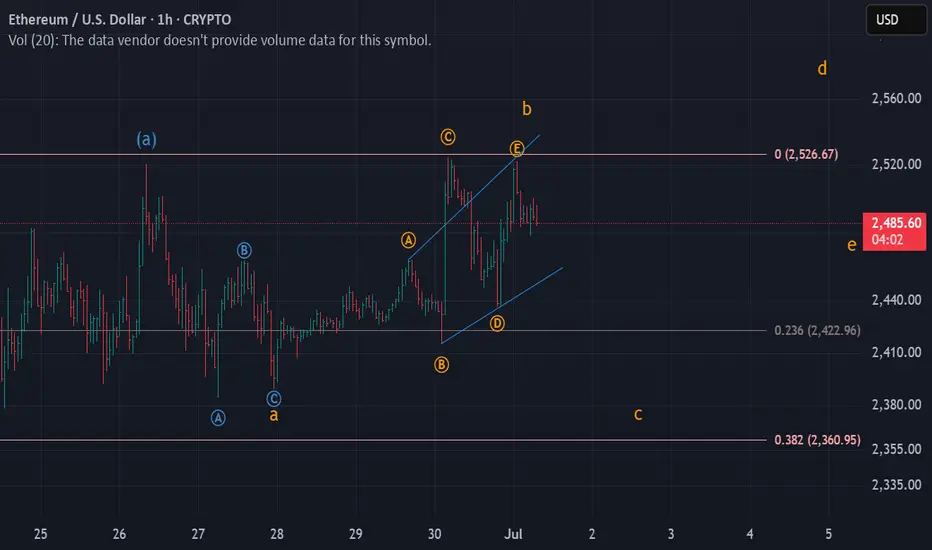
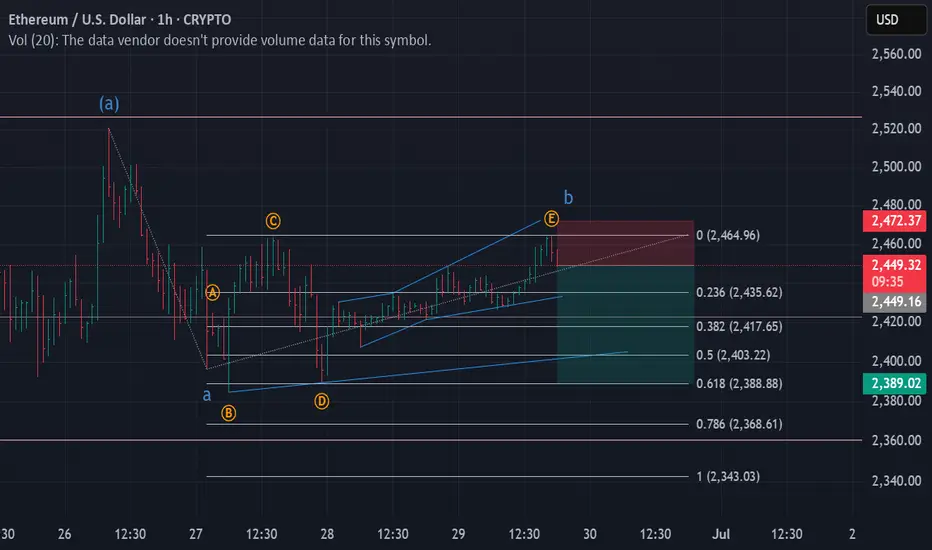
Corrective Downtrend | Hourly Ethereum seems to have completed Wave B in an hourly timeframe and now moving towards Wave C which could end a little lower than the starting of Wave B.
Will keep updating in case of any changes
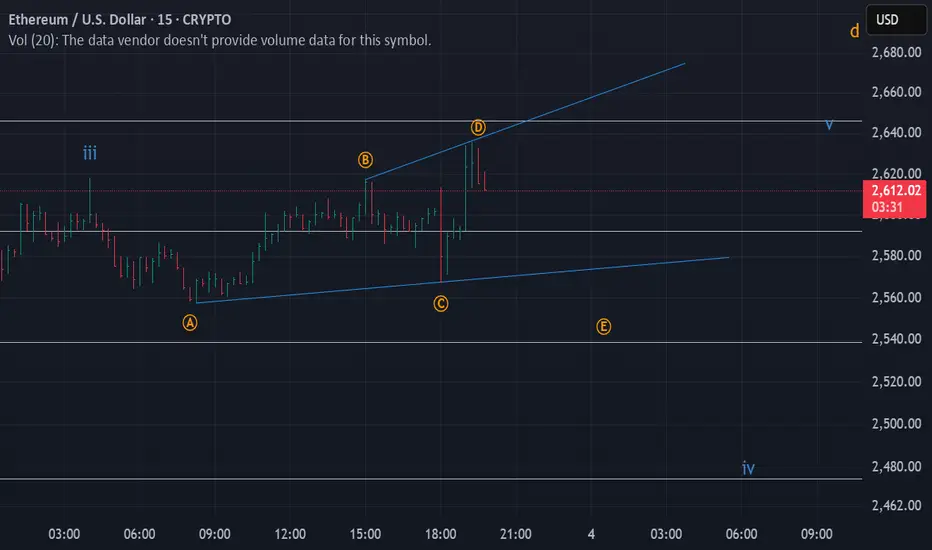
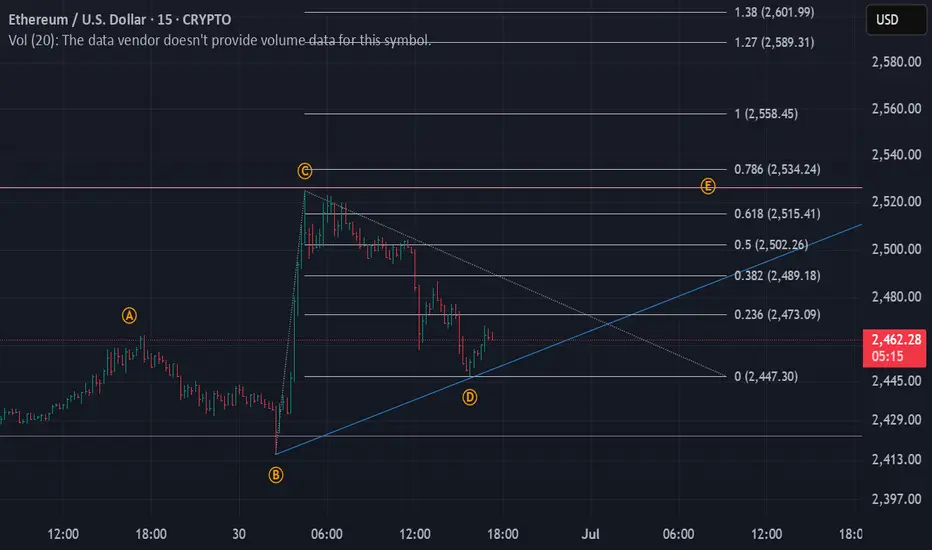
Corrective Rise UpEthereum seems to have or nearly completed Wave D of a neutral triangle and entering Wave E.
The minimum target of Wave E is around 2480
A break below current B-D trendline will be a warning sign that Wave D is still in progress
Ethereum buy near 2440 add more st 2380 sl 2340 target 2660,2730How My Harmonic pattern projection Indicator work is explained below :
Recent High or Low :
D-0% is our recent low or high
Profit booking zone: D13% -D15% is
range if break them profit booking start on uptrend or downtrend but only profit booking, trend not changed
SL reversal zone : SL 23% and SL 25% is reversal zone if break then trend reverse and we can take reverse trade
Target : T1, T2, T3, T4 and .
Are our Target zone

ETHUSD | SHORTEthereum seems to have completed Wave B and currently going to start Wave C of a ZigZag.
Current Price -> 2450
Stop Loss ~> 2475
Target 1 -> 2400
Ethereum chart showing weakness avoid fresh buy until 2580 breakHow My Harmonic pattern projection Indicator work is explained below :
Recent High or Low :
D-0% is our recent low or high
Profit booking zone: D13% -D15% is
range if break them profit booking start on uptrend or downtrend but only profit booking, trend not changed
SL reversal zone : SL 23% and SL 25% is reversal zone if break then trend reverse and we can take reverse trade
Target : T1, T2, T3, T4 and .
Are our Target zone
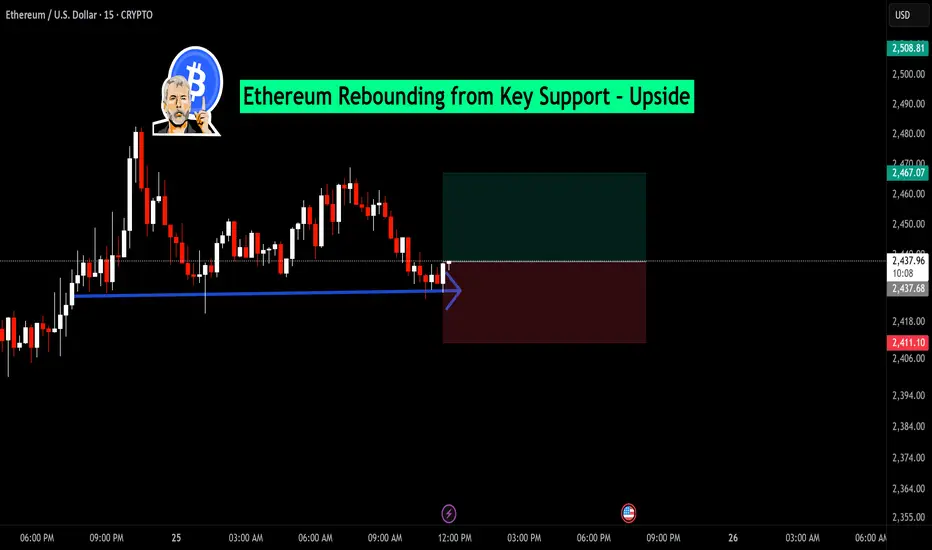
Ethereum Rebounding from Key Support – Upside TargetSupport Zone: Price has tested and respected a horizontal support level around $2,436, highlighted by the blue line and arrow. Multiple rejections here suggest buying interest.
Candlestick Reaction: A small bullish candle is forming right at support, hinting at a possible bounce.
Risk-Reward Setup: The green and red box indicates a favorable long trade setup:
✅ Entry: Near the support zone at $2,436
🎯 Target: Around $2,481 — a prior resistance level
🛑 Stop-Loss: Just below support, around $2,394 — protecting against breakdown
Ethereum 2150-2130 positional Target hit now buy on dip How My Harmonic pattern projection Indicator work is explained below :
Recent High or Low :
D-0% is our recent low or high
Profit booking zone: D13% -D15% is
range if break them profit booking start on uptrend or downtrend but only profit booking, trend not changed
SL reversal zone : SL 23% and SL 25% is reversal zone if break then trend reverse and we can take reverse trade
Target : T1, T2, T3, T4 and .
Are our Target zone

Ethereum still looking negative if ceasefire news come then up How to take trades using Harmonic pattern projection Trade setup is explained below :-
Entry : 1st SL point : 0% is recent top or bottom.
Trailing D: 15.1% is work as trailing SL of buy or sell trade if hit then we have to book profit
.If price goes below 2nd D 22.5% to 24.5% range then early traders can make fresh reversals trade after breaking 1st D 15.1% safe traders can reversal trade after breaking Point D 22.5.4% to 24.5% range
Targets :
Target T1 : 36.1% to 38.3%
Target T3 : 49.1% to 52.5%
T3: 60.9% to 64.8% is our 3rd Target since this is reversal zone so must book profit if break then take fresh trade again
Target T4 : 76.4% to 79.7%
Next Targets are 100% , 127.2% ,141.4% and final Target 161.8%.
How to take reversal trade :
If price going upside/ downside then then buy or sell levels appear on Chart ( Automatically show when price reach any reversal zone of harmonic projection ).
Trailing SL:
After reach 1st Target trail SL to just above or below cost ( for example we are holding sell trade from 100 1st Target 110 hit then move trailing sl to 104-105 and move SL as price move upside or Downside)
Re- Entry :
For Re-entry in any pull back Point D ( 15.1% ) is used for re-entry then SL recent high or low Point SL ( 0% ) .
Blue Line is 1st support/ Resistance
Green line is 2nd support/ resistance
Red line is 3rd Support/ resistance

ETH/USD – Intraday Short Setup (15min)Ethereum faced rejection from the $2,555 zone and formed a short-term lower high structure.
📉 Trade Idea:
Entering a short position near $2,510
🎯 Target: $2,465
🛑 Stop Loss: $2,555
🔄 Risk-Reward: ~1:1
🔍 Price is struggling to sustain above key resistance and showing signs of exhaustion after a minor pullback. Ideal setup for scalpers/traders with a short bias.

Ethereum updated levels let ti go down near 2050-1990How to take trades using Harmonic pattern projection Trade setup is explained below :-
Entry : 1st SL point : 0% is recent top or bottom.
Trailing D: 15.1% is work as trailing SL of buy or sell trade if hit then we have to book profit
.If price goes below 2nd D 22.5% to 24.5% range then early traders can make fresh reversals trade after breaking 1st D 15.1% safe traders can reversal trade after breaking Point D 22.5.4% to 24.5% range
Targets :
Target T1 : 36.1% to 38.3%
Target T3 : 49.1% to 52.5%
T3: 60.9% to 64.8% is our 3rd Target since this is reversal zone so must book profit if break then take fresh trade again
Target T4 : 76.4% to 79.7%
Next Targets are 100% , 127.2% ,141.4% and final Target 161.8%.
How to take reversal trade :
If price going upside/ downside then then buy or sell levels appear on Chart ( Automatically show when price reach any reversal zone of harmonic projection ).
Trailing SL:
After reach 1st Target trail SL to just above or below cost ( for example we are holding sell trade from 100 1st Target 110 hit then move trailing sl to 104-105 and move SL as price move upside or Downside)
Re- Entry :
For Re-entry in any pull back Point D ( 15.1% ) is used for re-entry then SL recent high or low Point SL ( 0% ) .
Blue Line is 1st support/ Resistance
Green line is 2nd support/ resistance
Red line is 3rd Support/ resistance
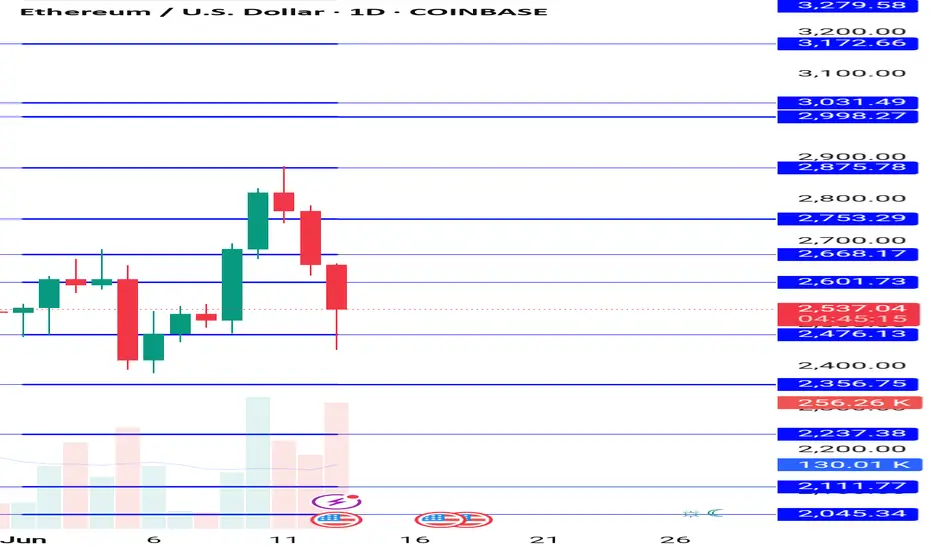
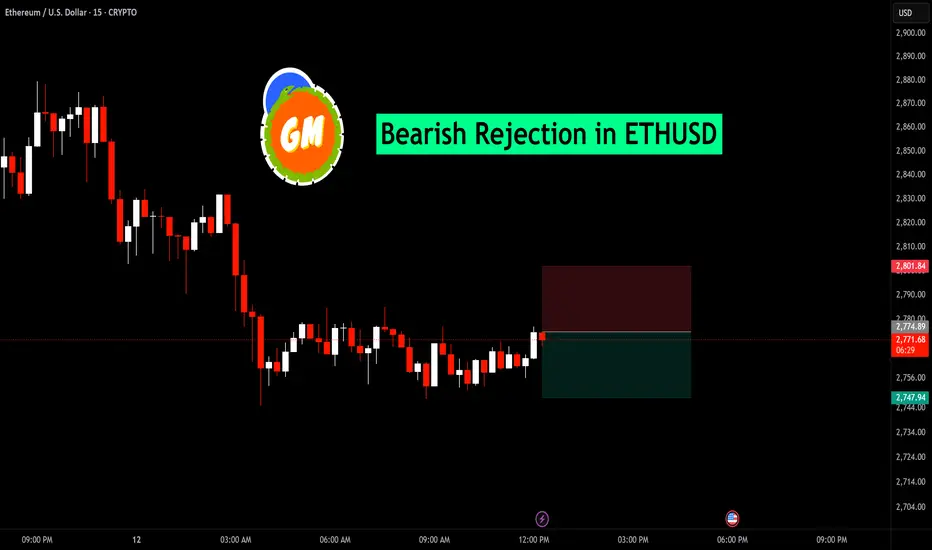
ETHUSD – Bearish Rejection Setup | 15-Min ChartEthereum faced rejection near the $2,775 resistance zone, indicating potential short-term weakness. After a period of sideways consolidation, the price failed to sustain above the key level and has started to show signs of bearish pressure.
Entry: $2,774.89
Target: $2,747.94
Stop Loss: $2,801.84
Risk-Reward Ratio: 1:1
This setup reflects a potential short opportunity as ETH forms a lower high and struggles to break above previous supply zones. A clean break below support may accelerate downside momentum.
Ethereum avoid fresh buying at current price buy given at 2470How to take trades using Harmonic pattern projection Trade setup is explained below :-
Entry : 1st SL point : 0% is recent top or bottom.
Trailing D: 15.1% is work as trailing SL of buy or sell trade if hit then we have to book profit
.If price goes below 2nd D 22.5% to 24.5% range then early traders can make fresh reversals trade after breaking 1st D 15.1% safe traders can reversal trade after breaking Point D 22.5.4% to 24.5% range
Targets :
Target T1 : 36.1% to 38.3%
Target T3 : 49.1% to 52.5%
T3: 60.9% to 64.8% is our 3rd Target since this is reversal zone so must book profit if break then take fresh trade again
Target T4 : 76.4% to 79.7%
Next Targets are 100% , 127.2% ,141.4% and final Target 161.8%.
How to take reversal trade :
If price going upside/ downside then then buy or sell levels appear on Chart ( Automatically show when price reach any reversal zone of harmonic projection ).
Trailing SL:
After reach 1st Target trail SL to just above or below cost ( for example we are holding sell trade from 100 1st Target 110 hit then move trailing sl to 104-105 and move SL as price move upside or Downside)
Re- Entry :
For Re-entry in any pull back Point D ( 15.1% ) is used for re-entry then SL recent high or low Point SL ( 0% ) .
Blue Line is 1st support/ Resistance
Green line is 2nd support/ resistance
Red line is 3rd Support/ resistance

Ethereum buy given near 2460 2850-2930 upside Target open How to take trades using Harmonic pattern projection Trade setup is explained below :-
Entry : 1st SL point : 0% is recent top or bottom.
Trailing D: 15.1% is work as trailing SL of buy or sell trade if hit then we have to book profit
.If price goes below 2nd D 22.5% to 24.5% range then early traders can make fresh reversals trade after breaking 1st D 15.1% safe traders can reversal trade after breaking Point D 22.5.4% to 24.5% range
Targets :
Target T1 : 36.1% to 38.3%
Target T3 : 49.1% to 52.5%
T3: 60.9% to 64.8% is our 3rd Target since this is reversal zone so must book profit if break then take fresh trade again
Target T4 : 76.4% to 79.7%
Next Targets are 100% , 127.2% ,141.4% and final Target 161.8%.
How to take reversal trade :
If price going upside/ downside then then buy or sell levels appear on Chart ( Automatically show when price reach any reversal zone of harmonic projection ).
Trailing SL:
After reach 1st Target trail SL to just above or below cost ( for example we are holding sell trade from 100 1st Target 110 hit then move trailing sl to 104-105 and move SL as price move upside or Downside)
Re- Entry :
For Re-entry in any pull back Point D ( 15.1% ) is used for re-entry then SL recent high or low Point SL ( 0% ) .
Blue Line is 1st support/ Resistance
Green line is 2nd support/ resistance
Red line is 3rd Support/ resistance

Ethereum buy recommended near 2450 2830-2910 upside Target How to take trades using Harmonic pattern projection Trade setup is explained below :-
Entry : 1st SL point : 0% is recent top or bottom.
Trailing D: 15.1% is work as trailing SL of buy or sell trade if hit then we have to book profit
.If price goes below 2nd D 22.5% to 24.5% range then early traders can make fresh reversals trade after breaking 1st D 15.1% safe traders can reversal trade after breaking Point D 22.5.4% to 24.5% range
Targets :
Target T1 : 36.1% to 38.3%
Target T3 : 49.1% to 52.5%
T3: 60.9% to 64.8% is our 3rd Target since this is reversal zone so must book profit if break then take fresh trade again
Target T4 : 76.4% to 79.7%
Next Targets are 100% , 127.2% ,141.4% and final Target 161.8%.
How to take reversal trade :
If price going upside/ downside then then buy or sell levels appear on Chart ( Automatically show when price reach any reversal zone of harmonic projection ).
Trailing SL:
After reach 1st Target trail SL to just above or below cost ( for example we are holding sell trade from 100 1st Target 110 hit then move trailing sl to 104-105 and move SL as price move upside or Downside)
Re- Entry :
For Re-entry in any pull back Point D ( 15.1% ) is used for re-entry then SL recent high or low Point SL ( 0% ) .
Blue Line is 1st support/ Resistance
Green line is 2nd support/ resistance
Red line is 3rd Support/ resistance
