Ethereum Rebounds But Investors Fear Larger Crash On The HorizonEthereum Rebounds But Investors Fear Larger Crash On The Horizon?
Ethereum Price recovered nearly 6% from yesterday's lows and has reclaimed the $3000 level.
The transaction volume dropped by 44.7% indicating the waning seller's interest.
The bloodbath in the crypto markets seemed to be taking a pause on Saturday after a sharp fall in the last couple of sessions that triggered a panic among the investors.
The Ethereum crypto also climbed nearly 6% from yesterday's low and has reclaimed back the psychological $3000 level. Despite panic in the broader markets, few analysts are hoping for the bad days to end as soon as the SEC approves Ethereum ETFs.
As per the analysts, the Ethereum ETFs may bring back the optimism in the crypto markets and the markets may recover. Moreover, the transaction volume has dropped significantly indicating an improving sentiment.
Can Ethereum ETFs Approval Turn The Tables Again?
The Ethereum ETF approval was a dual-stage process in which the initial phase was completed with the approval of the 19b-4 documents by the issuers.
On May 23, the SEC gave the green light to 19b-4 submissions from eight contenders for ETFs. Moreover, the approval of S-1 forms by the was a later or final process which was anticipated to be completed by 2nd July.
Fwiw, Bloomberg's @JSeyff saying week of July 8th looks more likely for spot eth ETF approval...Another source said "it’s also a possibility that it could be later in July or later in the summer."My take? It shouldn't take this long.via @KathieOD_PI pic.twitter.com/M9LVhfa9vd— Nate Geraci (@NateGeraci) June 28, 2024
However, in a recent communications on 29th June, the U.S. The Securities and Exchange Commission returned the S-1 documents proposing some changes and asked the issuers to resubmit by 8th July.
Now, if the Ethereum ETFs are approved by 8th July by US SEC (Securities and Exchange Commission), It might bring a new era in the process of crypto adoption. As would be expected, these changes won’t only affect Ethereum, but cover the entire crypto industry spectrum.
Can Ethereum Continue To Recover Or Slump Again?
The panic selling seemed to be taking a pause today after the markets took a rebound from the previous day's low. Despite Ethereum having reclaimed back the psychological $3000 mark, the price still hovers below the 200 day exponential moving average indicating a possible comeback by the bears.
Now, if the bulls make a comeback above the 200 day EMA it may indicate a bullish continuation and the price may head for a recovery. The transaction volume has dropped by 44% to $16.2 Billion a day indicating the waning interest of the sellers.
Moreover, until the Ethereum price hovers below the 200 day EMA, it may be at a risk of another selloff. on the lower side, the $2850 level may act as a strong support which if breaks may unlock price failure towards the $2500 levels.
What’s Next For Ethereum?
The cryptocurrency market seemed to be stabilizing after a sharp decline in the last couple of sessions, with Ethereum reclaiming back the $3000. As per a few analysts, the pending approval of Ethereum ETFs by the SEC could restore market optimism. If approved, it could mark a significant step in crypto adoption.
Furthermore, Ethereum price has recovered from the lows however it still hovers below the 200-day EMA. A positive crossover of price above the 200 day EMA could signal a bullish trend. Transaction volumes have decreased, suggesting reduced selling pressure. However, At the current levels ETH crypto faces risk of further sell-offs until it stays below the 200-day EMA, with $2850 as critical support.
Search in ideas for "ethereum"

Ethereum ETF Probably Delayed To 2nd Week of July or Later By SEEthereum ETF Probably Delayed To 2nd Week of July or Later By SEC
The U.S. Securities and Exchange Commission has provided feedback on the S-1 filings and has called for them to be resubmitted by July 8.
This could postpone the debut of the spot Ether exchange-traded fund.
In the latest communications, The U.S. Securities and Exchange Commission has returned back the S-1 documents to the entities proposing Ethereum ETFs, indicating a continuation of the review process prior to being effective.
Earlier, the Ethereum ETF was anticipated to be launched by 2nd June. However, the recent remarks made by the SEC could further delay the process. As of Now, the applicants are required to revise their submissions in response to the SEC's comments and resubmit by July 8.
The recent development hints at a probable extension of the approval timeline, necessitating at least an additional round of filing before the ETFs can be listed officially and commence trading.
Prospects of Additional Delays Loom Over Decisions
However, SEC has set a deadline for the resubmission of the applications for the Ethereum ETFs, yet few analysts believe the delay in the commencement of Ethereum ETFs could last longer.
Fwiw, Bloomberg's @JSeyff saying week of July 8th looks more likely for spot eth ETF approval...Another source said "it’s also a possibility that it could be later in July or later in the summer."My take? It shouldn't take this long.via @KathieOD_PI pic.twitter.com/M9LVhfa9vd— Nate Geraci (@NateGeraci) June 28, 2024
Nate Geraci, who is the president of the ETF Store, mentioned in his tweet mentioning that July 8th might be the most likely for spot ETF approval. However, he further added that it could be later in July or later this summer pointing towards the further delay that might be on the horizon.
What’s Ahead For Ethereum?
Despite the news surrounding the Ethereum ETFs, the price of Ethereum did not witness any hiccups. As of now, Ethereum was exchanging hands close to $3385 recording mild intraday gains of 0.33%.
The daily chart reveals that Ethereum price has been trying to stabilize near the 50 day Exponential moving average. Despite weakness in the short term, the long term trend outlook still points towards a positive side.
Currently, the ETH price was experiencing a correction phase following a declining channel pattern. Now, until the price is maintained in the channel, it may continue to show weakness.
However, a breakout above the recent resistance of $3487 could mark the end of a correction and the ETH price may roar towards the $3800 and $4000 level again.

Ethereum Could Retrace $3300 If Looms Below This Interesting ZonEthereum Could Retrace $3300 If Looms Below This Interesting Zone
The daily ETH/USD chart highlights the formation of an interesting chart pattern.
Ethereum crypto has been under selling pressure for the last couple of weeks
A breakdown could add on the losses dragging the price near the $3300 level.
The Ethereum price seemed to be retreating from the highs in the last couple of weeks. The bears seemed to be returning back after a short bull run. The broader crypto market also seemed to be cooling down in the last month of the 1st half.
However the recent saw the Ethereum price stabilizing near a 50 day Exponential moving average. Also, the daily chart witnessed the formation of an interesting pattern. At the time of writing, the Ethereum price was hovering close to $3507 recording a moderate gain of 0.40%.
Furthermore, The analysts assume one more dip before a possible breakout of the correction phase. Also, there has been a significant development in the daily active addresses in the recent sessions.
Ethereum Crypto: Daily Active Address On the Rise!
Ethereum price saw almost 7% drop in the price this month which may increase if the bearish pressure extends. Despite the price drop, there has been a significant development in the active addresses count in the recent sessions.
As per the data obtained by a financial website app.santiment.net, the daily active addresses and 7-day active addresses count have reported a positive growth despite the price drop. The daily active address count has increased from 400.8K in the 1st week of June to 468K. whereas, the 7 day active address count has jumped from 21.8 million to 2.47 Million.
The active address count reveals the number of unique addresses which are involved in transactions over a given period of time. An increased count in the active addresses generally indicate a possible price surge.
Analysts Anticipate One more Dip in ETH!
The daily ETH/USD chart highlights the formation of a symmetrical triangle pattern with the price currently resting near the psychological $3500 level. Any breakdown could further drag the price towards the next major supply of $3300.
On the contrary, if the price surpasses the upper trendline resistance of the pattern, it may indicate a breakout of the correction phase. On the higher side breakout, the bulls may look to surpass the upper levels of $3700 and $3800.
The technical indicator RSI as well as the 14 day SMA line has dropped below the mean line indicating weakness on the charts.
Conclusion.
Ethereum price has been declining in the last couple of weeks, however, the number of daily and weekly active addresses has risen, suggesting increased network activity which could hint at a future price increase.
Moreover, The ETH/USD chart shows the formation of a symmetrical triangle pattern, with the price near the key $3500 level. A drop below this could lead to a decrease towards $3300, while a rise above could signal an end to the correction phase and a potential increase towards $3700-$3800. The RSI and 14-day SMA indicators suggest current market weakness, as both have fallen below the mean lines.

Ethereum Price Slips Further On 4-H ChartEthereum, the world's second-largest cryptocurrency by market capitalization, has been in the spotlight due to recent turbulence in the broader crypto market. Over the past 24 hours, Ethereum's price has fallen by almost 4.62%, causing concern among investors and underscoring bearish sentiments for the asset. At present, it is trading at $3,059, and the volatile price action of the asset aligns with derivatives data, which suggests that market sentiment is bearish.
Coinglass has reported a 4.95% decrease in the ETH token's open interest, and derivatives volume has also plummeted by 51.55%. This data indicates a strong bearish sentiment among investors and traders, which has raised concerns about a potential price correction for Ethereum in the future. Furthermore, the profit-taking behavior during the post-halving rally further reinforces this sentiment.
Daily Chart Analysis Of Ethereum Price
Looking at past price structures over the daily chart, Ethereum's price has seen a massive upsurge, favoring the bulls. The price rose from the demand zone near $1535 by the October 2023 support level and rallied up to $4100 by March 11th, 2024.
However, after reaching its peak, the price fell into a wedge and started making lower lows and highs after March 12th as bulls lost their traction on the daily chart.
Ethereum Price Slips Further On 4-H Chart
In the 4-hour time frame, despite the significant decline, Ethereum still shows bearishness and falling capacity as it slides below the considerable trend in the 20-day and 50-day EMA bands. If sellers continue to surge, the drastic decline could extend even further.
Likewise, the Ethereum asset is showing bearish momentum as MACD shows a bearish crossover, and the RSI is falling steadily at 33.29, indicating that the ETH asset is not gaining steam and can continue to drop lower.
Therefore, Both derivative factors and technical indicators influence Ethereum's price movements. The breakdown from the rising wedge pattern on the 4-H chart highlights bearishness.
On the downside, Ethereum has support near the $3,066 level, with additional support levels at $3,030 and $2,830. A breach of these support levels might lead to further downside, with the price potentially testing the lower trend line of the wedge in the near term.
For the upstream, Ethereum's first major hurdle is near the $3,250 mark. Beyond that, the key resistance levels are observed at $3,191, $3,288, $3,338, and $3,359. A breakthrough above these levels could signal bullish momentum, potentially driving the price toward the $3,681 and $3,751 resistance zones.

Ethereum Analysis 🔥🔥🔥Ethereum Price Prediction 2022
The above chart of Ethereum laid out the Horizontal channel pattern. Horizontal channel pattern also known as the sideways trend. In general, the horizontal channel is formed during the price consolidation. In this pattern, the upper trendline, the line which connects the highs, and the lower trendline, line which connects the lows, run horizontally parallel and the price action is contained within it. A horizontal channel is often regarded as one of the suitable patterns for timing the market as the buying and selling points are in consolidation.
Currently, Ethereum is in the range of $1215. If the pattern continues, the price of Ethereum might reach the resistance levels of $1285 If the trend reverses, then the price of Ethereum may fall to $1205
Happy Trading

Ethereum Classic : Bullish CandleEthereum Classic (ETC) Price Prediction 2022
Ethereum Classic (ETC) holds the 23rd position on CoinGecko right now. ETC price prediction 2022 is explained below with a daily time frame.
The above chart of Ethereum Classic (ETC) laid out the Horizontal channel pattern, also known as sideways trend. In order to indicate how the price is constrained between the upper line of resistance and lower line of support, horizontal channels are trend lines that join changeable price highs and lows.
Currently, Ethereum Classic (ETC) is in the range of $26.40.
>If the pattern continues, the price of ETC might reach the next measured level $49.87 ( Breakout Confirmation Still Pending)
>If the trend reverses, then the price of ETC may fall to $19.36 and & $13.50
From the above daily time frame, we can clearly interpret the following as the resistance and support levels of Ethereum Classic (ETC).
Resistance Level 1 $26.15
Resistance Level 2 $37.03
Resistance Level 3 $51.71
Support Level 1 $18.39
Support Level $12.90
ETC Resistance & Support Level
The charts show that Ethereum Classic (ETC) has performed a bullish trend over the past month. If this trend continues, ETC might run along with the bulls overtaking its resistance level at $51.71.
Accordingly, if the investors turn against the crypto, the price of Ethereum Classic (ETC) might plummet to almost $12.90, a bearish signal.

Ethereum Whales UpdateEthereum Whale Account Transacts 100,000 ETH Coins Amid Price Dip.
Ethereum, the world's second-largest cryptocurrency, has fallen sharply in price over the last few days. Amid the dip, an ETH whale has transferred a significant amount to an unknown wallet. The value of the transaction — 100,000 ETH coins, around $181 million (roughly Rs. 13,500 crores) — was highlighted by Whale Alert, a blockchain tracker and analytics company. Hours after the transaction, Ethereum has been showing an upward trend, gaining more than 6 percent in just 24 hours. Given the positive market trend, the person who bought the digital coins stands to benefit hugely from the transaction.
In the world of finance, a “whale” is an entity with enough power to impact the market of an asset by triggering massive transactions. However, the main issue with whale accounts is that they often accumulate billions worth of digital coins, allowing them the capability to influence the cryptocurrency market single-handedly.
According to data published by Whale Alert, the transaction took place around 9:30 PM (IST) on Monday. At that time, Ethereum price was around Rs 1.36 lakh. However, in the past 24 hours, the crypto coin has gained more than 6 percent in value, showed Coinbase data.
In a similar large transaction earlier in June, a cryptocurrency whale had transferred 50,000 ETH coins “from unknown wallet to unknown wallet”, Whale Alert had reported.
Ethereum, the Bitcoin rival, has an estimated market capitalisation of Rs 16.2 trillion, according to Coinbase. The recent fall in its price has been partly attributed to one of its co-founders quitting the cryptocurrency industry.
Anthony Di Iorio, who helped build Ethereum in 2018, said he was quitting the cryptocurrency ecosystem because he wants to solve “large problems”. The 48-year-old told Coindesk that he doesn't want to be known “as a crypto person”, but instead wants to be known as a “problem solver”.
Di Iorio said he plans to sell his stake in Decentral, a blockchain startup, and move to "larger world problems". He's reportedly involved in Project Arrow, working on creating a zero-emission vehicle.

Breakout in ETHEREUMA Big Breakout has happened in Ethereum in weekly time frame.
The Coin shoul be holded for months to achieve its final target.
As price has reached all time high which is its first target.
Rest two targets are 7400 and 7700.
No SL should be placed as the coin should be acquired on holding basis.
Note: This analysis is for Educational Purpose Only. Please invest after consulting a professional financial advisor.

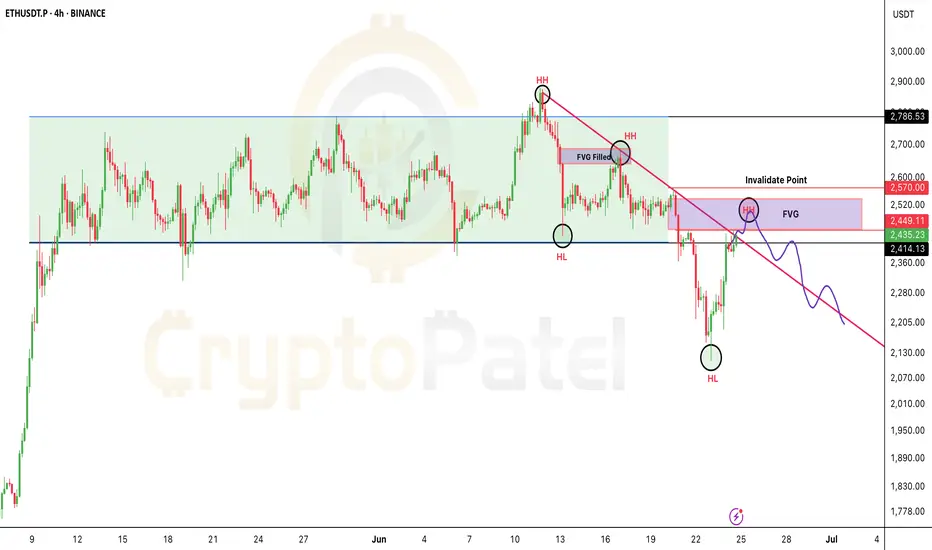
If you're shorting Ethereum, watch $2570 closely.If you're shorting Ethereum, watch $2570 closely.
If a candle closes above $2570, that invalidates the short — time to exit.
Why?
Because above this level, the risk/reward flips against you.
Better to wait for a cleaner entry with less risk, more reward.
Target: $2000
Retweet if this helps your trade plan.
NFA & DYOR
Will Ethereum Break $1875 Resistance this Time?🚨 BREAKOUT WATCH: If Ethereum breaks above the key $1875 resistance, it opens the door for a bullish rally toward $3000 in the coming weeks.
Strong breakout = high momentum setup.

Will Ethereum Drop below $1000 or Hit $10,000 in This Bull Run?One Golden Rule in Trading: Always buy the dip on fundamentally strong projects with 5x–10x potential in the near future.
Patience + conviction = profits.
#Ethereum CRYPTOCAP:ETH

Ethereum (ETH/USD) – Major Breakout Brewing?Ethereum is at a critical juncture, consolidating within a range that could trigger a massive move soon. The price structure is showing signs of a potential breakout, with a $6,000+ target if bullish momentum takes over.
🔍 Key Technical Observations:
✅ Triple Top or Trap? – While a triple top is visible, a breakout invalidates it, fueling a rally.
✅ Descending Triangle Breakout? – If ETH breaks the downward trendline, momentum could explode.
✅ Range Box Decision Zone – A clean break above resistance opens doors for a parabolic run.
📊 Levels to Watch:
🔹 Breakout Above: $3,500 - $4,000 → 🚀 Targeting $6,000+
🔹 Support Zone: $1,800 - $2,000 (If this holds, bullish structure remains intact)
🔹 Breakdown Risk: Below $1,800, ETH could dip to $1,200 or lower.
🔥 What’s Next?
A weekly close above $4,000 could trigger an aggressive bull run.
Bulls must defend the $2,000 zone to avoid bearish momentum.
Watch for volume confirmation—a breakout with strong buying pressure will be the key signal.
📌 Final Take: Ethereum is approaching a major move. If the breakout happens, $6,000+ is in sight. Eyes on resistance levels! On the flip watch the downside too .
#Ethereum #ETHUSD #Crypto #Breakout

Ethereum at a Critical Turning Point: Head & Shoulder PatternEthereum Technical Chart Study
Ethereum is showing some interesting price action. It recently took resistance from its resistance zone and is now forming a classic Head & Shoulder pattern—a structure often signaling potential reversals.
Currently, the price is sitting right at the neckline of the Head & Shoulder pattern. If this neckline breaks, it could lead to further downside movement.
Looking below, there’s some key support to watch:
1. The 2800 resistance zone, which Ethereum broke out of earlier, hasn’t been tested yet. This zone might now act as a strong support if the price moves downward.
2. There’s also a trendline support in play, adding another layer of potential price stability.
So, what’s next?
If Ethereum breaks the neckline, we could see the price fall towards the 2800 zone or possibly to the trendline support. These are the levels to keep an eye on for the next big move.

Ethereum Targets Breakout Above $3,583Ethereum (ETH/USDT) is trading at $3,420.84, up +2.89%, forming a cup-and-handle pattern, a bullish signal. Key resistance at $3,583.36 marks the breakout level, with potential upside to $4,000 if cleared.
A short-term pullback to the $3,014–$2,831 support zone (handle phase) is possible before a breakout. Moving averages support the bullish trend, as ETH remains above key levels.
Traders should watch for a high-volume breakout above $3,583 for confirmation, as Ethereum shows strong potential for further gains in the near term.

Ethereum's Path Ahead: Consolidation or New Highs?Ethereum (ETH) recently broke out of its prolonged consolidation phase, currently trading above $3,100, reflecting significant bullish momentum. After reaching its recent peak, ETH appears to be stabilizing near the $3,050 support level, hinting at a possible continuation of its upward trend.
Technical indicators suggest that Ethereum is forming a potential accumulation phase around its current levels. A break above $3,150 could open the door for a retest of higher resistance levels, possibly targeting $3,300 or beyond. Conversely, failure to maintain support near $3,050 might lead to a short-term pullback, bringing prices closer to $2,900.
Traders are advised to monitor key levels and volume activity closely, as the next breakout could define Ethereum’s trajectory in the coming weeks.


Ethereum triple top trendEthereum's triple top trend, three repeated tops, a similar pattern to the 2018 top and the 2024 top, a downward trend with three tops, the three pink arrows are the past tops, and the long pink line is the final downward trend. The final plunge is still in progress, following the pink line downward to create a new bottom low price, Ethereum will reach a lower price, this cannot be verified in a few days, and it will take several months to see the final effect.

Ethereum Set for Takeoff: Accumulate Now for a $10k+ TargetEthereum Update: A Great Time to Accumulate
Ethereum is looking solid for accumulation right now. The best buying range is between $2500-$2000, and if the price dips further, it could be a fantastic chance to grab ETH at a discount.
➡️ My Move: I’ve bought a large amount around $2200 and I’m holding it in spot, not in a leveraged position, aiming for $10,000+.
Key Support:
➡️ $2000 is a strong support level, and we’ve recently seen a bounce from this area.
➡️ Next Steps: The first big resistance is at $4000. If ETH breaks through this level with strong volume, we could see it soaring towards $10,000.
➡️ My Targets:
$6000
$8000
$10,000
$12,000+
Anything above $10,000 will be a sweet bonus!

Ethereum Technical Analysis Update#Ethereum Technical Analysis Update
Chart Pattern: Bull Flag Formation
Ethereum is showcasing a classic bull flag pattern on the ETH/USDT chart. This is often a bullish continuation pattern, indicating potential upward momentum if the market conditions align.
Key Breakout Level: $3,250
If Ethereum breaks and holds above the $3,250 resistance level, we are likely to witness a significant rally. A successful breakout could potentially set CRYPTOCAP:ETH on a path to a new all-time high! Keep an eye on this crucial level for decisive moves.
Support: $2,750
Resistance: $3,250
Trade Wisely and Always Use Stop Loss.

Potential 5% Drop in Ethereum Price Amidst Transition from PoW t
Ethereum's price is currently above a crucial support level at $2,147, maintaining a bullish outlook.
Bears are gaining strength, as indicated by the Relative Strength Index (RSI) below 50 and red bars on the Awesome Oscillator (AO) moving towards zero.
The Moving Average Convergence Divergence (MACD) shows positive histogram bars but had previously crossed below the signal line (orange band).
If selling pressure increases, Ethereum might drop 5%, breaking the $2,147 support and testing a bullish barrier from $2,048 to $2,107.
A further decline below $2,075 would confirm a continued downtrend, with a worst-case scenario testing support at $1,935, representing a 10% drop from current levels.

Ethereum ETH triple bottom head and shoulders bottom bull marketEthereum ETH triple bottom head and shoulders bottom bull market surge trend. Ethereum has two forms at the same time. It is a triple bottom and a head and shoulders bottom. It is an epic bull market surge trend. The main target is the green line above. As long as it breaks through 2100, it will reach 4000, soaring to the ultimate target of 6000/8000.

Ethereum Perspective.Ethereum is the second largest crypto in the world and one of the safest too after Bitcoin. It will be important to see how Ethereum plays out in the next Bull run.
POI for Ethereum remains at 1615-1738$.
There are 2 scenarios building up one has a different path to play out and other too has a different path.

Ethereum/USD Uptrend movement potential with RISK:REWARD 2.46Ethereum/USD Uptrend movement potential with RISK:REWARD 2.46
Symbol Ethereum/US dollar
Time frame :4 hours
Analysis :There is a break out from the symmetrical Triangle and the price is rallying on the up side .So, We will check the condition for Uptrend movement .Moving average ,MACD and PIVOT point condition is checked for uptrend movement. BUy call above 2025 which stop loss 1856 and we can expect a target of 2433.
HOPE our analysis is adding value to your Trading Journey.
NOTE: Published Ideas are for ‘’EDUCATIONAL PURPOSE ONLY’’ trade at your own risk.
NOTE: RESPECT The risk. SL should not be more than 2% of the capital.
Happy Trading
