BTC's Next Move: Bullish or Bearish? Key Levels to WatchIn this video i shared my thoughts about CRYPTOCAP:BTC , CRYPTOCAP:ETH , CRYPTOCAP:USDT.D , CRYPTOCAP:BTC.D , BITSTAMP:ETHBTC and usa markets , what is my next step clearly explained.
Search in ideas for "ethusd"

Ethereum 1D Update- The real bottom for Ethereum is in and I do not think Ethereum is going to fall any further
- After BTC ETF Approval too we saw BTC Crashing 20-30% and the same is happening with Ethereum as well
- Ethereum point of interest should be 2700-2850$
- Any underneath that things can get very scary IMO
- As long as your horizon is long term you shouldn't get bothered much at all
- For short term traders you can look for swing around 2800$

Ethereum Technical Analysis- Ethereum is currently trading in a zone where there's not much to do
- Price action still shows we can see some more retracement
- We need a matured base to look for upside targets
- The current upside trend looks weak and ETH is underperforming BTC
- Ethereum will only turn bullish once we see a candle closing above 3600$
- Manage risk and watch out for better confirmations

Ethereum 1D Update - Ethereum ETF has been approved and started trading now post the approval ETH is down 10% in 2 days already
- Ethereums retracement is going to be repurchased in bulk because Institutions will be looking for cheap prices
- Ethereum can add great value to your Portfolio if your allocation size is good
- Ethereum can soon print new highs quickly


$ETH Daily ChartCRYPTOCAP:ETH limit orders are set to be filled below $2800-$2700
Fill me, silly bears!

ETH/USD Ready to Break $4000? Key Levels to WatchEthereum (ETH) is gearing up for a significant move, but first, it needs to overcome the substantial liquidity wall at $3700. This level poses a critical resistance that must be cleared before we can set sights on the $4000 mark. If ETH can break through $3700 with strong volume, the path to $4000 becomes much more attainable. However, there's a possibility of a pullback to form a double bottom before making a decisive breakout.

Etherem ready for Big Pump ?#Ethereum Chart Analysis
#ETHUSDT is currently trading within a bull flag/parallel channel. We're waiting for a breakout before entering any trades.
- Bearish Scenario:
If CRYPTOCAP:ETH breaks down below the support level at $3650, we might see a decline toward $3152, which is the last Fair Value Gap (FVG).
- Bullish Scenario:
If #ETH holds the $3152 level, we could see an upside move toward $4000.
A break above $4000 resistance could trigger a strong bullish move toward the $6000-$7000 range.
Let's watch closely and stay updated on the price action.

CRO longforming bullish hammer and RSI is also 30 which indicate the market is oversold for this coin..
Buy 0.1050 target 0.16 almost 20%

#ETH DOUBLE BOTTOM GEARS TO 4100$#ETH FORMED DOUBLE BOTTOM & slight bullish divergence conforms to clear 4100$ resistance.

ETH WILL GIVE A MOVE, SEE ITJust see the upper move
Educational purposes only
According to me it will give a great move in few days

#Ethereum Breakout: Will ETH ETF Decision Propel Prices to $6000#Ethereum Eyes Breakout: Will ETH ETF Decision Propel Prices to $6000?
CRYPTOCAP:ETH is showing bullish signs with a falling wedge/bull flag pattern and a strong bounce off support.
ETH ETF decision on Thursday. Deadlines for 4 ETF issuers are at the end of this month, starting May 23rd.
Potential Targets:
- Approval: #ETH could soar to $5000-$6000.
- Rejection: ETHUSDT might drop to $2500-$2000.
Conversely, a rejection, especially if based on the classification of tokens as securities, could lead to a downturn in ETH and #DeFi assets.
Strategy: Consider a spot long position, but avoid excessive leverage due to potential volatility.
Stay informed and trade smart.

#Ethereum Eyes Retest: #ETH/USDT Key Levels to Monitor#ETH/USDT situation, focusing on the potential retest levels due to decreasing volume and the formation of a bearish shark pattern:
#ETH/USDT Analysis: Decreasing Volume and Bearish Shark Pattern Indicate Potential Retest Levels
### Decreasing Volume
Volume is a crucial indicator of market strength. When the price of an asset rises while the trading volume decreases, it often suggests that the upward momentum is losing steam. In the case of ETH/USDT, the decreasing volume indicates that the buying pressure is weakening, which may limit the potential for reaching higher price targets.
### Bearish Shark Pattern
The bearish shark pattern is a harmonic pattern that signals a potential reversal or correction in the price of an asset. This pattern typically consists of five points labeled as O, X, A, B, and C, and follows specific Fibonacci retracement and extension levels.
For ETH/USDT, the formation of a bearish shark pattern suggests that the price is likely to face resistance and could be due for a retest at lower support levels. The bearish shark pattern, combined with the decreasing volume, strengthens the case for a potential pullback.
### Potential Retest Levels
Given these technical indicators, ETH/USDT might retest certain key support levels:
1. **Retest Around $3,030**
- This level has acted as a significant support in recent trading sessions. If Ethereum's price retraces, it is likely to find initial support around $3,030. If the price manages to hold at this level, we might see a temporary bounce or consolidation.
2. **Retest Around $3,025**
- If the $3,030 support level fails to hold, the next critical support level to watch is around $3,025. This level has historical significance and could act as a stronger support. A retest at this level would be crucial in determining whether ETH/USDT will stabilize or continue its downward trend.
#Conclusion
#ETH/USDT is currently showing signs of potential weakness with decreasing volume and the formation of a bearish shark pattern. Traders should be prepared for possible retests at $3,030 and $3,025. Monitoring key technical indicators and market sentiment will be crucial for making informed trading decisions during this period.

#ETH/USDT Rebound: Analyzing the Recent Price SurgeThe #ETH/USDT pair has recently displayed a bullish divergence, a key technical indicator suggesting a potential trend reversal. This divergence, coupled with the breakout of a significant trend line, has ignited bullish momentum in the market.
Currently, the price is undergoing a retest of two critical levels at $3065 and $3220. The successful breach of these levels could pave the way for a new all-time high for Ethereum.
One major catalyst for this bullish outlook is the anticipation of #ETF approval for Ethereum. If approved, this could attract significant institutional investment, further driving up the price of #ETH.
It's essential to monitor price action around these levels closely, as a decisive move above them could signal a sustained bullish trend for Ethereum.

#ETH/USDT Bulls in Control#ETH/USDT pair has recently formed a double bottom pattern, finding significant support within a crucial trend box area. This pattern suggests a potential reversal of the previous downtrend and signifies a bullish sentiment in the market. With the double bottom formation in place, Ethereum is likely to experience upward momentum, aiming to retest the $3000 resistance level. Traders and investors are closely monitoring this development, anticipating a continuation of the bullish trend as Ethereum moves towards challenging key resistance levels. This pattern highlights a shift in market sentiment, with buyers gaining confidence and driving the price higher in anticipation of further gains.

Ethereum Technical Analysis Update#Ethereum Technical Analysis Update
Chart Pattern: Bull Flag Formation
Ethereum is showcasing a classic bull flag pattern on the ETH/USDT chart. This is often a bullish continuation pattern, indicating potential upward momentum if the market conditions align.
Key Breakout Level: $3,250
If Ethereum breaks and holds above the $3,250 resistance level, we are likely to witness a significant rally. A successful breakout could potentially set CRYPTOCAP:ETH on a path to a new all-time high! Keep an eye on this crucial level for decisive moves.
Support: $2,750
Resistance: $3,250
Trade Wisely and Always Use Stop Loss.

ETHEREUM WANTS TO GO UPAlts are totally depending on two factors, viz. BTCDOM & ETH, and both are not currently in situations that alts can go up. Ethereum needs to go up to 3500 level ve4y soon.

#ETHEREUM Chart Update #ETHEREUM Chart Update
CRYPTOCAP:ETH is currently testing its support level.
We're keeping an eye on it!
If it falls below this support, it might not look good for the market for a bit.
I think we might see a lot of ups and downs leading up to the halving.
Stay tuned!
#ETH #Altcoins

#ETHEREUM READY FOR NEW ALL TIME HIGH #ETHEREUM READY FOR NEW ALL TIME HIGH
1⃣ Breakout Triangle Resistance & did Perfect Retest
2⃣ Also Formed Inverse H&S Pattern NECKLINE Breakout & Retest Done
3⃣ CRYPTOCAP:ETH Must Hold $3450 Support for New ATH
4⃣ Next Targets Would be $4068/$5000
5⃣ Always Use Stop Loss as per your Risk Reward Ratio
Share/Comments if you agree with My Setup.
NFA

When Hifi follow RWA hype ?Hifi BYBIT:HIFIUSDT.P
This is one of RWA coin and consolidate since longer time and it can pump and follow RWA hype anytime IMO
Keep an eye on this

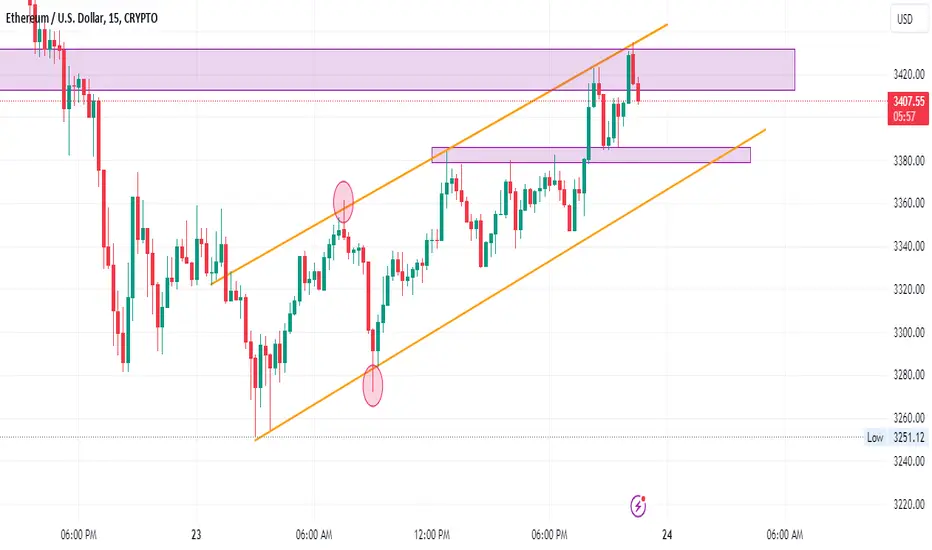
Ethereum is Critical levelEthereum Critical level, Ethereum is at important level and Forming a Channel Pattern Let's see this sustain or not. what is your view please comment it down. We are NISM Certified. All views shared on this channel are my personal opinion and is shared for educational purpose and should not be considered advise of any nature.
Solana market dominance This price action shows the dominance of solana in crypto market
So its breaking out is all time high dominance.. solana can be bought for long term investment

