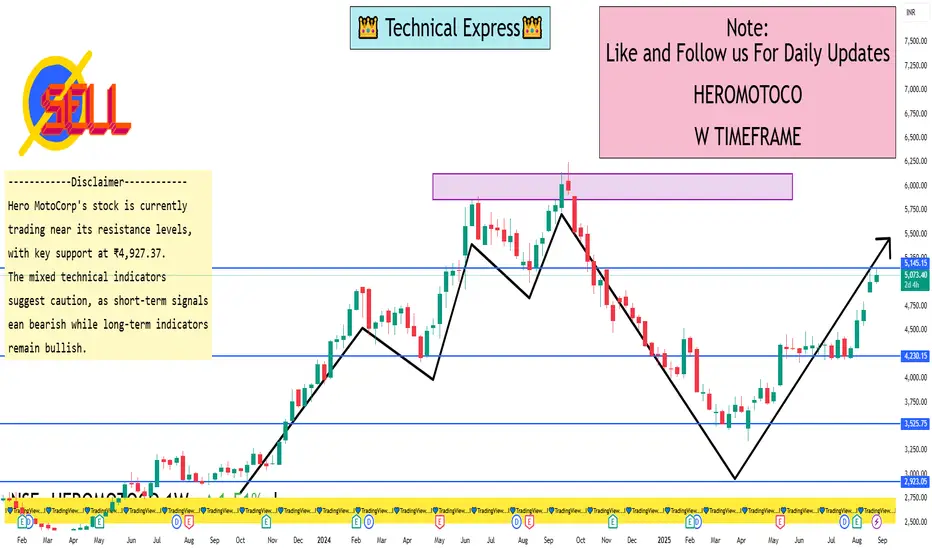
Heromotoco Ltd 1 Week ViewWeekly Support & Resistance Levels
Immediate Support: ₹4,927.37
Primary Support: ₹4,683.00
Immediate Resistance: ₹5,039.60
Primary Resistance: ₹5,216.60
These levels are derived from standard pivot point calculations and can serve as potential zones where the stock might experience buying or selling pressure.
Technical Indicators
Relative Strength Index (RSI): 67.39 – Neutral
MACD: 201.20 – Sell
Stochastic RSI: 89.90 – Sell
Moving Averages:
5-day: ₹5,066.46 – Sell
20-day: ₹4,624.92 – Buy
50-day: ₹4,408.96 – Buy
200-day: ₹4,125.66 – Buy
The overall technical outlook is mixed, with short-term indicators showing a sell signal and longer-term indicators indicating a buy.
Search in ideas for "macd"
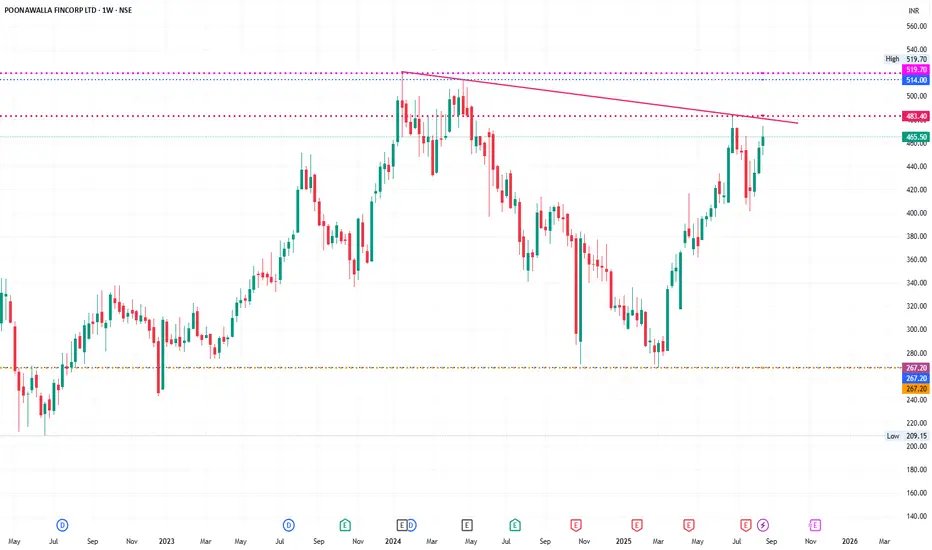
Descending Triangle / Falling Trendline Resistance step-by-step technical analysis of Poonawalla Fincorp Ltd (Weekly Chart) the same way:
🔎 1. Chart Pattern
The stock is currently forming a Descending Triangle / Falling Trendline Resistance.
Price is approaching the trendline resistance (~₹480–485).
Breakout above ₹485–490 will confirm trend reversal.
If rejected, it may retrace back to lower supports.
🔎 2. Support & Resistance
Immediate Resistance: ₹483–490 (trendline + horizontal supply).
Next Resistance Levels: ₹514 → ₹520 (previous swing high).
Major Resistance: ₹550.
Immediate Support: ₹440 → ₹420 (recent consolidation).
Major Support Zone: ₹365 → ₹340.
Long-term Support: ₹267 (very strong base).
🔎 3. Candlestick / Price Action
The last few weekly candles show strong bullish momentum, higher highs, and higher lows.
But approaching a major supply zone (~₹480–490) → possible profit booking.
A weekly close above ₹490 with volume will confirm fresh breakout rally.
🔎 4. Indicators Perspective
RSI: Likely near 65–68 → bullish momentum but nearing overbought zone.
MACD: Positive crossover with rising histogram → bullish confirmation.
Volume: Increasing on recent up-move → accumulation happening.
Moving Averages:
Price trading above 20W & 50W EMAs → trend bullish.
If it sustains above ₹485, 200W EMA breakout likely confirms long-term uptrend.
🔎 5. Trend Outlook
Primary Trend (1–2 years): Bullish, provided stock sustains above ₹490.
Intermediate Trend (2–6 months): Neutral to bullish, watch for breakout.
Short Term (1–4 weeks): Testing resistance zone ₹480–490, may consolidate.
📌 Conclusion (Expert View)
✅ Stock is in strong uptrend but at a crucial resistance (₹483–490).
✅ Breakout above ₹490 can lead to targets ₹514 → ₹520 → ₹550.
✅ If rejected, stock can pull back to ₹440 → ₹420 zone (buying zone).
⚠️ Risk-Reward currently not very favorable until clear breakout.
👉 Strategy:
Traders: Wait for weekly close above ₹490 to enter fresh longs.
If already holding, book partial profit near ₹480–490, re-enter above ₹490 breakout.
Investors: Can accumulate on dips to ₹420–440 with SL ₹365
this is only for educational purpose not for suggestion
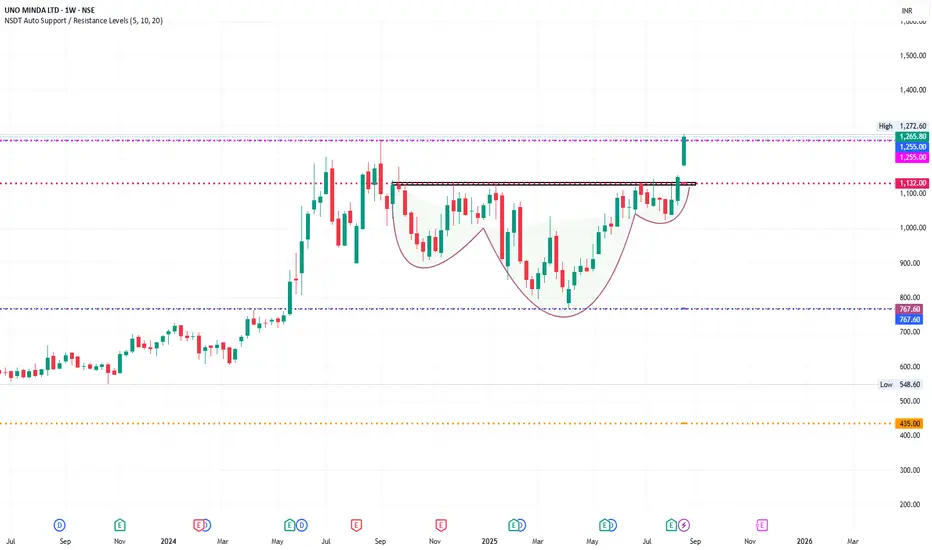
UNOMINDA -CUP & HANDLE BREAKOUT 🔎 1. Chart Pattern
The chart is clearly showing a Cup and Handle Pattern (highlighted).
Breakout has happened above the neckline (~₹1130–1140) with strong bullish candle.
Cup & Handle is a continuation pattern – breakout targets can be measured.
📌 Target Calculation:
Depth of the cup = 1132 (neckline) – 767 (bottom) ≈ 365 points.
Breakout above 1132 → Target = 1132 + 365 = ₹1495 approx.
Short-term resistance: ₹1270–1280 (already touched).
Next zone: ₹1350 → ₹1450 → ₹1500.
🔎 2. Support & Resistance
Immediate Support: ₹1130–1150 (previous neckline).
Strong Support Zone: ₹1050–1070 (previous consolidation).
Major Support: ₹767 (cup bottom).
Immediate Resistance: ₹1270–1280 (tested).
Major Resistance Levels: ₹1350, then ₹1495.
🔎 3. Candlestick / Price Action
Current weekly candle is long green, wide-range, high volume breakout → very bullish.
Closing above ₹1250 is confirmation of breakout.
🔎 4. Indicators (if applied)
RSI (Relative Strength Index): Likely crossing above 65–70 → shows momentum but not yet extreme overbought (healthy breakout).
MACD: Likely bullish crossover with histogram expansion.
Volume: Breakout candle with strong volume confirms institutional buying.
Moving Averages:
Price is above 20W, 50W, 200W EMAs → strong uptrend.
Golden cross already confirmed earlier.
🔎 5. Trend Outlook
Primary Trend (1–2 years): Strong Bullish.
Intermediate Trend (2–6 months): Bullish continuation towards ₹1450–1500.
Short Term (1–4 weeks): May retest ₹1180–1200 before further rally.
📌 Conclusion (Expert View)
✅ Stock has given a Cup & Handle breakout above ₹1130 with strong momentum.
✅ Upside targets: ₹1350 → ₹1450 → ₹1500.
✅ Downside support: ₹1130, then ₹1050.
⚠️ Near-term, RSI may cool off → watch for pullback to ₹1180–1200 as entry opportunity.
👉 Strategy:
Swing Traders: Buy on dips near ₹1180–1200 with SL below ₹1050.
Investors: Can hold for long-term with next target ₹1500+.
This is only for educational pattern not for sugesstion.
EIEL 1 Day ViewPrice Action Snapshot (22 Aug 2025)
According to Moneycontrol, the current day’s trading range for EIEL is ₹260.95 – ₹274.00.
Investing.com data confirms a real-time price of ₹268.30, with the same daily range and a 52-week range of ₹182.00–₹391.60.
Economic Times reports a 1-day return of +3.3%, with the current price around ₹268.05–₹268.30.
Technical Signals
TradingView labels the 1-day technical rating for EIEL as Neutral, based on a combination of oscillators and moving averages.
Investing.com India provides a more bullish interpretation:
RSI (14-day): ~69.38 — indicating a "Buy" zone.
MACD: 3.060 — a bullish signal.
All moving averages (5-, 50-, 200-day) are suggesting "Buy".
Overall, the daily technical outlook is “Strong Buy”.
What Does "L 1 Day Time Frame Level" Mean?
You might be exploring the technical level or sentiment over a 1-day timeframe for EIEL. From the data:
TradingView summarizes the technical indicators as Neutral.

GOLD 08/22 – BULLISH SCENARIO HOLDS STRONGGOLD 08/22 – BULLISH SCENARIO HOLDS STRONG
Gold’s uptrend remains intact – current pullbacks are opportunities to re-enter longs.
Market Context
Today, traders await the speech from the Fed Chair during the US session. Being Friday, liquidity is often tricky, so extra caution is advised in managing trades.
Additionally, attention is on the Jackson Hole Symposium, where comments may shape monetary policy expectations. As the exact tone cannot be predicted, risk management becomes even more important.
Technical Overview
Yesterday’s buy setup worked perfectly, with entries triggered and delivering nearly 200 pips profit.
The overall market structure remains bullish, with price retesting the 333x area but without confirmation of a downside reversal.
This suggests traders can reuse yesterday’s entry zones for fresh long signals, aligned with the medium-term uptrend.
Key Tools
EMA34–89–200: aligned bullish, price trading above major EMAs.
Fibonacci: retracement support at 3330 holds, strengthening the bullish case.
Trendline: price remains above the rising trendline, confirming structure.
MACD: still above zero, maintaining bullish momentum.
Elliott Wave: current move looks like a corrective pullback within an active upward wave.
Short-Term Scenarios
Bullish:
Buy 3328–3330 | SL: 3324 | TP: 3335 – 3342 – 3355 – 3374
Buy 3316–3318 | SL: 3311 | TP: 3325 – 3332 – 3342 – 3355 – 3376 (anticipating a possible fakeout).
Bearish:
Sell 3352–3354 | SL: 3359 | TP: 3345 – 3337 – 3325 – 3310
Sell 3372–3374 | SL: 3379 | TP: 3365 – 3352 – 3345 – 3333 – 3325
Reference Strategy
Bias remains bullish; focus on buy setups. Short trades only for quick plays at resistance zones.
Note
Friday trading can be volatile due to liquidity issues.
During Jackson Hole Symposium, reduce position sizes or stay out to avoid unnecessary risks.

GOLD 08/21 – BULLISH TREND CONFIRMEDGOLD 08/21 – BULLISH TREND CONFIRMED
Gold has confirmed its bullish momentum – today the market opens with strong upside potential.
Market Context
Gold surged yesterday and is now consolidating around the 334x zone, confirming the strength of buyers.
The Fed’s latest announcement kept rates unchanged, with the Chairman maintaining a cautious stance despite heavy political pressure from President Trump. Analysts agree that holding rates steady is necessary at this stage.
Currently, price is hovering near 3340 for liquidity collection. While some sell positions remain in the 332x–333x range waiting to exit, buying pressure is stronger, leaving many traders cautious but watching for confirmation of the trend.
Technical Overview
EMA34–89–200: All aligned bullish, confirming the uptrend.
Fibonacci & Trendline: Price holds firm above key levels, supporting continuation.
MACD: Expanding bullish momentum.
Elliott Wave: Ongoing wave structure shows room for further upside.
The bullish bias remains valid as long as price holds above the key support at 3312. Only a confirmed break below this level would negate the buy setup.
Trade Setups for 08/21
🔹 Buy Strategy (Priority):
Buy 3328–3330, SL 3324, TP 3336 → 3345 → 3355 → 3370
Buy 3316–3318, SL 3311, TP 3325 → 3336 → 3345 → 3355 → 3370
🔹 Sell Setup (Countertrend):
Sell 3369–3371, SL 3376, TP 3363 → 3355 → 3345 → 3333
Focus on scalping with the main trend to improve profit probability.
Watch price action carefully at 3312 (key support) and 3370 (resistance) for confirmation of the next move.
#Gold #XAUUSD #IndiaTrading #MarketAnalysis #ForexIndia #CommodityTrading #PriceAction

GOLD 08/20 – PRIORITISE SELL AS DOWNTREND DOMINATESGOLD 08/20 – PRIORITISE SELL AS DOWNTREND DOMINATES
pressure continues to guide the medium-term trend, with current pullbacks offering opportunities to enter short positions in line with the overall direction.
Market Context
The key focus today is the FOMC meeting minutes in the US session, mainly regarding interest rate policy. Market expectations for a rate cut in September are extremely high, making this release critical to assess whether the Fed signals any earlier move that could impact USD and gold sentiment.
Technical Overview
Gold has shown a sharp decline and broke through the 3325–3332 zone, which had previously acted as a strong reaction area. This zone now becomes major resistance.
The bounce at 3315 highlights a liquidity grab around the Nonfarm candle with low volume – a rational short-term reaction.
However, the medium-term structure remains bearish, meaning pullbacks into resistance are best viewed as sell opportunities.
Key Tools
EMA34–89–200: aligned in bearish formation, confirming downward momentum.
Fibonacci: recent retracement aligns with 3325–3332 resistance.
Trendline: price remains below the medium-term descending trendline.
MACD: staying below the zero line, maintaining bearish pressure.
Elliott Wave: the current corrective bounce may finish soon, allowing the next downward wave to continue.
Short-Term Scenarios
Bullish: Holding above 3315 could see a push towards 3330–3340 before sellers return.
Bearish: A rejection at 3345–3347 opens downside targets towards 3330 – 3315, and further to 3290.
Reference Strategy
Sell zone: 3345–3347 | SL: 3353 | TP: 3340 – 3330 – 3315 – 3290
Buy zone: 3278–3280 | SL: 3274 | TP: 3290 – 3300 – 3315 – 3325
Note
If entries coincide with the FOMC release, it is safer to stay out and observe due to potential volatility.
Hashtags
#Gold #XAUUSD #ForexIndia #Trading #PriceAction #FOMC #Fed

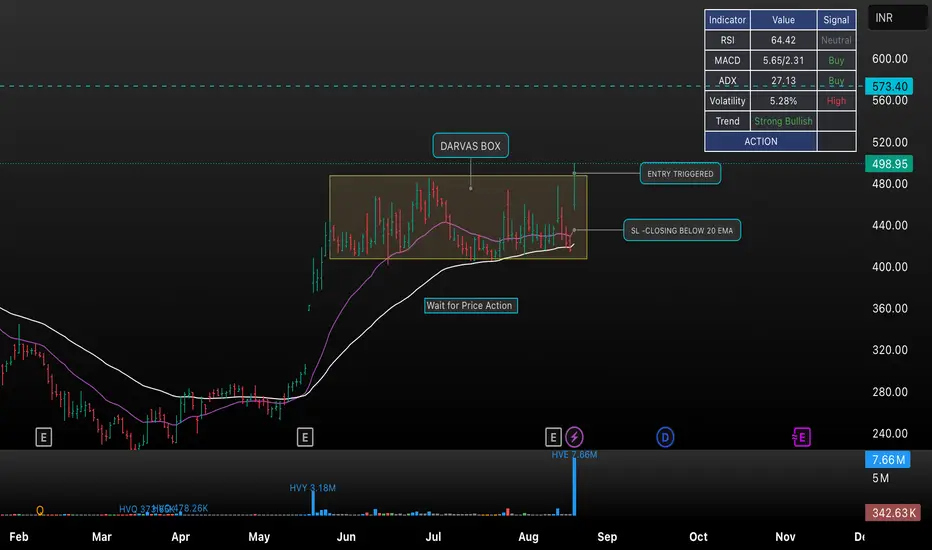
HLE Glascoat: Darvas Box Breakout & Momentum Trade SetupThis chart of HLE Glascoat (HLEGLAS) displays a Darvas Box consolidation followed by a breakout, indicating a strong bullish trend. Key trade signals:
• Entry Triggered: Breakout above Darvas Box
• Stop Loss: Closing below the 20 EMA
• Trend: Strong Bullish
• Indicators:
• RSI: 64.42 (Neutral)
• MACD: 5.65 (Buy)
• ADX: 27.13 (Buy)
• Volatility: 5.28% (High)
This setup is ideal for swing traders looking for momentum after consolidation. The clear action plan and risk management highlighted on the chart help traders confidently execute and manage trades.
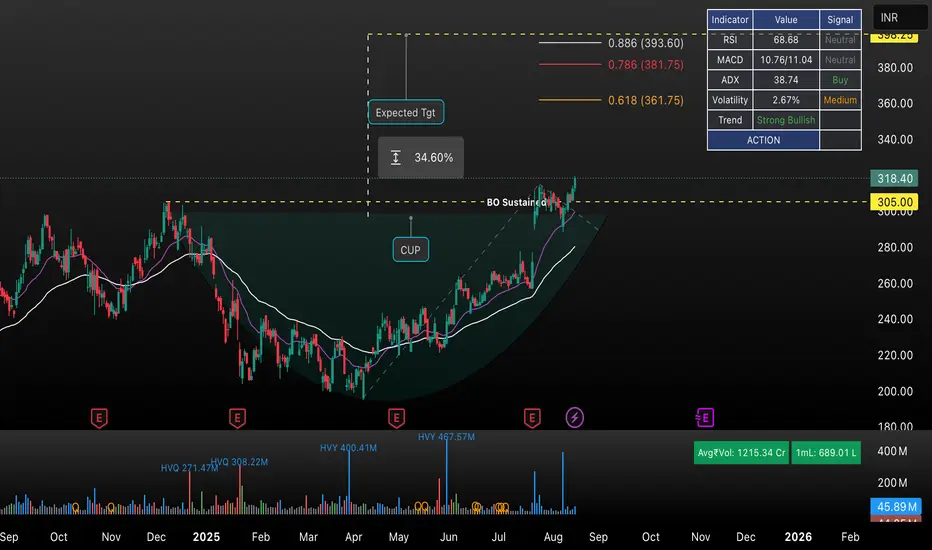
ETERNAL: Cup and Handle BreakoutThis chart presents a technical analysis of ETERNAL (ETERNAL) on the daily timeframe, captured on TradingView. A classic Cup and Handle pattern is identified, with a sustained breakout (BO Sustained) above the resistance at ₹305.00.
The projected upside (Expected Target) post-breakout highlights a potential move of approximately +34.6%, targeting the Fibonacci extension levels (0.618 at ₹361.75; 0.786 at ₹381.75; 0.886 at ₹393.60).
Indicators Panel:
• RSI: 68.68 (Neutral)
• MACD: Positive momentum
• ADX: 38.74 (Buy signal, strong trend)
• Volatility: 2.67% (Medium)
• Overall Trend: Strong Bullish
Key Technical Features:
• The breakout is accompanied by increased trading volume.
• 50EMA and 200EMA provide underlying support.
• Price action reflects strong bullish sentiment as per volatility and trend indicators.
This analysis is ideal for swing and positional traders watching for continued bullish follow-through after a classical pattern breakout.
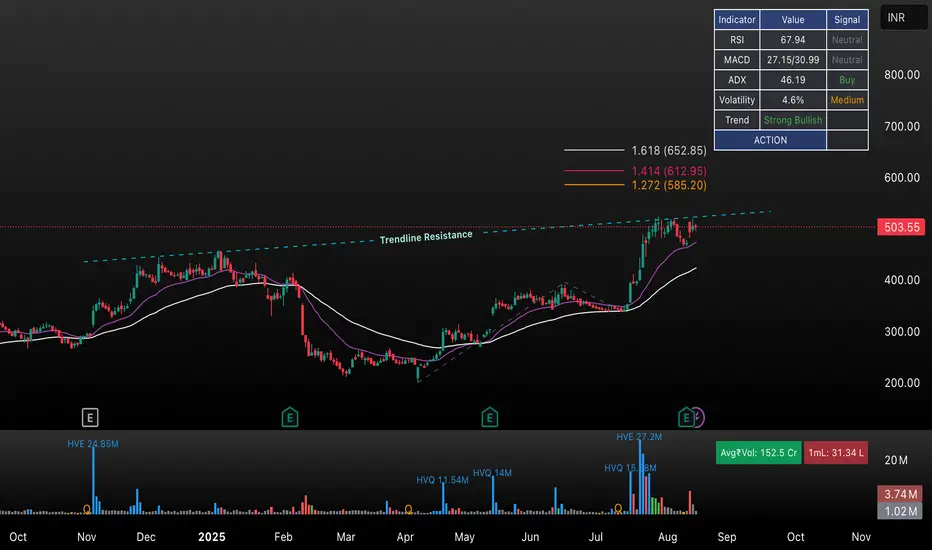
Technical Analysis of TI Stock with Trendline and FibonacciThis TradingView chart analyzes the price action of TI stock using key technical indicators and trend projections as of August 2025. The chart displays:
• Current Price: ₹503.55
• Technical Indicators:
• RSI: 67.94 (Neutral)
• MACD: 27.15/30.99 (Neutral)
• ADX: 46.19 (Bullish/Buy)
• Volatility: 4.6% (Medium)
• Trend: Strong Bullish
• Chart Features:
• Trendline Resistance: Marked above the current price, serving as immediate resistance.
• Fibonacci Extension Levels: Key levels indicated at 1.272 (₹585.20), 1.414 (₹612.95), 1.618 (₹652.85), highlighting possible future price targets after breakout.
• Moving Averages: Two major moving averages (likely 20 EMA and 50 EMA) supporting the uptrend.
• Volume Bars: Indication of recent high volume activities and possible accumulation.
• Market Sentiment: The overall trend remains strongly bullish, but the price is currently testing its trendline resistance. Short-term action depends on whether this resistance is broken or holds.
Summary:
This chart setup provides a comprehensive view for swing traders and investors, focusing on possible breakout levels, critical resistance zones, and momentum confirmation using multiple indicators. The bullish bias is validated by strong trend momentum and the positioning above moving averages, but careful watch is needed near resistance for possible pullbacks or breakout opportunities.
CUMMINS: Cup Pattern Breakout | Supply Zone Test & Strong ResultCUMMINS is showing a classic cup pattern, with price rallying into supply zone resistance at ₹3,893–₹3,900. Momentum remains strong, supported by positive recent results and robust technical signals.
Chart Highlights
• Pattern: Cup formation, price testing supply zone.
• Trend: Strong bullish, with medium volatility.
• Indicators:
• RSI: 72.3 (Overbought/Sell signal)
• MACD: 71.04/62.01 (Buy)
• ADX: 31.2 (Buy)
Price Levels
• Resistance (Supply Zone): ₹3,893–₹3,900
• Current Price: ₹3,806.90
• Support: ~₹3,700 (recent breakout)
Brief Result for This Quarter (Jun-25)
• EPS: 21.8 (+32% YoY)
• Sales: ₹2,906.8Cr (+26% YoY)
Strong quarterly growth shown in both earnings and revenue, supporting bullish momentum.
Action Plan
• Watch for a decisive breakout above ₹3,900 for fresh longs.
• Look for reversal signals near supply zone for short-term correction.
• Maintain tight risk management as price tests major resistance.
Summary:
Strong technical setup meets solid fundamentals. Potential for new highs if supply zone breaks, but cautious near resistance.

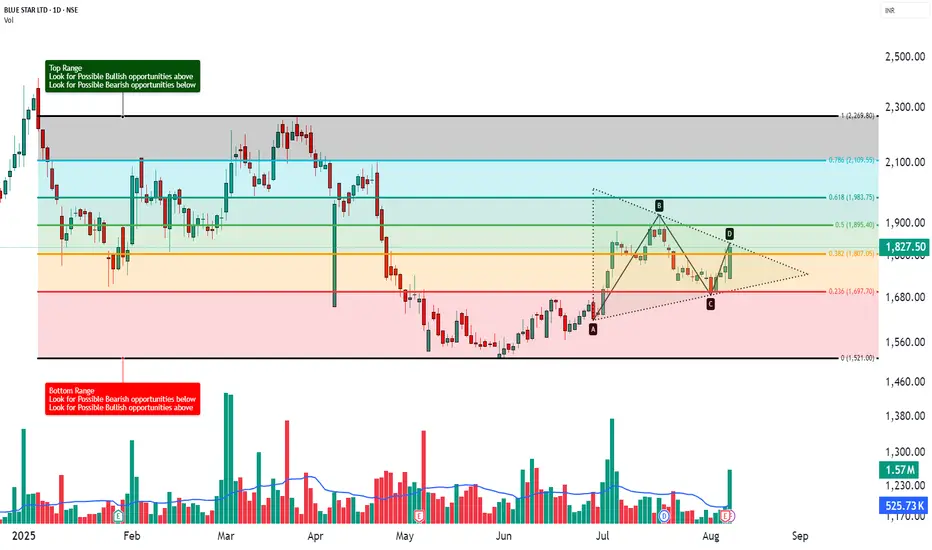
BLUE STAR LTD - Technical Analysis | Triangle Pattern ________________________________________
📊 BLUE STAR LTD – Beginner-Friendly Technical & Fundamental Snapshot
Ticker: NSE:BLUESTARCO | Sector: Consumer Durables
CMP: ₹1,827.50 ▲ (+3.23%) (as of August 7, 2025)
Chart Pattern: Symmetrical Triangle
Technical View: ⭐⭐⭐⭐ Neutral-to-Positive (Educational Purpose Only)
________________________________________
🔍 What’s Happening on the Chart?
BLUE STAR has formed a Symmetrical Triangle – a pattern where price moves within narrowing highs and lows 📉📈
This indicates consolidation and usually results in a strong breakout or breakdown.
📦 Triangle Range: ~₹1,616 to ₹1,922
👉 Current price is testing the upper edge — a breakout could be brewing!
________________________________________
🕯️ Candle & Indicator Analysis (Simplified)
Here’s what the chart and indicators show:
EMA 200 Crossover:
✅ Bullish signal – price is trading above its 200 EMA
RSI (~60):
🔼 Showing strength – not yet overbought
Stochastic (~92):
🚀 Near overbought – buyers in control
MACD:
⚠️ Still bearish – momentum confirmation is pending
VWAP:
✅ Aligned with bullish bias — suggests institutional support
📊 Volume Breakout:
🔺 Volume surged to 1.57 million, almost 3x the average of ~525.73k — a strong sign that big players may be stepping in as price nears breakout levels.
🧠 Trading Insight:
The chart looks bullish but still needs confirmation. Watch for a proper breakout above the triangle with volume.
________________________________________
📰 Recent News & Sentiment Update
Q1 FY26 Results (as of June 30, 2025):
📈 Total Income: ₹2,998.32 Cr (↑ 3.8% YoY)
💰 Net Profit: ₹122.23 Cr
(Source: Company Filings & Analyst Coverage)
Sentiment:
✅ Positive: Modest earnings growth, analyst support
⚠️ Caution: Target cut by some analysts — signals mixed expectations
________________________________________
🧭 Support & Resistance Levels
📌 Resistance Zones (Upside watch):
R1: ₹1,866
R2: ₹1,904
R3: ₹2,112 (measured move target)
📌 Support Zones (Downside watch):
S1: ₹1,750
S2: ₹1,680
S3: ₹1,616 (triangle base)
________________________________________
🔍 How to Trade a Symmetrical Triangle
A symmetrical triangle is a neutral pattern.
The breakout confirms direction:
– Above = potential upside 🟢
– Below = potential downside 🔴
📈 If Bullish Breakout Happens (above ₹1,860):
✅ Wait for a candle close above ₹1,860 with volume
🎯 Possible Price Zones: ₹2,000 → ₹2,165
🛑 Stop Loss: ₹1,750 (below triangle support)
📉 If Bearish Breakdown Happens (below ₹1,680):
✅ Wait for close below ₹1,680
🎯 Possible Price Zones: ₹1,500 → ₹1,375
🛑 Stop Loss: ₹1,750 (above triangle resistance)
________________________________________
🧠 STWP’s Educational Trade Idea (Not a Recommendation)
🎯 Long watch above: ₹1,839
🛑 Stop Loss: ₹1,719.50
📈 Risk-Reward Idea: Minimum 1:1; ideally aim for 1:2+
________________________________________
🔰 Trading Notes
✅ Always use stop losses
⏳ Be patient — wait for confirmation, not assumption
🚫 Don’t chase green candles or panic in red ones
📚 Trade based on structure, not emotions
💼 Risk only 1–2% of your capital per trade
🎯 Target minimum 1:1.5 Risk-to-Reward ratio
________________________________________
⚠️ Disclaimer (Read Carefully)
This post is for educational and informational purposes only.
The author is not a SEBI-registered investment advisor. No buy or sell recommendations are being made.
All views are based on chart patterns, publicly available data, and personal learning experience.
Trading involves risk. Losses can exceed your investment. Always consult a SEBI-registered advisor before making financial decisions.
By engaging with this content, you agree to these terms.
________________________________________
💬 Was this useful?
Drop your thoughts, questions, or setups in the comments below ⬇️ — let’s grow together!
🔁 Share this post with fellow traders and beginners to spread clean, structure-based learning.
✅ Follow simpletradewithpatience for beginner-friendly setups, price action insights, and disciplined trading content.
🚀 Stay Calm. Stay Clean. Trade With Patience.
Trade Smart | Learn Zones | Be Self-Reliant 📊
________________________________________
JIOFIN RETEST FOR LONG SIDETrend Breakout
Retest Possible
RSI (14) - 64.67 Neutral
MACD: 5.06 Sell
ROC: 4.13 Buy

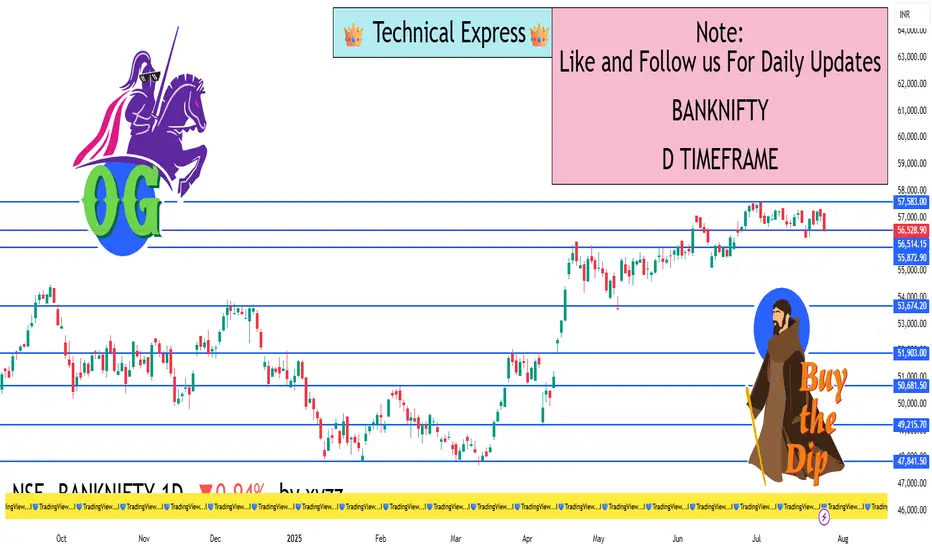
BANKNIFTY 1D TimeframeClosing Price: ₹56,528.90
Opening Price: ₹57,113.90
Day High: ₹57,170.70
Day Low: ₹56,439.40
Net Change: –₹537.15 (–0.94%)
🔹 Key Price Levels
📉 Support Zones:
Support 1 (S1): ₹56,255
Support 2 (S2): ₹55,982
Support 3 (S3): ₹55,524
Fibonacci Support Zone: ₹56,260 – ₹56,430
Camarilla Support Levels: ₹56,460 / ₹56,395 / ₹56,328
📈 Resistance Zones:
Resistance 1 (R1): ₹56,987
Resistance 2 (R2): ₹57,444
Resistance 3 (R3): ₹57,718
Fibonacci Resistance Zone: ₹56,992 – ₹57,165
Camarilla Resistance Levels: ₹56,596 / ₹56,663 / ₹56,730
🔸 Pivot Point (Central Level): ₹56,713
🔹 Trend Direction (1-Day Timeframe)
📊 Short-Term Trend: Consolidating with mild bearish pressure.
📉 Price closed below pivot point (₹56,713), signaling short-term weakness.
✅ Still within bullish structure as long as it holds above ₹55,980 – ₹56,000.
🔹 Technical Indicator Snapshot
RSI: Around 58 → Still in bullish territory, but momentum cooling.
MACD: Positive crossover, but histogram flattening — sign of range or pause.
20 EMA: Near ₹57,000 → Price is currently below this level.
50 EMA: Around ₹55,500 → Still acts as major support.
Price Action: Forming inside candles → Indicates compression/indecision.
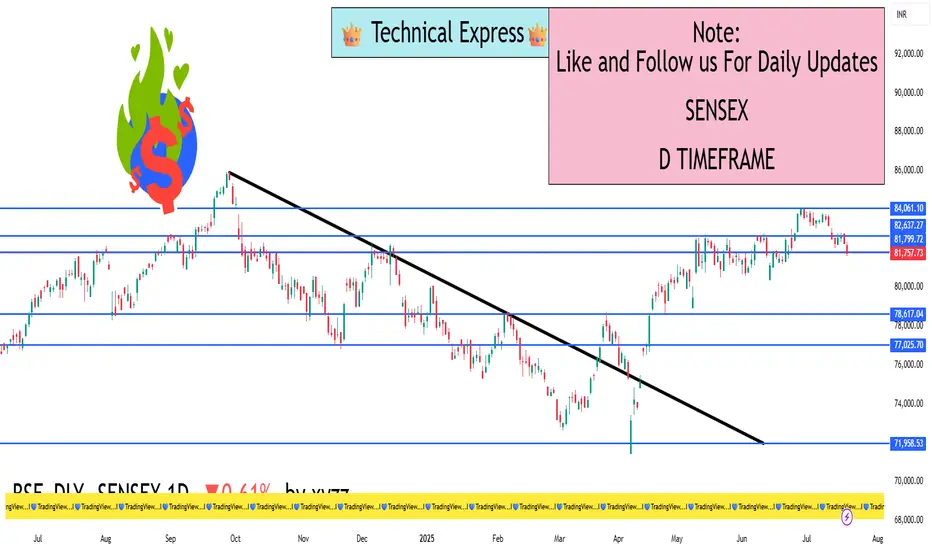
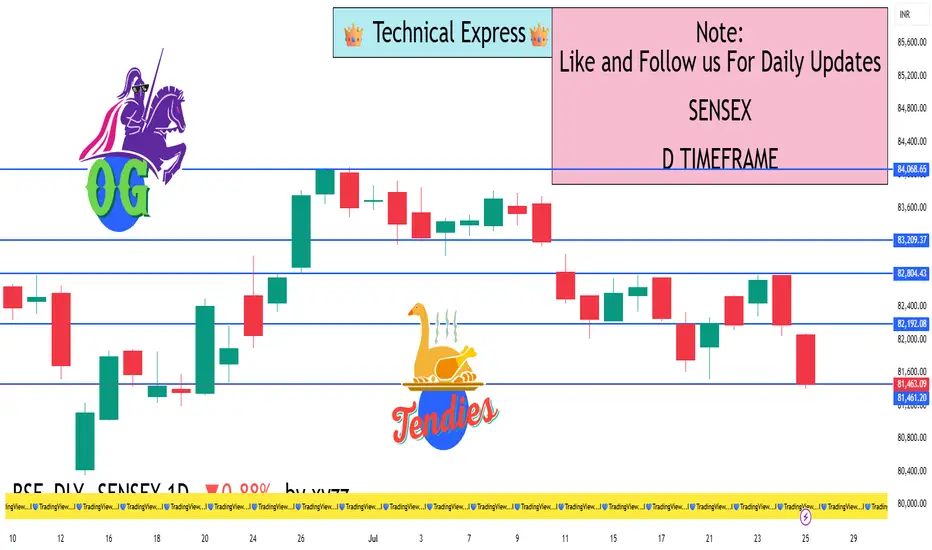
SENSEX 1D TimeframeClosing Value: 81,463.09
Net Change: −721.08 points (−0.88%)
Opening Level: 82,065.76
Day’s High: 82,069.51
Day’s Low: 81,397.69
Trend: Bearish
📊 Technical Analysis:
✅ Candle Type:
Large bearish candle with a close near the day’s low.
Indicates strong selling pressure throughout the session.
🔻 Support Levels:
81,400 – Immediate support (Friday’s low)
81,000 – Critical psychological and technical level
80,700 – Medium-term support zone
🔺 Resistance Levels:
82,070 – Intraday high and near-term resistance
82,300 – Minor resistance
82,500 – Strong resistance zone
📈 Indicator Summary:
RSI (Relative Strength Index): Likely below 50 – shows weakening buying strength
MACD: Bearish crossover – confirms ongoing downtrend
Volume: Higher than average – selling was broad-based and strong
🧠 Market Sentiment:
Bearish sentiment due to pressure in Auto, Banking, Energy, and IT sectors
Major stocks pulling down the index: Reliance, HDFC Bank, Infosys, Tech Mahindra, and Bajaj Finance
Investors showed caution amid FII selling, weak global signals, and earnings season pressure
✅ Conclusion:
Sensex is in a short-term downtrend
A breakdown below 81,000 could trigger a move toward 80,700 or lower
Bulls must reclaim 82,000–82,300 levels to regain positive momentum
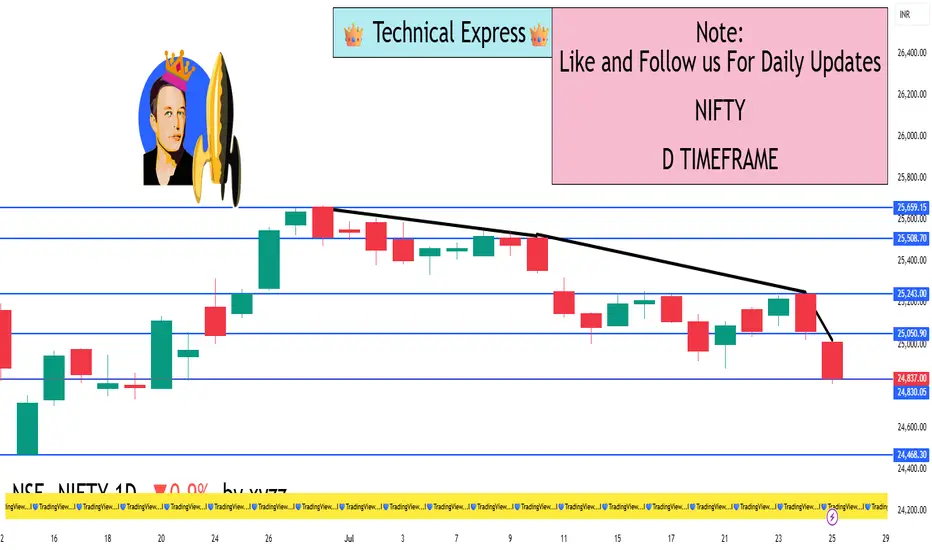
NIFTY 1D TimeframeClosing Price: 24,837.00
Net Change: −225.10 points (−0.90%)
Opening: 24,981.35
High: 25,008.90
Low: 24,770.85
Trend: Bearish
📊 Technical Overview
✅ Candle Type:
Bearish candle formed with a long body and small wicks.
Indicates strong selling pressure throughout the day.
🔻 Support Zones:
24,750 – Immediate support (tested on 25 July)
24,600 – Stronger support zone
24,400 – Medium-term support from early July
🔺 Resistance Zones:
24,900 – Immediate resistance
25,000 – Psychological resistance
25,150–25,300 – Strong resistance zone
📈 Indicators Summary:
RSI: Likely near 45 – showing weakening momentum
MACD: Bearish crossover continues – indicating downward trend
Volume: Slightly higher than average – confirms active selling
🧠 Market Sentiment:
Sentiment remains cautious and bearish.
Selling seen in major sectors like Auto, Energy, FMCG, and Banking.
Only Pharma showed relative strength.
Global cues and foreign investor selling weighed on market sentiment.
This marks the fourth straight weekly loss for the Nifty index.
✅ Conclusion:
Nifty is in a short-term downtrend, unable to sustain above 25,000.
If 24,750 is broken decisively, the next target could be 24,600 or lower.
Bulls must reclaim and hold above 25,000–25,150 to reverse the sentiment.
NIFTY 1D TIMEFRAME🟢 Market Overview
Current Status: Nifty 50 opened with strength today, showing positive momentum.
Previous Close: Around 25,123
Today’s Opening: Roughly +60 to +90 points higher, showing bullish intent
Intraday Range: Between 25,100 (Low) and 25,290 (High)
Current Price (as of late afternoon): Trading around 25,270 to 25,285, indicating a +0.6% to +0.7% gain
🔍 Technical Structure
📈 Trend:
Nifty remains in a bullish trend on the daily chart. Price is holding above 21-EMA and 50-EMA, a sign of strength. The recent breakout above 25,100 confirms bullish continuation.
💹 Candlestick Pattern:
The current candle is forming a strong green bar with minor upper wick – indicating buyers are in control.
Past few candles show a rising channel or ascending triangle, suggesting higher highs and higher lows.
📊 Key Technical Levels
Level Type Price Zone Description
🔼 Resistance 25,300 – 25,350 Immediate resistance zone
🔽 Support 25,050 – 25,100 Strong support (breakout retest area)
📉 Deeper Support 24,800 – 24,900 Demand zone if correction happens
🔁 Indicators Summary
RSI (Relative Strength Index): Around 65–68, in bullish territory but not overbought
MACD: Positive crossover still active, supporting bullish momentum
Volume: Healthy volume on green days, slightly higher than red days — bullish sign
🧠 Price Action Summary
Nifty broke out from a consolidation range between 24,800–25,100
The breakout is holding above the resistance now turned into support, showing market strength
No major reversal patterns spotted yet – trend is intact unless we see heavy selling with volume
🔮 Possible Scenarios
✅ Bullish Case
If Nifty breaks above 25,300, expect move toward 25,450 – 25,500 in coming days
Strength in banking, IT, and auto sectors support this view
⚠️ Bearish Case (Short-Term Only)
If it closes below 25,100, could test 24,800 in short term
Watch for sudden global triggers or heavy profit booking
📦 Sector Performance Overview
🔋 Strong: Banking, Auto, FMCG
🛑 Weak/Flat: Realty, Pharma, Metal
📝 Expert Notes
Institutional buying seen in index-heavyweights like HDFC Bank, Reliance, and TCS
FIIs (Foreign Institutional Investors) have shown net buying in the last two sessions
Market breadth is positive – more stocks advancing than declining
📌 Conclusion
Nifty 50 is showing strong bullish momentum on the 1D chart. Unless we see a sudden breakdown below 25,100, the trend remains positive. A breakout above 25,300 will add more fuel to the rally, possibly pushing the index toward 25,500+ in the coming sessions.
Ideal strategy: Buy on dips near 25,100–25,150 with a stop loss below 25,000 and upside targets of 25,300–25,500.

Aether Industry — 92% profit growth and zero debt NSE:AETHER
A silent specialty chemical beast—92% profit growth and zero debt...!
🏢 **Company Overview:**
Aether Industries is a Surat-based specialty chemical manufacturer focused on high-margin, research-driven intermediates used in pharmaceuticals, agrochemicals, coatings, and oil & gas. It is known for proprietary process chemistry and niche product innovation.
📈 Fundamental Analysis:
✅ Key Financials (FY25 Estimates):
Market Cap: ₹10,900 Cr
Revenue: ₹838 Cr (+40% YoY)
Net Profit: ₹158 Cr (+92% YoY)
EBITDA Margin: ~32%
Net Profit Margin: ~19%
ROE / ROCE: ~7.4% / ~6%
P/E Ratio: ~70x
Debt to Equity: ~0.06 (Debt-free)
🧩 Strengths:
Fast-growing specialty chemical company with proprietary products.
Debt-free and financially stable.
High-margin CRAMS and contract manufacturing model.
⚠️ Risks:
Valuation is rich, pricing in future growth.
Return ratios (ROE/ROCE) are modest compared to peers.
📊 Technical Analysis (As of July 2025):
CMP: ₹823
52-Week Range: ₹725 – ₹1,071
Moving Averages: Price above 50/100-day MAs; approaching 200-day MA
RSI: ~65 (Neutral–Bullish)
MACD: Neutral to Mild Bullish
Support: ₹780 – ₹800
Resistance: ₹832 – ₹840
📉 Short-Term Outlook:
A breakout above ₹840 may trigger upside to ₹900+. A close below ₹800 could lead to short-term weakness.
🚀 Future Growth Prospects:
High-Margin Niche Leadership: Focused on low-volume, high-value intermediates with global demand.
Strong Financial Performance: Consistent revenue and profit growth; scalable R&D-driven model.
Export & Global Pharma Exposure: Major clients across US, EU, and Japan.
New Capacity Expansion: Setting up new manufacturing blocks to double capacity over the next 2 years.
📝 Conclusion:
Parameter Verdict
Fundamentals 🔵 Strong – R&D-led growth with clean balance sheet
Technicals 🟠 Mixed – needs breakout above key resistance
Valuation 🟠 Expensive – high P/E, growth priced in
Long-Term View ✅ Positive – niche specialty play
Short-Term View 🔄 Wait for breakout or accumulate on dips
==========================================================
==========================================================
⚠️ Disclaimer:
This analysis is for educational and informational purposes only.
We are not SEBI-registered analysts or advisors.
This is our personal view based on available data and market trends.
Please consult your SEBI-registered investment advisor before making any investment or trading decisions.
You are solely responsible for any financial decisions you make based on this content.
========================
Trade Secrets By Pratik
========================

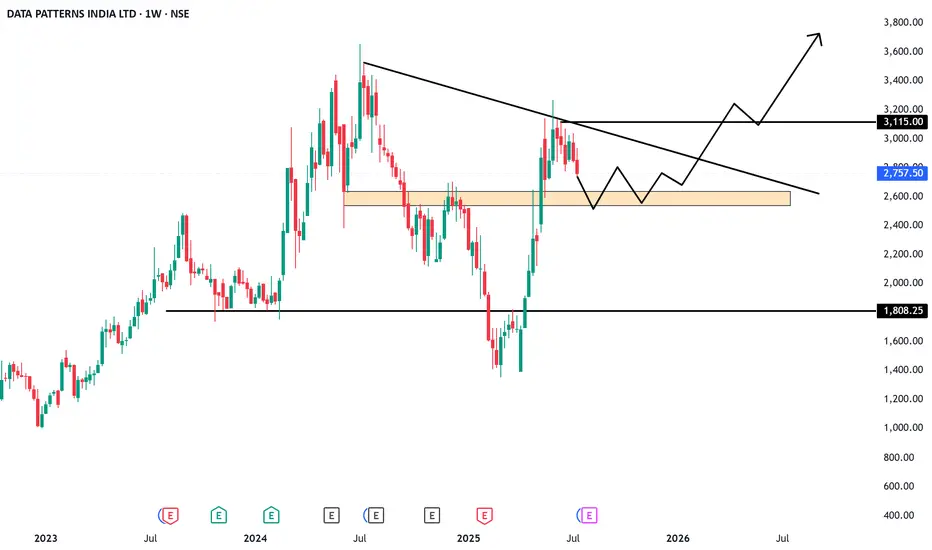
Data Patterns: Brain behind India’s missile, radar & ISRO tech.NSE:DATAPATTNS
🏢 Company Overview:
Data Patterns is a vertically integrated defense and aerospace electronics solutions provider. It designs, develops, manufactures, and tests advanced electronic systems used in:
Radar, Electronic Warfare
Avionics, Missile Systems
Satcom, Communication & Surveillance
It’s one of the few Indian defense electronics companies with end-to-end capabilities—from design to delivery.
📈 Fundamental Analysis:
✅ Key Financials (FY24-25 Estimates):
Market Cap ₹13,000+ Cr
Revenue (FY24) ₹480–500 Cr
EBITDA Margin ~38%
PAT Margin ~28–30%
ROE / ROCE 25%+ / 30%+
Debt to Equity 0 (Debt-free)
P/E Ratio ~70x (Premium)
🧩 Strengths:
Strong order book visibility with over ₹900 Cr+ backlog.
In-house R&D and full control over hardware + software.
Supplied systems to ISRO, DRDO, BEL, HAL — proven credibility.
High margin & asset-light business model.
⚠️ Risks:
Heavy dependency on government contracts (lumpy revenue).
High valuations — pricing in future growth.
Competition from global defense OEMs and local PSU giants.
📊 Technical Analysis (As of July 2025):
🧾 Price Action Summary:
CMP: ₹2,880 (Example)
52-Week Range: ₹1,650 – ₹2,980
Trend: Strong uptrend since Jan 2025
Support Zone: ₹2,550 – ₹2,650
Resistance: ₹3,000 (psychological and technical resistance)
🔍 Indicators:
200 EMA: ₹2,200 (Stock trading well above long-term average)
MACD: Positive with histogram expanding
RSI: 71 – Overbought, watch for pullbacks
Volume: Spikes near breakout levels – confirms strength
📉 Short-Term View:
Likely to consolidate near ₹2,800–₹3,000
Fresh breakout above ₹3,000 may lead to ₹3,400–₹3,600 zone
🚀 Future Growth Prospects:
🛰️ 1. Defense Capex Boom:
Indian Government’s “Atmanirbhar Bharat” push & higher defense budget directly benefits defense tech firms like Data Patterns.
🧠 2. R&D & IP-Led Growth:
Owns IP of most products – high operating leverage and export potential.
🌍 3. Export Market Entry:
Partnering with foreign OEMs; growing traction in South-East Asia, Middle East.
🛠️ 4. Order Book Strength:
High-margin orders across radar, avionics, and missile sub-systems.
Client base includes DRDO, BrahMos, BEL, ISRO, HAL – strong pipeline ahead.
📝 Conclusion:
Parameter Verdict
Fundamentals 🔵 Very Strong (Debt-free, high ROCE)
Technicals 🟢 Bullish (Watch ₹3,000 zone)
Valuation 🟡 Expensive but justified by moat
Long-Term View ✅ Positive – IP-driven defense electronics play
Short-Term View 🔄 Wait for breakout or buy on dips near ₹2,600
=====================================================
=====================================================
⚠️ Disclaimer:
This analysis is for educational and informational purposes only.
We are not SEBI-registered analysts or advisors.
This is our personal view based on available data and market trends.
Please consult your SEBI-registered investment advisor before making any investment or trading decisions.
You are solely responsible for any financial decisions you make based on this content.
========================
Trade Secrets By Pratik
========================
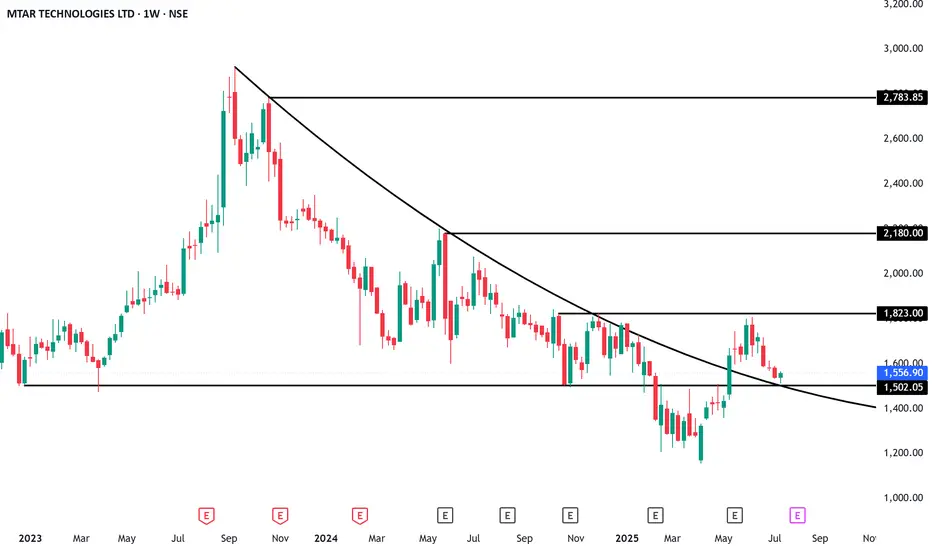
MTAR Technologies: The hidden giant behind space & clean Energy NSE:MTARTECH
🏢 Company Overview:
MTAR Technologies Ltd is a precision engineering company catering to high-value, mission-critical sectors such as:
Clean Energy (Hydrogen, Nuclear, etc.)
Space & Defence
Aerospace
They manufacture critical components like fuel cells, nuclear reactor parts, aerospace engines, and satellite launch system parts.
📈 Fundamental Analysis:
✅ Key Financials (FY24-25 Estimates):
Market Cap : ₹6,500+ Cr
Revenue (FY24) : ₹650 Cr+
EBITDA Margin : ~28-30%
PAT Margin : ~15%
ROE / ROCE : 15-18% / 20%+
Debt to Equity : 0.1 (Very low)
P/E Ratio : ~45x (Premium)
🧩 Strengths:
Strong order book from ISRO, DRDO, BHEL, and international clean energy players like Bloom Energy.
Technological moat in nuclear & space-grade precision engineering.
Low debt, high return ratios—financials are robust.
Entering Hydrogen & Fuel Cell space—a big long-term catalyst.
⚠️ Risks:
Dependency on a few clients (Bloom Energy being a major one).
Volatility in clean energy adoption pace.
High valuation – priced for growth.
📊 Technical Analysis (As of July 2025):
🧾 Price Action Summary:
CMP: ₹2,050 (Example)
52-Week Range: ₹1,250 – ₹2,150
Trend: Bullish continuation from March 2025
Support Zone: ₹1,860 – ₹1,950
Resistance: ₹2,150 (all-time high breakout zone)
🔍 Indicators:
200 EMA: ₹1,620 (Stock trading well above 200 EMA)
MACD: Bullish crossover on daily chart
RSI: ~67—momentum strong but near overbought zone
Volume: Rising steadily with price—confirms strength
📉 Short-Term View:
Healthy consolidation expected around ₹2,000–₹2,150
A breakout above ₹2,150 could lead to ₹2,400–₹2,600 zone
🚀 Future Growth Prospects:
🔬 1. Clean Energy Boom:
Supplying parts to Bloom Energy (US-based Fuel Cell firm).
India’s green hydrogen policy and PLI schemes can benefit MTAR.
🛰️ 2. Space & Defense:
Increasing budgets in defense, ISRO’s new missions, and India’s entry into private space programs can drive long-term orders.
💹 3. Export Potential:
MTAR is entering global markets for nuclear and aerospace precision components.
USD-denominated revenues provide a hedge and higher margins.
🌱 4. Capex & Expansion:
New manufacturing facility in Adibatla, Telangana.
Capex being done to triple capacity in the coming 3–5 years.
📝 Conclusion:
Parameter Verdict
Fundamentals 🔵 Strong (Clean Balance Sheet, Healthy Margins)
Technicals 🟢 Bullish (But Near Resistance)
Valuation 🟡 Slightly Overvalued (but justified by growth)
Long-Term View ✅ Positive – Multiyear structural story
Short-Term View 🔄 Wait for consolidation or breakout above ₹2,150
⚠️ Disclaimer:
This analysis is for educational and informational purposes only.
We are not SEBI-registered analysts or advisors.
This is our personal view based on available data and market trends.
Please consult your SEBI-registered investment advisor before making any investment or trading decisions.
You are solely responsible for any financial decisions you make based on this content.
========================
Trade Secrets By Pratik
========================
Tools
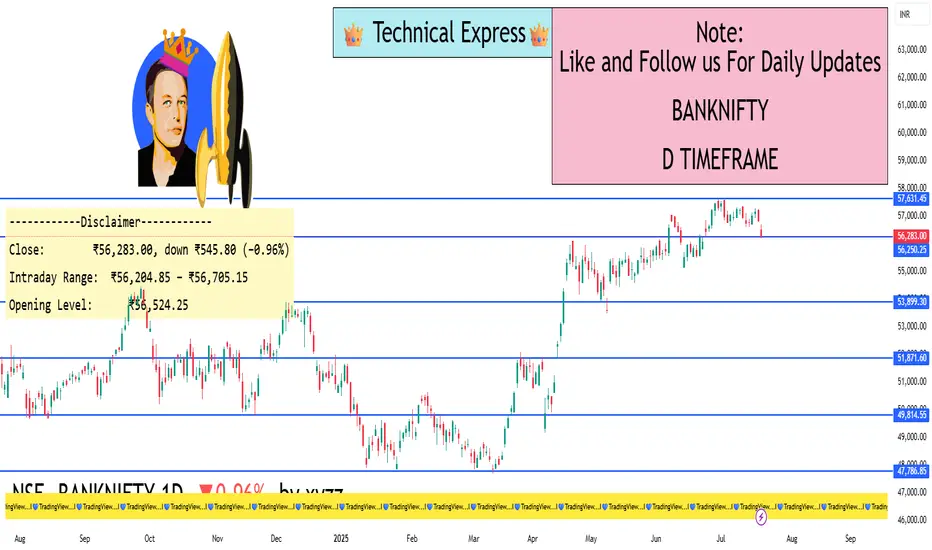
Bank Nifty – 1 Day Timeframe✅ Closing Summary:
Closing Price: ₹56,283.00
Change: −₹545.80 (−0.96%)
Opening Price: ₹56,524.25
Intraday High: ₹56,705.15
Intraday Low: ₹56,204.85
Bank Nifty showed broad weakness throughout the session, closing nearly 1% lower as major banking stocks came under pressure due to weak earnings and cautious sentiment in the financial sector.
🔍 Key Reasons for the Decline:
Earnings Pressure:
Axis Bank posted disappointing Q1 earnings, with higher non-performing assets and weaker loan growth.
This spooked investors, leading to sell-offs in other major banks like HDFC Bank, ICICI Bank, and Kotak Bank.
FIIs Turn Net Sellers:
Foreign Institutional Investors have been consistently selling financial stocks amid global uncertainty, which accelerated the downtrend.
Domestic buying was not strong enough to offset the outflows.
Global Economic Concerns:
Concerns about U.S. Fed interest rate hikes, inflation, and trade tensions globally made investors risk-averse.
Financials, being interest-rate sensitive, felt the brunt of the negative sentiment.
Technical Breakdown:
The index failed to hold above the crucial ₹56,500–₹56,700 range, which acted as a support in the previous few sessions.
This triggered technical selling and stop-loss hits.
📈 Technical Outlook (Short-Term):
Support Zone: ₹56,200 to ₹56,000
If this range is broken convincingly, the index could head toward ₹55,500.
Resistance Zone: ₹56,700 to ₹57,000
A move above this zone is needed for short-term recovery and renewed bullishness.
Indicators:
RSI (Relative Strength Index): Trending below 45, indicating growing bearish momentum.
MACD: Bearish crossover visible, confirming weakness.
Volume: Heavy selling pressure with above-average volumes shows institutional exit.
📆 Recent Trend Performance:
1-Day Return: −0.96%
1-Week Return: −1.12%
1-Month Return: +2.4%
6-Month Return: +14.8%
1-Year Return: +11.3%
Despite the day’s drop, medium- and long-term performance remains strong, backed by sector fundamentals and banking credit growth.
🧠 What Traders & Investors Should Know:
Intraday Traders: Can watch for bounce plays near the ₹56,200 zone, or short positions if ₹56,000 is broken with momentum.
Swing Traders: May wait for confirmation of reversal candles or bullish divergence in RSI before entering new long positions.
Long-Term Investors: Today’s fall could offer buy-on-dip opportunities, especially in quality private banks, provided fundamentals stay strong.
💬 Conclusion:
Bank Nifty faced strong bearish pressure in today’s session, largely due to disappointing bank earnings and negative institutional flows. With key support at ₹56,200 and resistance at ₹56,700–57,000, the next few days will be crucial to determine the short-term direction. If support holds, a technical bounce is possible. However, a breakdown below ₹56,000 could lead to deeper corrections
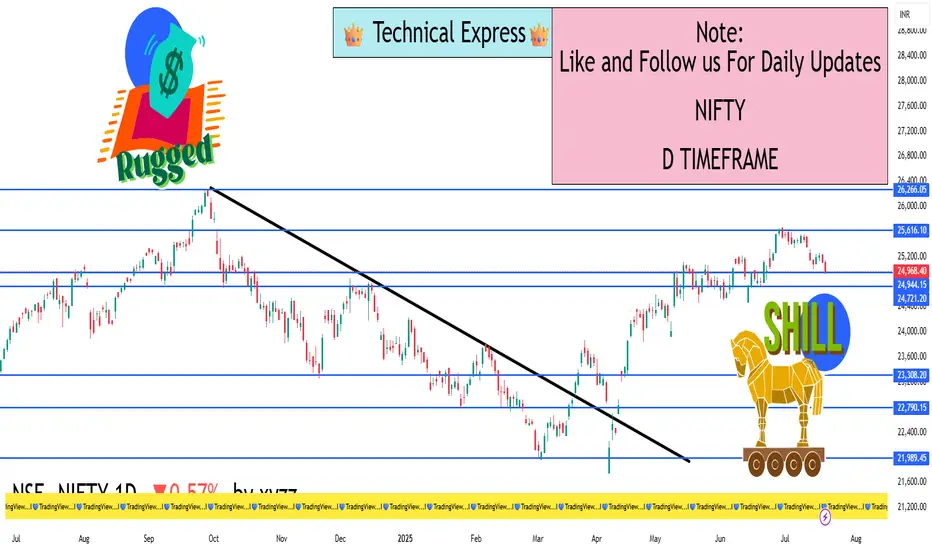
Nifty 50 – 1 Day Timeframe✅ Closing Summary:
Closing Price: ₹24,968.30
Change: −₹143.55 (−0.57%)
Opening Price: ₹25,108.55
Intraday High: ₹25,144.20
Intraday Low: ₹24,919.10
Nifty 50 traded in a narrow but bearish range throughout the session, losing nearly 0.6%, as market sentiment remained weak due to earnings pressure and global cues.
🔍 Key Reasons for the Decline:
Banking Sector Drag:
Major private sector banks like Axis Bank reported weaker-than-expected earnings, sparking a broad sell-off in financials.
Financial stocks make up a large portion of Nifty 50, pulling the entire index lower.
Cautious Investor Sentiment:
Global uncertainty regarding U.S. Federal Reserve interest rate decisions and economic slowdown concerns weighed on overall risk appetite.
Investors are also being cautious ahead of major Indian corporate earnings from companies like HDFC Bank, ICICI Bank, Reliance Industries, and others.
Foreign Institutional Selling (FII):
FIIs continued to sell Indian equities, especially large-cap financials and IT stocks.
This added selling pressure even as some domestic institutional investors tried to buy the dips.
Technical Weakness:
The index slipped below the 25,000 psychological support level, a sign of short-term technical weakness.
Intraday recoveries were capped near resistance, confirming the bearish tone.
📈 Technical Outlook (Short-Term):
Support Zone: ₹24,900 to ₹24,850
This is the next critical area. If broken, further decline toward ₹24,600 is likely.
Resistance Zone: ₹25,150 to ₹25,300
Bulls need to reclaim this zone for the trend to turn positive again.
Momentum Indicators:
RSI: Slipping below 45, showing weakening momentum.
MACD: Bearish crossover; trend remains under pressure.
Volume: Slightly above average, indicating serious selling interest at the top.
📆 Recent Trend Performance:
1-Day Return: −0.57%
1-Week Return: −0.35%
1-Month Return: +2.10%
6-Month Return: +12.8%
1-Year Return: +10.9%
Nifty 50 remains in a medium- to long-term uptrend, but short-term correction is underway, largely due to sector-specific drag and earnings volatility.
🧠 What Traders & Investors Should Know:
Day Traders: Watch for quick reversals near support at ₹24,900; consider shorting near resistance if recovery fails.
Swing Traders: Wait for either a bullish reversal candle or RSI bounce before entering fresh long positions.
Long-Term Investors: Despite the dip, the market remains healthy. This could be a buy-on-dip opportunity, especially in sectors like auto, pharma, and capital goods that are holding well.
💬 Conclusion:
Nifty 50 showed weakness on July 18 due to negative earnings surprises and bearish sentiment in financials. While technical indicators suggest short-term downside pressure, the broader long-term trend remains intact. Key support at ₹24,900 is crucial. A bounce from that zone can trigger a recovery, but a sustained break below it could accelerate the decline
Sensex – 1 Day Timeframe✅ Closing Summary:
Closing Price: ₹82,540.65
Change: −₹501.34 (−0.60%)
Opening Price: ₹83,081.80
Intraday High: ₹83,114.95
Intraday Low: ₹82,488.25
The Sensex fell over 500 points, reflecting broad-based selling across banking, IT, and financial services. The index struggled to hold gains and faced resistance at higher levels throughout the day.
🔍 Key Reasons for the Decline:
Weak Earnings from Financials:
Axis Bank and other financial stocks reported disappointing quarterly results.
As financial stocks hold significant weight in the Sensex, this created negative sentiment across the board.
IT and Tech Sector Pressure:
Global uncertainty, U.S. Fed rate concerns, and weak guidance from global tech firms contributed to a fall in Indian IT stocks like Infosys and TCS, dragging the index.
Foreign Institutional Investor (FII) Selling:
FIIs were net sellers in July, putting pressure on large-cap blue-chip stocks.
Persistent outflows created downward pressure on the index despite support from domestic institutional buyers.
Global Market Cues:
Mixed global signals, rising oil prices, and uncertain interest rate outlooks kept risk sentiment subdued.
Caution ahead of major global economic data further prevented buying enthusiasm.
📈 Technical Outlook (Short-Term):
Support Zone: ₹82,300 to ₹82,000
This is a key demand zone. A breakdown below could lead to further downside towards ₹81,500.
Resistance Zone: ₹83,150 to ₹83,500
Any bounce-back will face selling near this region unless backed by strong buying volume.
Indicators:
RSI: Dropped below 45, indicating weakening strength.
MACD: Shows a bearish crossover, confirming short-term negative momentum.
Volume: Heavier than average, signaling increased institutional activity on the sell side.
📆 Recent Trend Performance:
1-Day Return: −0.60%
1-Week Return: −0.45%
1-Month Return: +1.85%
6-Month Return: +12.3%
1-Year Return: +11.7%
The index remains strong over the long term, but the short-term chart reflects a corrective phase amid sectoral weakness.
🧠 What Traders & Investors Should Know:
Short-Term Traders: Monitor the 82,300 level for signs of bounce or breakdown. Potential intraday setups are forming, but caution is advised.
Swing Traders: Wait for a confirmation candle—like a bullish engulfing or hammer—near the support before entering long positions.
Long-Term Investors: This correction may offer a healthy buy-on-dip opportunity, particularly in stocks with strong fundamentals in auto, capital goods, and FMCG sectors.
💬 Conclusion:
The Sensex declined nearly 0.60% due to earnings pressure from major financials and global uncertainty impacting IT and large-cap stocks. While the market sentiment remains weak in the short term, the long-term uptrend is still intact. Key support around ₹82,300 will determine the near-term direction. If held, a rebound may follow next week, especially if major earnings turn out better than expected.